A Comparison of US Medicare Expenditures for Hemodialysis and Peritoneal Dialysis
- PMID: 35981764
- PMCID: PMC9678042
- DOI: 10.1681/ASN.2022020221
A Comparison of US Medicare Expenditures for Hemodialysis and Peritoneal Dialysis
Abstract
Background: Observations that peritoneal dialysis (PD) may be an effective, lower-cost alternative to hemodialysis for the treatment of ESKD have led to policies encouraging PD and subsequent increases in its use in the United States.
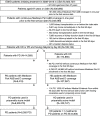
Methods: In a retrospective cohort analysis of Medicare beneficiaries who started dialysis between 2008 and 2015, we ascertained average annual expenditures (for up to 3 years after initiation of dialysis) for patients ≥67 years receiving in-center hemodialysis or PD. We also determined whether differences in Medicare expenditures across dialysis modalities persisted as more patients were placed on PD. We used propensity scores to match 8305 patients initiating PD with 8305 similar patients initiating hemodialysis.
Results: Overall average expenditures were US$108,656 (2017) for hemodialysis and US$91,716 for PD (proportionate difference, 1.11; 95% confidence interval [CI], 1.09 to 1.13). This difference did not change over time (P for time interaction term=0.14). Hemodialysis had higher estimated intravenous (iv) dialysis drug costs (1.69; 95% CI, 1.64 to 1.73), rehabilitation expenditures (1.35; 95% CI, 1.26 to 1.45), and other nondialysis expenditures (1.34; 95% CI, 1.30 to 1.37). Over time, initial differences in total dialysis expenditures disappeared and differences in iv dialysis drug utilization narrowed as nondialysis expenditures diverged. Estimated iv drug costs declined by US$2900 per patient-year in hemodialysis between 2008 and 2014 versus US$900 per patient-year in PD.
Conclusions: From the perspective of the Medicare program, savings associated with PD in patients ≥67 years have remained unchanged, despite rapid growth in the use of this dialysis modality. Total dialysis expenditures for the two modalities converged over time, whereas nondialysis expenditures diverged.
Keywords: Medicare; United States; clinical epidemiology; dialysis; economic analysis; health expenditures; peritoneal dialysis.
Copyright © 2022 by the American Society of Nephrology.
Figures


Comment in
-
Is Home Dialysis the Way Forward for Medicare? Assessing Potential Cost Savings Associated with Peritoneal Dialysis.J Am Soc Nephrol. 2022 Nov 1;33(11):1963-1965. doi: 10.1681/ASN.2022091017. Epub 2022 Nov 1. J Am Soc Nephrol. 2022. PMID: 36224033 Free PMC article. No abstract available.
References
-
- Social security act. Social security act amendments. (Public Law 92-603. §299I codified at 42 U.S.C. §1395rr), 1972.
-
- United States Renal Data System (USRDS) : 2019 USRDS annual data report: Epidemiology of kidney disease in the United States. National Institutes of Health, National Institute of Diabetes and Digestive and Kidney Diseases, Bethesda, MD, 2019. Available at: https://www.usrds.org/media/2371/2019-executive-summary.pdf. Accessed April 1, 2021.
-
- Wong B, Ravani P, Oliver MJ, Holroyd-Leduc J, Venturato L, Garg AX, et al. : Comparison of patient survival between hemodialysis and peritoneal dialysis among patients eligible for both modalities. Am J Kidney Dis 71: 344–351, 2018 - PubMed
-
- Rubin HR, Fink NE, Plantinga LC, Sadler JH, Kliger AS, Powe NR: Patient ratings of dialysis care with peritoneal dialysis vs hemodialysis. JAMA 291: 697–703, 2004 - PubMed
Publication types
MeSH terms
LinkOut - more resources
Full Text Sources
Medical

