. 2022 Aug 18;13(1):4855.
doi: 10.1038/s41467-022-32573-w.

Heterogenous humoral and cellular immune responses with distinct trajectories post-SARS-CoV-2 infection in a population-based cohort

Affiliations

Heterogenous humoral and cellular immune responses with distinct trajectories post-SARS-CoV-2 infection in a population-based cohort

Dominik Menges et al. Nat Commun. .

Abstract

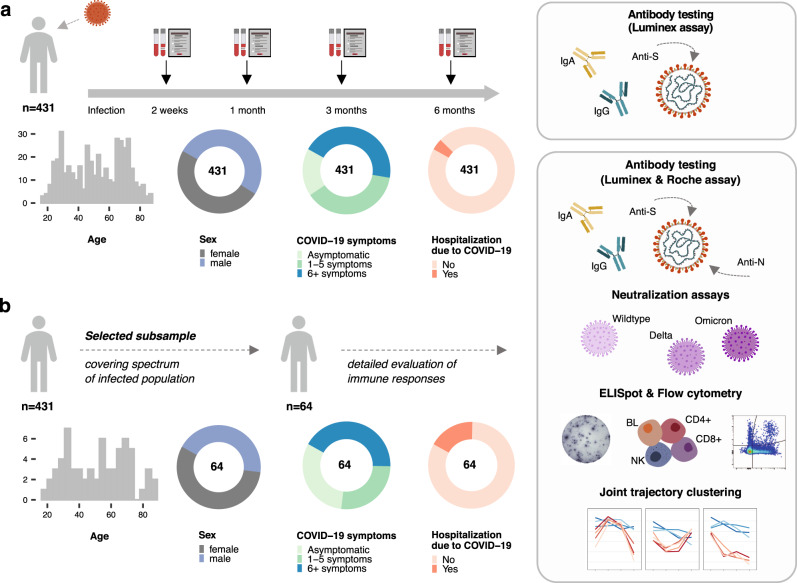
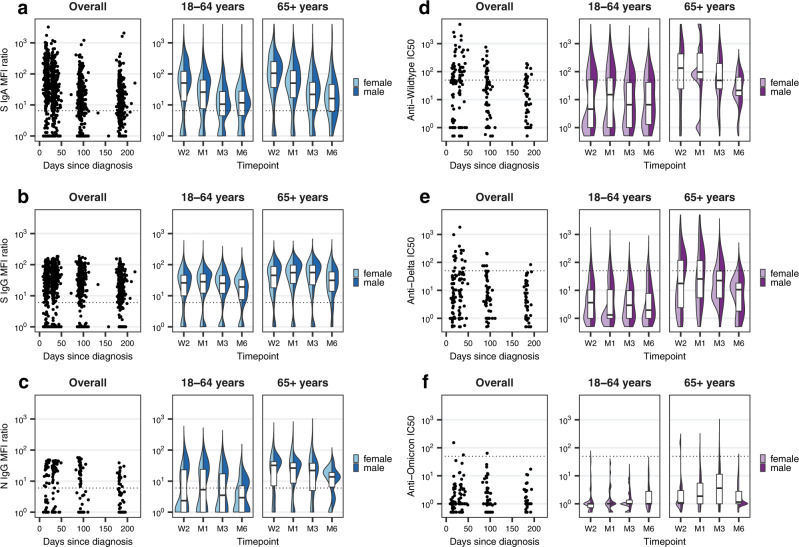
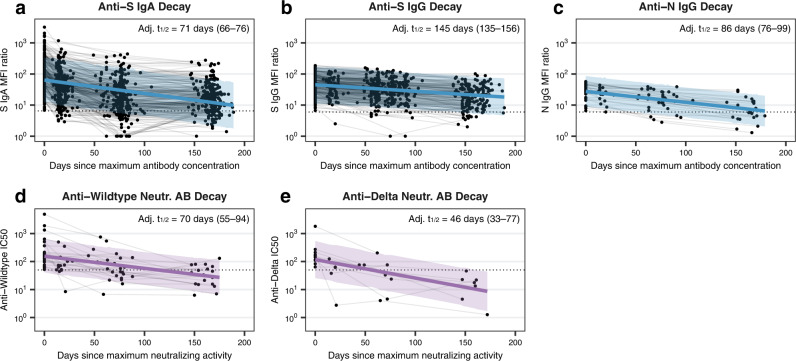
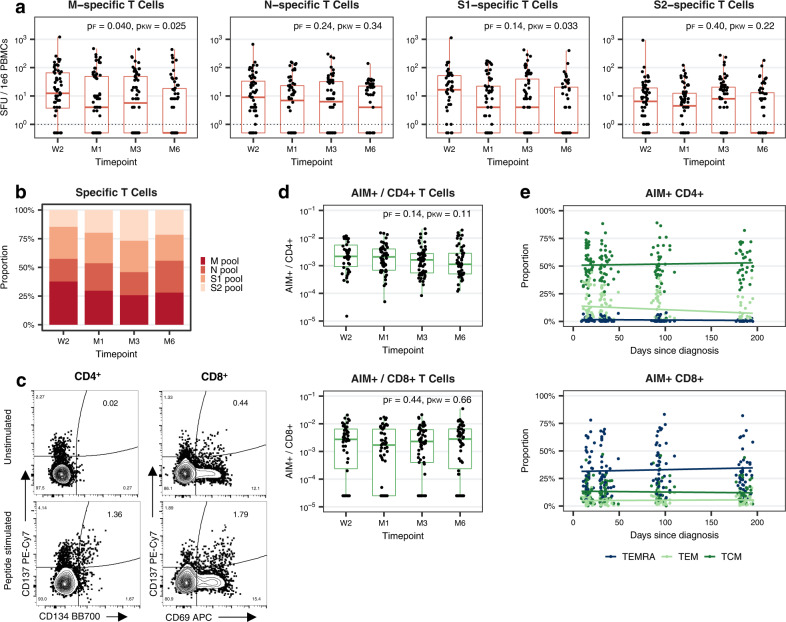
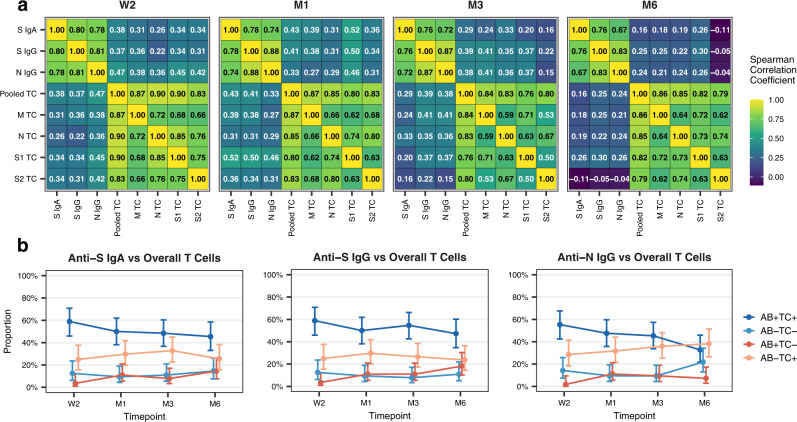
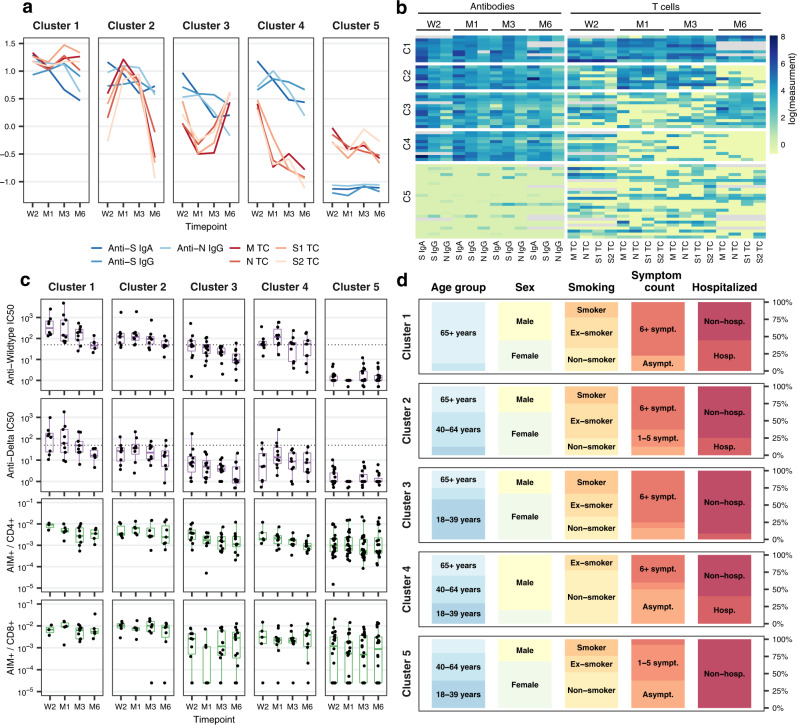
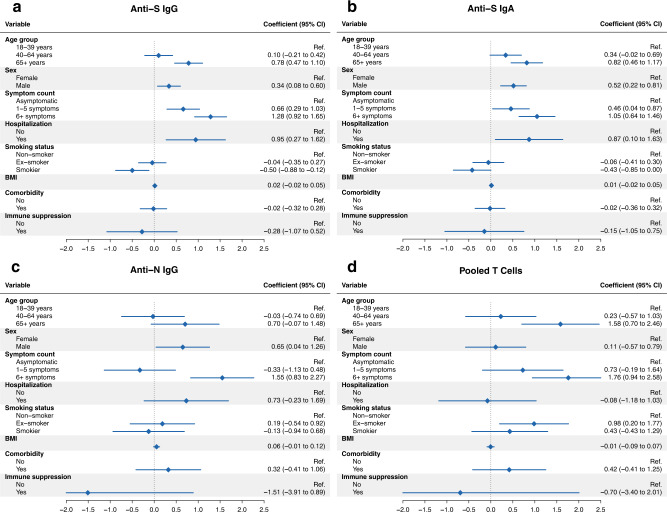
To better understand the development of SARS-CoV-2-specific immunity over time, a detailed evaluation of humoral and cellular responses is required. Here, we characterize anti-Spike (S) IgA and IgG in a representative population-based cohort of 431 SARS-CoV-2-infected individuals up to 217 days after diagnosis, demonstrating that 85% develop and maintain anti-S responses. In a subsample of 64 participants, we further assess anti-Nucleocapsid (N) IgG, neutralizing antibody activity, and T cell responses to Membrane (M), N, and S proteins. In contrast to S-specific antibody responses, anti-N IgG levels decline substantially over time and neutralizing activity toward Delta and Omicron variants is low to non-existent within just weeks of Wildtype SARS-CoV-2 infection. Virus-specific T cells are detectable in most participants, albeit more variable than antibody responses. Cluster analyses of the co-evolution of antibody and T cell responses within individuals identify five distinct trajectories characterized by specific immune patterns and clinical factors. These findings demonstrate the relevant heterogeneity in humoral and cellular immunity to SARS-CoV-2 while also identifying consistent patterns where antibody and T cell responses may work in a compensatory manner to provide protection.


Conflict of interest statement

The authors declare no competing interests.

Figures

Fig. 1
Fig. 1. Study design and population characteristics.
a Study design including follow-up timepoints, evaluated immune responses and clinical characteristics of the overall study population (total n = 431). b Evaluated immune responses and clinical characteristics of the subsample of participants selected to cover the spectrum of the infected population (total n = 64). Source data are provided as a Source Data file.
Fig. 2
Fig. 2. Anti-SARS-CoV-2 S IgA, S IgG, N IgG and neutralizing activity over time.
a Anti-S IgA mean fluorescence intensity (MFI) ratios measured by Luminex assay within the overall study population (total n = 431; W2: n = 403, M1: n = 421, M3: n = 418, M6: n = 334), overall and stratified by age groups and sex. Boxplots in panels af represent the median and interquartile range (IQR; whiskers: 1.5 × IQR). Dotted lines in panels af indicate the limit of detection cutoffs (6.5 for IgA MFI ratios, 6.0 for IgG MFI ratios, and 50 for half maximal inhibitory concentrations (IC50) for neutralizing activity). W2: two weeks, M1: one month, M3: three months, M6: six months after diagnosis. b Anti-S IgG MFI ratios within the overall study population (total n = 431; W2: n = 403, M1: n = 421, M3: n = 418, M6: n = 334), overall and stratified by age groups and sex. c Anti-N IgG MFI ratios within the subsample of individuals selected for detailed testing (total n = 64; W2: n = 59, M1: n = 63, M3: n = 64, M6: n = 56). d IC50 for anti-Wildtype neutralizing antibodies within the subsample (total n = 64; W2: n = 58, M1: n = 60, M3: n = 58, M6: n = 50). e IC50 for anti-Delta neutralizing antibodies within the subsample (total n = 64; W2: n = 58, M1: n = 60, M3: n = 58, M6: n = 50). f IC50 for anti-Omicron neutralizing antibodies within the subsample (total n = 64; W2: n = 58, M1: n = 57, M3: n = 49, M6: n = 41). Source data are provided as a Source Data file.
Fig. 3
Fig. 3. Decay estimation for Anti-SARS-CoV-2 S IgA, S IgG, N IgG and neutralizing activity.
a Anti-S IgA antibody decay estimation within the overall study population based on mixed linear regression model adjusted for time from diagnosis to maximum mean fluorescence intensity (MFI) ratio, age group, sex and symptom count, using a random intercept for individuals. Lines and error bands in panels ae represent regression lines with associated 95% confidence intervals estimated using bootstrap. Dotted lines in panels ae indicate limit of detection cutoffs (6.5 for IgA MFI ratios, 6.0 for IgG MFI ratios, and 50 for half maximal inhibitory concentrations (IC50)). Adj. t1/2: adjusted half-life with associated 95% confidence interval. b Anti-S IgG antibody decay estimation within the overall study population based on mixed linear regression model (adjustment as in panel a). (c) Anti-N IgG antibody decay estimation within the subsample, based on mixed linear regression model (adjustment as in panel a). d Decay estimation for anti-Wildtype neutralizing antibodies within the subsample, based on mixed linear regression model adjusted for time from diagnosis to maximum IC50, age group, sex and symptom count, using a random intercept for individuals. Neutr. AB: neutralizing antibody. e Decay estimation for anti-Delta neutralizing antibodies within the subsample, based on mixed linear regression model (adjustment as in panel d). Decay estimation for anti-Omicron neutralizing antibodies was not possible. Source data are provided as a Source Data file.
Fig. 4
Fig. 4. T cell responses specific to SARS-CoV-2 M, N, S1, and S2 epitope pools over time.
a Number of spot-forming units (SFU) per 1e6 peripheral blood mononuclear cells (PBMCs) following stimulation with M, N, S1, or S2 overlapping peptide pools at indicated timepoints post-diagnosis within the subsample of individuals undergoing detailed testing (total n = 64; W2: n = 56, M1: n = 64, M3: n = 64, M6: n = 55). Boxplots represent the median and interquartile range (IQR; whiskers: 1.5 × IQR). Dotted lines indicate the limit of detection cutoff (SFU values greater than 0). Statistical testing was performed using two-sided Friedman and two-sided Kruskal–Wallis tests to account for both repeated testing and missing data (n = 48 with complete follow-up data). pF: p-value based on Friedman test, pKW: p-value based on Kruskal–Wallis test, W2: two weeks, M1: one month, M3: three months, M6: six months after diagnosis. b Fraction of the pooled T cell response (summed M, N, S1, and S2 SFU values) specific for each peptide pool at indicated timepoints post-diagnosis. c Representative flow cytometry plots depicting AIM+ (CD134+CD137+) CD4+ (left) and AIM+ (CD69+CD137+) CD8+ (right) T cell populations in unstimulated (top) or SARS-CoV-2 megapool peptide-stimulated (bottom) PBMCs. d AIM+ cells as a fraction of CD4+ or CD8+ T cells at indicated timepoints post-diagnosis within the subsample of individuals undergoing detailed testing (total n = 64; W2: n = 46, M1: n = 53, M3: n = 62, M6: n = 54). Boxplots represent median and IQR (whiskers: 1.5  ×  IQR). Statistical testing was performed using two-sided Friedman (n = 35 with complete follow-up data) and two-sided Kruskal–Wallis tests. e Percentage of AIM+CD4+ and AIM+CD8+ T cells with TCM (CD45RACCR7+), TEM (CD45RACCR7) or TEMRA (CD45RA+CCR7) phenotypes by day post-diagnosis. Lines represent trends over time based on unadjusted linear regression models. Source data are provided as a Source Data file.
Fig. 5
Fig. 5. Relationship between antibody and T cell responses over time.
a Heatmaps demonstrating the correlation between anti-S IgA, anti-S IgG, and anti-N IgG levels (as mean fluorescence intensity (MFI) ratios) and M, N, S1, and S2 epitope pool-specific T cells (as spot-forming units (SFU) per 1e6 peripheral blood mononuclear cells (PBMCs)) or pooled T cells (summed M, N, S1, and S2 values) at indicated timepoints. Numbers in individual cells correspond to respective Spearman correlation coefficients. TC: T cell, W2: two weeks, M1: one month, M3: three months, M6: six months after diagnosis. b Proportion of participants with concordant and discordant results between testing positive (detectable response) or negative (no detectable response) for anti-S IgA, anti-S IgG, and anti-N IgG antibody subtypes (i.e., MFI ratio values above or below the limits of detection of 6.5 for IgA and 6.0 for IgG) and between being positive or negative for overall T cell responses (i.e., detectable SFU to at least one peptide pool) over time. Points and error bars represent estimated proportions with associated 95% Wilson confidence intervals. AB: Antibody. Source data are provided as a Source Data file.
Fig. 6
Fig. 6. Clustering of antibody and T cell response trajectories.
a Average mean fluorescence intensity (MFI) ratios of anti-S IgA, anti-S IgG, and anti-N IgG antibodies and mean M, N, S1, and S2 epitope pool-specific T cells (spot-forming units (SFU) per 1e6 peripheral blood mononuclear cells (PBMCs)) in each of the five clusters over time (total n = 64; cluster 1: n = 9, cluster 2: n = 8, cluster 3: n = 12, cluster 4: n = 10, cluster 5: n = 25). Displayed data was natural logarithm-transformed and normalized (rescaled). W2: two weeks, M1: one month, M3: three months, M6: six months after diagnosis. b Heatmap showing anti-S IgA, anti-S IgG, and anti-N IgG MFI ratios and M, N, S1, and S2 epitope pool-specific SFU/1e6 PBMCs for all participants belonging to the five identified clusters. Gray color indicates missing values, displayed data corresponds to natural logarithm-transformed measured data. C1–5: cluster 1 to 5. c Anti-Wildtype SARS-CoV-2 neutralizing antibody half maximal inhibitory concentration (IC50), anti-Delta SARS-CoV-2 neutralizing antibody IC50, frequency of AIM+CD4+ and AIM+CD8+ T cells in the five clusters over time. Boxplots represent the median and interquartile range (IQR; whiskers: 1.5*IQR). Dotted lines indicate limit of detection cutoffs (50 for IC50 for neutralizing activity). d Distribution of participant characteristics within the five clusters according to age group (18–39 years, 40–64 years, ≥65 years), sex (male and female), smoking status (non-smoker, ex-smoker, smoker), number of symptoms reported (asymptomatic, 1–5 symptoms, ≥6 symptoms), and hospitalization status (non-hospitalized, hospitalized) during acute infection. Asympt.: asymptomatic, sympt.: symptoms, hosp.: hospitalized. Source data are provided as a Source Data file.
Fig. 7
Fig. 7. Association analyses of antibody and T cell responses.
a Forest plot demonstrating results from adjusted mixed linear regression analyses evaluating the associations of anti-S IgG mean fluorescence intensity (MFI) ratios with demographic and clinical factors (age, sex, COVID-19 symptom count, smoking status, body mass index, presence of at least one comorbidity and immunosuppression) in the overall study population (total n = 431). The model was adjusted for time since diagnosis, age group, sex, and disease severity expressed as symptom count, with a random intercept for each individual. Points and error bars in panels ad represent estimated coefficients with associated 95% confidence intervals (CIs). BMI: body mass index. b Forest plot showing results from adjusted mixed linear regression analyses evaluating the associations of anti-S IgA MFI ratios with demographic and clinical factors in the overall study population. Model adjustment as for panel a. c Forest plot showing results from adjusted mixed linear regression analyses evaluating the associations of anti-N IgG MFI ratios with demographic and clinical factors in the subsample (total n = 64). Model adjustment as for panel a. d Forest plot demonstrating results from adjusted mixed linear regression analyses evaluating the associations of pooled T cells (summed M, N, S1, and S2 spot-forming units (SFU) per 1e6 peripheral blood mononuclear cells (PBMCs)) with demographic and clinical factors in the subsample. Model adjustment as for panel a. Source data are provided as a Source Data file.

References

    1. World Health Organization (WHO). Coronavirus disease (COVID-19) weekly epidemiological update and weekly operational update. https://www.who.int/emergencies/diseases/novel-coronavirus-2019/situatio... (accessed 09 May 2022).
    1. Wheatley AK, et al. Evolution of immune responses to SARS-CoV-2 in mild-moderate COVID-19. Nat. Commun. 2021;12:1162. doi: 10.1038/s41467-021-21444-5. - DOI - PMC - PubMed
    1. Chia WN, et al. Dynamics of SARS-CoV-2 neutralising antibody responses and duration of immunity: a longitudinal study. Lancet Microbe. 2021;2:e240–e249. doi: 10.1016/S2666-5247(21)00025-2. - DOI - PMC - PubMed
    1. Li K, et al. Dynamic changes in anti-SARS-CoV-2 antibodies during SARS-CoV-2 infection and recovery from COVID-19. Nat. Commun. 2020;11:6044. doi: 10.1038/s41467-020-19943-y. - DOI - PMC - PubMed
    1. Wang K, et al. Longitudinal dynamics of the neutralizing antibody response to severe acute respiratory syndrome coronavirus 2 (SARS-CoV-2) infection. Clin. Infect. Dis. 2021;73:e531–e539. doi: 10.1093/cid/ciaa1143. - DOI - PMC - PubMed

Publication types

Supplementary concepts