. 2022 Aug 18;8(1):106.
doi: 10.1038/s41531-022-00369-w.

Estrogen-related receptor gamma regulates mitochondrial and synaptic genes and modulates vulnerability to synucleinopathy

Affiliations

Estrogen-related receptor gamma regulates mitochondrial and synaptic genes and modulates vulnerability to synucleinopathy

S N Fox et al. NPJ Parkinsons Dis. .

Abstract

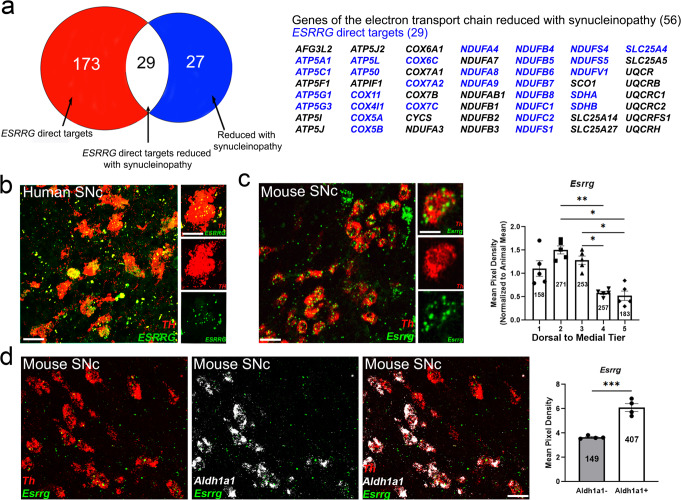
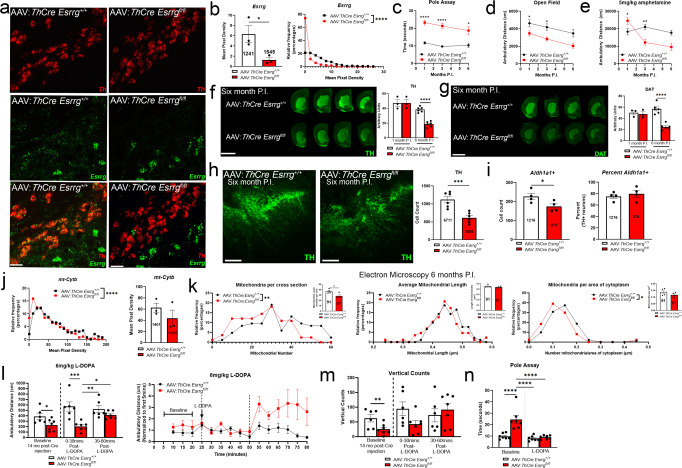
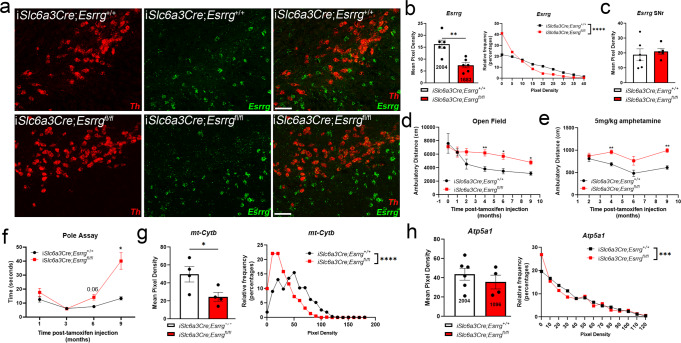
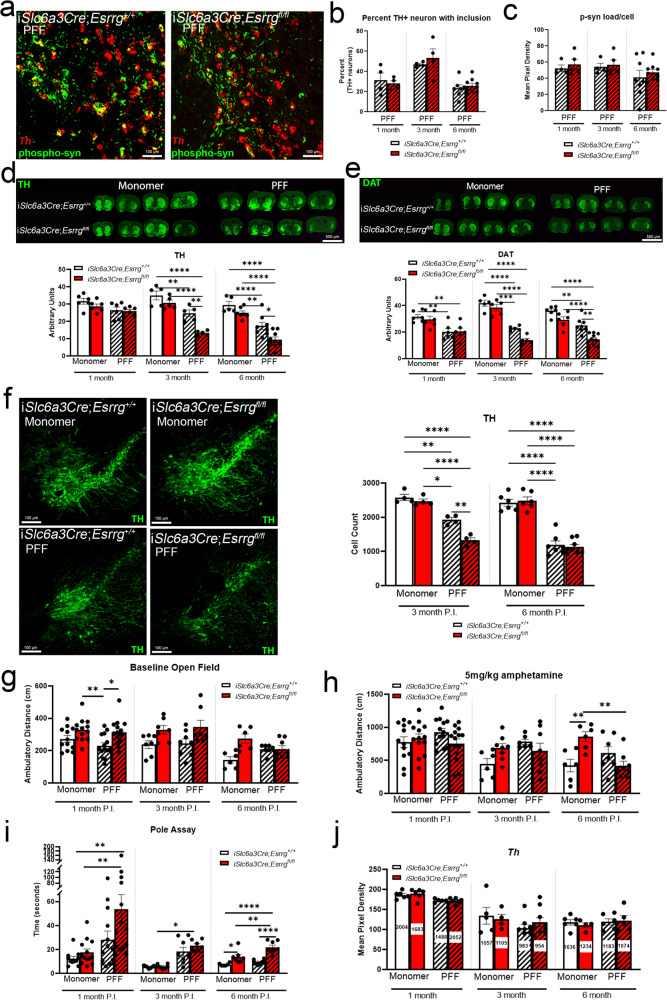
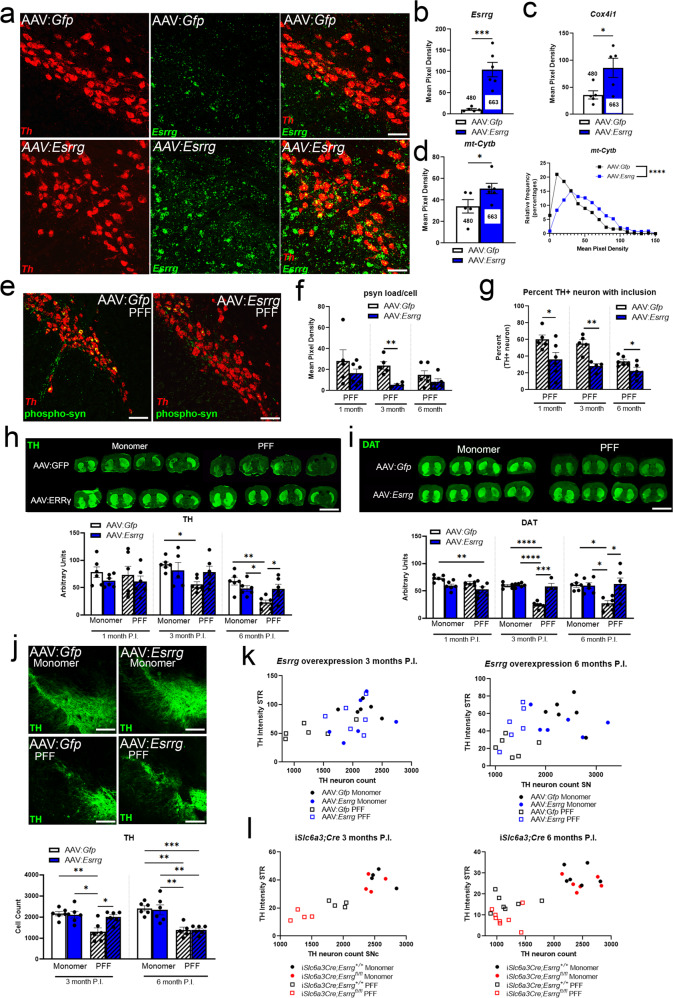
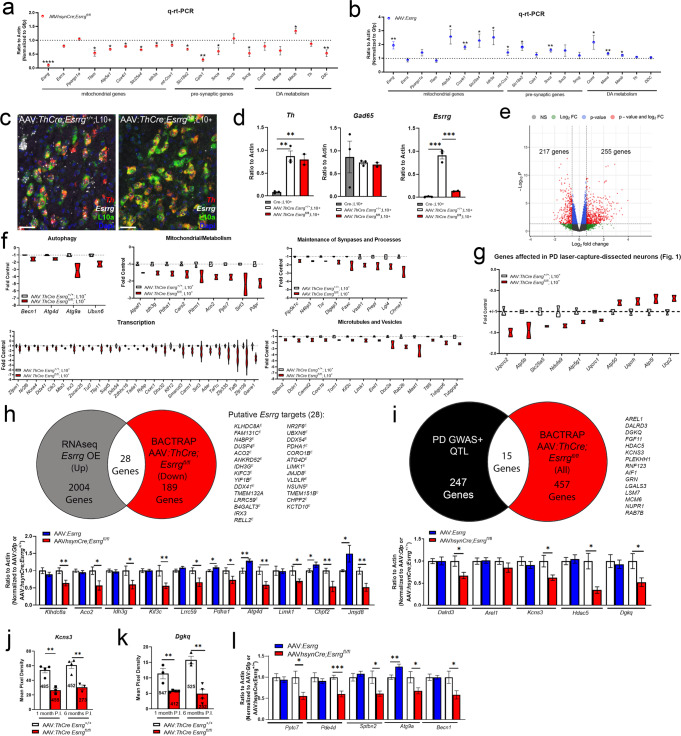
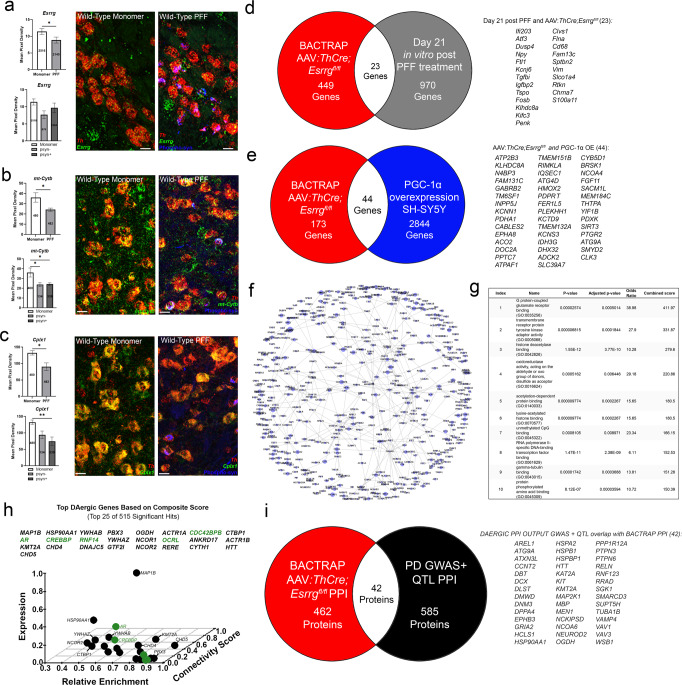
Many studies implicate mitochondrial dysfunction as a key contributor to cell loss in Parkinson disease (PD). Previous analyses of dopaminergic (DAergic) neurons from patients with Lewy-body pathology revealed a deficiency in nuclear-encoded genes for mitochondrial respiration, many of which are targets for the transcription factor estrogen-related receptor gamma (Esrrg/ERRγ). We demonstrate that deletion of ERRγ from DAergic neurons in adult mice was sufficient to cause a levodopa-responsive PD-like phenotype with reductions in mitochondrial gene expression and number, that partial deficiency of ERRγ hastens synuclein-mediated toxicity, and that ERRγ overexpression reduces inclusion load and delays synuclein-mediated cell loss. While ERRγ deletion did not fully recapitulate the transcriptional alterations observed in postmortem tissue, it caused reductions in genes involved in synaptic and mitochondrial function and autophagy. Altogether, these experiments suggest that ERRγ-deficient mice could provide a model for understanding the regulation of transcription in DAergic neurons and that amplifying ERRγ-mediated transcriptional programs should be considered as a strategy to promote DAergic maintenance in PD.


Conflict of interest statement

The authors declare no competing interests.

Figures

Fig. 1
Fig. 1. ERRγ targets ETC genes reduced with synucleinopathy and is expressed in DAergic neurons.
a Of the 56 genes that are reduced with synucleinopathy and expressed in dopaminergic neurons, 29 genes are also direct targets of ESRRG. sm-FISH in human (b) or mouse (c) SNc for both Esrrg (green) and Th (red) transcripts demonstrate expression of Esrrg in DAergic neurons. sm-FISH for Esrrg transcript was quantified in Th-positive neurons from the dorsal tier to the medial tier of the SNc in mice (n = 5 mice/group repeated measures one-way ANOVA with Tukey’s post hoc analysis *p < 0.05, **p < 0.01). d sm-FISH for Esrrg (green), Th (red), and Aldh1a1 (white) shows Esrrg is more highly expressed in the Aldh1a+ population compared to the Aldh1a1− population (n = 3 mice/group; two-tailed unpaired t-test ***p < 0.001). Numbers on bars are total cell counts from each group of an experiment. Scale bars correspond to 50 µm (b, c) and 10 µm (b, c). Error bars represent ±SEM.
Fig. 2
Fig. 2. Adulthood deletion of Esrrg from DAergic neurons causes motor impairment, cell loss, and a reduction in mitochondrial number.
a sm-FISH for Esrrg (green) and Th (red) transcript in Esrrg+/+ and Esrrgfl/fl mice injected with AAV:ThCre into the midbrain, quantified in b (n = 4 mice/genotype; two-tailed unpaired t-test *p < 0.05 or unpaired nonparametric Kolmogorov–Smirnov test ****p < 0.0001). ce Ambulatory behavior in Esrrg+/+ and Esrrgfl/fl mice injected with AAV:ThCre (1 month n = 21 mice/genotype; 3 months n = 18–17 mice/genotype; 6 months n = 7 mice/genotype; mixed-effects analysis with Sidak’s post hoc analysis *p < 0.05, **p < 0.01, ****p < 0.0001). f, g TH and DAT immunoreactivity in the striatum of mice 6 months post-injection (P.I.) (n = 3/genotype 1-month P.I.; n = 6/genotype 6 months P.I., mixed-effects analysis with Sidak’s post hoc analysis ****p < 0.0001). h TH immunoreactivity in the SNc 6 months P.I. (n = 6 mice/group; two-tailed unpaired t-test ***p < 0.001). i sm-FISH for Aldh1a1+ populations at 6 months P.I. (n = 4 mice/group; two-tailed unpaired t-test *p < 0.05). j sm-FISH for mitochondrially encoded gene cytb in mice 1 month P.I. (n = 4 per group; two-tailed unpaired t-test or unpaired nonparametric Kolmogorov–Smirnov test ****p < 0.0001). k Electron microscopy in neurons stained with TH and deficient in Esrrg at 6 months P.I. (n = 6 mice/group; two-tailed unpaired t-test *p < 0.05 or unpaired nonparametric Kolmogorov–Smirnov test *p < 0.05, **p < 0.01). ln Ambulatory distance, vertical counts, and pole-assay in Esrrg+/+ and Esrrgfl/fl mice 14 months P.I. AAV:ThCre into the midbrain at baseline and after acute injection of L-DOPA (n = 7 mice/group; two-way ANOVA with Tukey’s post hoc analysis *p < 0.05, **p < 0.01, ***p < 0.001). Numbers on bars are cell counts from each experiment. Scale bars correspond to 50 µm (b),100 µm (h), and 200 µm (f, g). Error bars represent ±SEM.
Fig. 3
Fig. 3. Partial reduction in Esrrg expression in adult DAergic neurons using an inducible Cre causes different phenotypes than complete lack of Esrrg.
a, b sm-FISH for Esrrg (green) and Th (red) transcript in iSlc6a3Cre;Esrrg+/+ and iSlc6a3Cre;Esrrgfl/fl mice (n = 4 mice/genotype; two-tailed unpaired t-test *p < 0.05, or unpaired nonparametric Kolmogorov–Smirnov test ****p < 0.0001). c Quantification of Esrrg by sm-FISH in substantia nigra pars reticulata (SNr). df Ambulatory and pole assay behavior up to 9 months post-tamoxifen injection (12 months of age) (n = 5–13 mice/group; mixed-effects analysis with Sidak’s post hoc analysis *p < 0.05, **p < 0.01). g sm-FISH for the mitochondrially encoded gene Cytb (n = 4/group; two-tailed unpaired t-test or unpaired nonparametric Kolmogorov–Smirnov test *p < 0.05, ****p < 0.0001). h sm-FISH for the nuclear-encoded mitochondrial gene Atp5a1 (n = 4/group; two-tailed unpaired t-test or unpaired nonparametric Kolmogorov–Smirnov test ***p < 0.001). Numbers on bars are cell counts from each experiment. Scale bars correspond to 50 µm a. Error bars represent ±SEM.
Fig. 4
Fig. 4. Partial deletion of Esrrg accelerates terminal and cell loss in the pre-formed fibril (PFF) model of synucleinopathy.
a sm-FISH for Th (red) followed by immunofluorescence for phosphorylated α-synuclein (green). b Percent of Th+ neurons with an inclusion 1, 3 and 6 months post-injection (P.I.) of tamoxifen and PFFs (n = 5–9 mice/group; two-tailed unpaired t-test, n.s.). c Mean pixel density (occupancy of the cytoplasm) for phosphorylated α-synuclein (p-syn) per neuron 1, 3 and 6 months P.I. (n = 5–9 mice/group; two-tailed unpaired t-test at each time-point, n.s.). d, e TH or DAT immunofluorescence in the striatum at 3 months P.I. with quantification at 1, 3 and 6 months P.I. (n = 5–9/group, mixed-effects analysis with Sidak’s post hoc analysis at each time-point *p < 0.05, **p < 0.01,***p < 0.001, ****p < 0.0001). f Immunofluorescence for TH in the SNc 3 months P.I. (3 months: n = 5 mice/group, 6 months: n = 7–9/group; Mixed-effects analysis with Sidak’s post hoc analysis at each time-point *p < 0.05, ****p < 0.0001). gi Ambulatory behavior and pole assay test 1, 3 and 6 months P.I. (n = 6–14 mice per group; Mixed-effects analysis with Sidak’s post hoc analysis at each time-point *p < 0.05, **p < 0.01, ***p < 0.001, ****p < 0.0001). j sm-FISH, single-cell Th mRNA analysis in all groups at all time-points P.I. (1 month: n = 6 mice/group, 3 months: n = 5/group, 6 months: n = 7–9/group; Mixed-effects analysis with Sidak’s post hoc analysis at each time-point, n.s.). Numbers on bars are cell counts from each experiment. Scale bars correspond to 100 µm (a, f), and 500 µm (d, e). Error bars represent ±SEM.
Fig. 5
Fig. 5. Overexpression of Esrrg in the midbrain causes an induction in mitochondrial genes and delays cell death in the PFF model of synucleinopathy.
a sm-FISH for Th (red) and Esrrg (green) in mice with AAV:Gfp or AAV:Esrrg midbrain injections, quantified in b (n = 6 mice/group; two-tailed unpaired t-test *p < 0.05). c, d sm-FISH quantification for nuclear encoded mitochondrial gene Cox4i1 and mitochondrially encoded gene mt-cytb (n = 6/group two-tailed unpaired t-test or unpaired nonparametric Kolmogorov–Smirnov test ****p < 0.0001). e sm-FISH for Th (red) followed by immunofluorescence for phosphorylated α-synuclein (p-syn; green) at 1 month post-injection (P.I.). f Mean pixel density (occupancy of the cytoplasm) for p-syn per neuron at 1, 3 and 6 months P.I. (n = 4–6 mice/group; two-tailed unpaired t-test at each time-point **p < 0.005). g Percent of Th+ with presence of an inclusion for p-syn (n = 4–6 mice/group; two-tailed unpaired t-test at each time-point *p < 0.05, **p < 0.005). h, i Immunofluorescence for TH or DAT in the striatum of mice injected with AAV:Gfp or AAV:Esrrg and/or monomer or PFFs (n = 6 mice/group; mixed-effects analysis with Sidak’s post hoc analysis at each time-point *p < 0.05, **p < 0.005, ***p < 0.001, ****p < 0.0001). j Neurons positive for TH immunoreactivity in mice injected with AAV:Gfp or AAV:Esrrg and/or monomer or PFFs (n = 6 mice/group; mixed-effects analysis with Sidak’s post hoc analysis at each time-point *p < 0.05, **p < 0.05). k, l Scatter plots to graph SNc TH neuron count and striatal TH intensity per animal at 3 and 6-months P.I. Numbers on bars are cell counts from each experiment. Scale bars correspond to 50 µm (a),100 µm (e, j), and 500 µm (h, i). Error bars represent ±SEM.
Fig. 6
Fig. 6. BAC-TRAP from mice lacking Esrrg in DAergic neurons revealed genes related to autophagy, mitochondrial and synaptic function, transcription, and microtubule- and vesicle-related pathways.
a, b q-rt-PCR data from midbrain of mice lacking Esrrg (AAV-hsynCre Esrrgfl/fl vs. AAV-hsynCre Esrrg+/+) or of mice overexpressing Esrrg (AAV-Esrrg vs. AAV-Gfp) (n = 7–8/group; two-tailed unpaired t-test *p < 0.05, **p < 0.01). c Representative images from sm-FISH for Th (red), Esrrg (white), endogenous GFP-L10a (green), and DAPI (blue) in Esrrg+/+;L10+ and Esrrgfl/fl; L10+ mice injected with AAV:ThCre to induce the Gfp-Rpl10a transgene in DAergic neurons. d q-rt-PCR from BAC-TRAP pulldowns for Th, Gad65 and Esrrg transcript for confirmation of enrichment of DAergic markers and exclusion of inhibitory neuron markers (n = 2–3/group; one-way ANOVA with Tukey’s post hoc analysis **p < 0.01, ***p < 0.001). e Volcano plot showing differentially expressed genes in AAV:ThCre-injected Esrrg+/+;L10+ and Esrrgfl/fl; L10+ mice after sequencing (gray = no significance, green = ±1.5 log2-fold change, blue = significant padj value, red = significant padj value and differentially expressed ±1.5 log2-fold change). f Fold control expression of genes downregulated with Esrrg deletion by functional category. g Fold control of ETC genes reduced in PD patients that had significant padj values but not ±1.5 log2 fold change. h Pie chart demonstrating overlap between genes changed with Esrrg overexpression in SH-SY5Ys and genes changed with Esrrg knockout with BAC-TRAP. Q-rt-PCR with Esrrg knockout or overexpression from genes identified as putative targets of Esrrg (n = 5–8 mice/group; two-tailed unpaired t-tests *p < 0.05, **p < 0.01). i Overlap of predicted PD GWAS and QTL genes and genes changed with Esrrg knockout using BAC-TRAP in DAergic neurons. qPCR from targets in both Esrrg knockout and overexpression in the midbrain (n = 5–8 mice; two-tailed unpaired t-test *p < 0.05). j, k sm-FISH for the identified targets Kcns3 and Dgkq at both 1 and 6 months P.I. of AAV-ThCre (n = 3–4/group; two-tailed unpaired t-test *p < 0.05, **p < 0.01). l q-rt-PCR from Esrrg knockout (AAV-hsynCre) or overexpression (AAV-Esrrg) midbrain homogenate for autophagy and microtubule and vesicle-related genes (n = 5–8 mice/group; two-tailed unpaired t-test *p < 0.05, **p < 0.01, ***p < 0.001). Numbers on bars are cell counts from each experimental group. Scale bars correspond to 50 µm (c). Error bars represent ± SEM.
Fig. 7
Fig. 7. Esrrg-dependent pathway disruption in PFF-containing neurons and other PD models.
ac sm-FISH quantification of select Esrrg-dependent genes in DAergic neurons with and without phosphorylated α-synuclein (p-syn) inclusions (n = 6–14/group; two-tailed unpaired t-test or one-way ANOVA with Tukey’s post hoc analyses *p < 0.05, **p < 0.01). d Venn diagram showing overlap with genes from BAC-TRAP with Esrrg deletion and day 21 post in vitro PFF treated neurons. e Venn diagram showing overlap between BAC-TRAP with Esrrg deletion and PGC-1α overexpression in SH-SY5Y’s. f Protein-protein-interaction model to identify convergent targets of transcripts altered by Esrrg deletion as detected by BAC-TRAP. g Gene Ontology molecular function as identified with Enrichr from proteins generated from BAC-TRAP PPI. h Top DAergic neuron hits from BAC-TRAP PPI data by connectivity score and abundance and relative enrichment in DAergic neurons; green signifies druggable target. i Overlap of BAC-TRAP PPI proteins with convergent proteins identified in a PPI generated from PD GWAS and QTL. Numbers on bars are cell counts from each experiment. Scale bars correspond to 10 µm (ac). Error bars represent ±SEM.

References

    1. Maiti P, Manna J, Dunbar GL. Current understanding of the molecular mechanisms in Parkinson’s disease: targets for potential treatments. Transl. Neurodegener. 2017;6:28. doi: 10.1186/s40035-017-0099-z. - DOI - PMC - PubMed
    1. Cheng H-C, Ulane CM, Burke RE. Clinical progression in Parkinson disease and the neurobiology of axons. Ann. Neurol. 2010;67:715–725. doi: 10.1002/ana.21995. - DOI - PMC - PubMed
    1. Bindoff LA, Birch-Machin M, Cartlidge NEF, Parker WD, Turnbull DM. Mitochondrial function in Parkinson’s disease. Lancet. 1989;334:49. doi: 10.1016/S0140-6736(89)90291-2. - DOI - PubMed
    1. Schapira AH, et al. Mitochondrial complex I deficiency in Parkinson’s disease. J. Neurochem. 1990;54:823–827. doi: 10.1111/j.1471-4159.1990.tb02325.x. - DOI - PubMed
    1. Büeler H. Impaired mitochondrial dynamics and function in the pathogenesis of Parkinson’s disease. Exp. Neurol. 2009;218:235–246. doi: 10.1016/j.expneurol.2009.03.006. - DOI - PubMed