. 2022 Aug 18;5(1):834.
doi: 10.1038/s42003-022-03559-7.

Subtype and cell type specific expression of lncRNAs provide insight into breast cancer

Collaborators, Affiliations

Subtype and cell type specific expression of lncRNAs provide insight into breast cancer

Sunniva Stordal Bjørklund et al. Commun Biol. .

Abstract

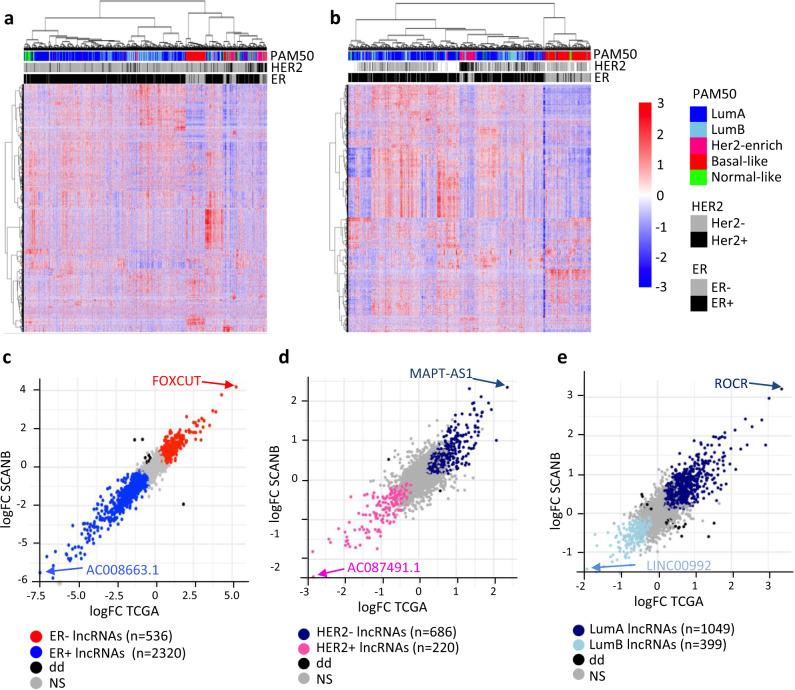
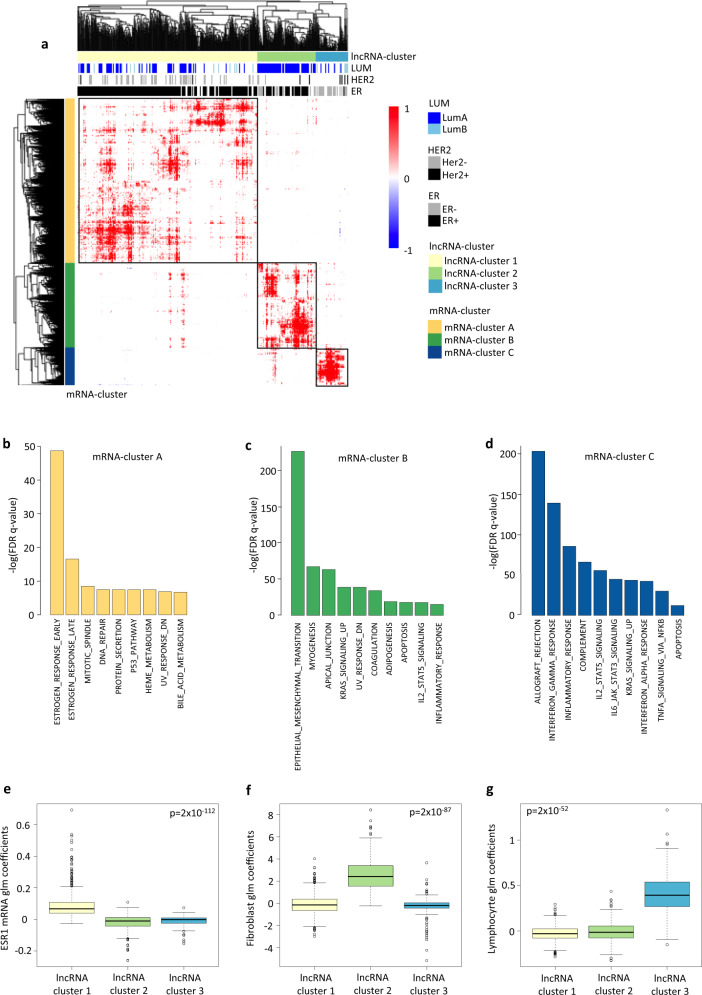
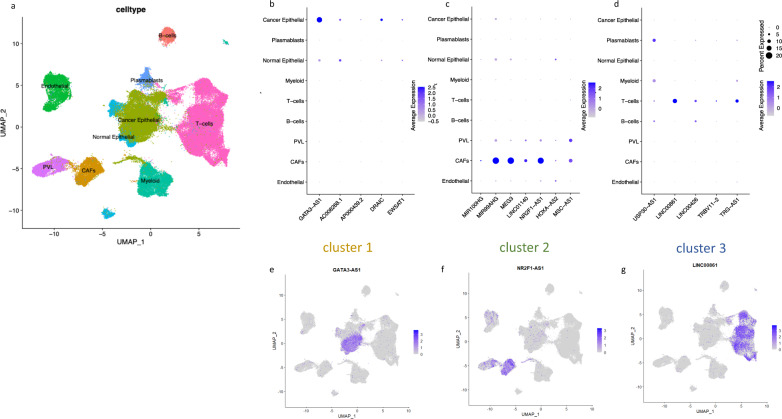
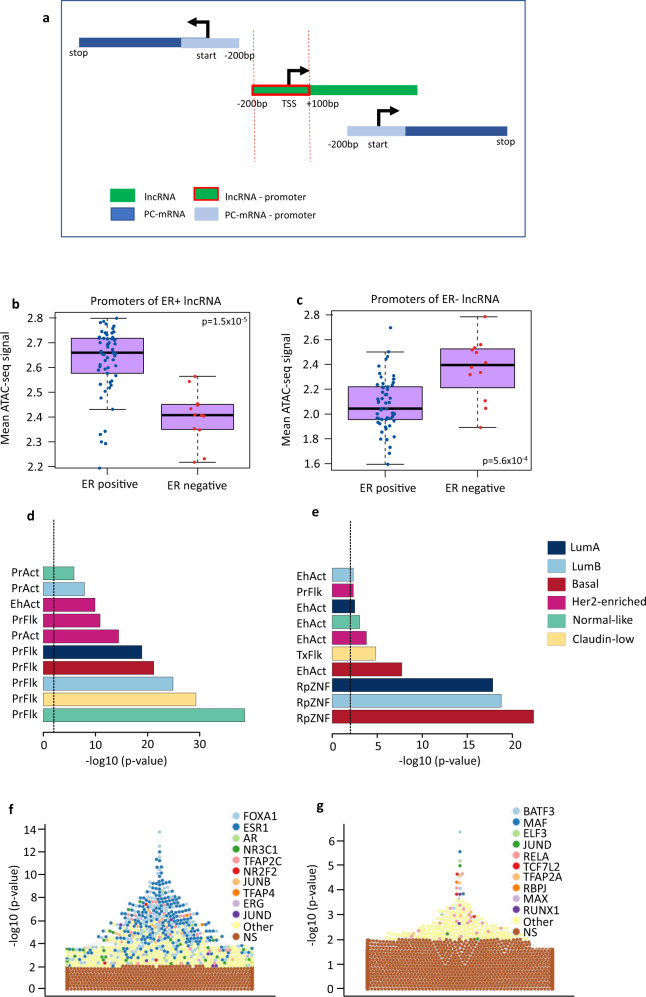
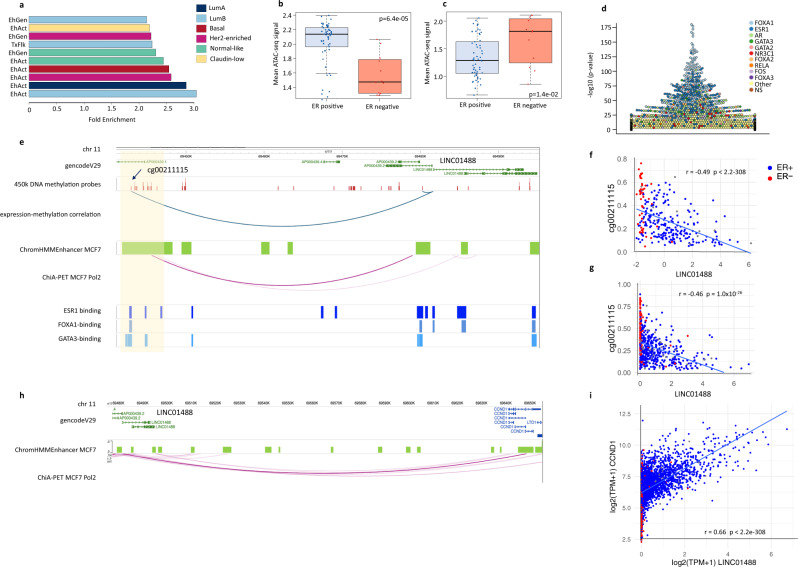
Long non-coding RNAs (lncRNAs) are involved in breast cancer pathogenesis through chromatin remodeling, transcriptional and post-transcriptional gene regulation. We report robust associations between lncRNA expression and breast cancer clinicopathological features in two population-based cohorts: SCAN-B and TCGA. Using co-expression analysis of lncRNAs with protein coding genes, we discovered three distinct clusters of lncRNAs. In silico cell type deconvolution coupled with single-cell RNA-seq analyses revealed that these three clusters were driven by cell type specific expression of lncRNAs. In one cluster lncRNAs were expressed by cancer cells and were mostly associated with the estrogen signaling pathways. In the two other clusters, lncRNAs were expressed either by immune cells or fibroblasts of the tumor microenvironment. To further investigate the cis-regulatory regions driving lncRNA expression in breast cancer, we identified subtype-specific transcription factor (TF) occupancy at lncRNA promoters. We also integrated lncRNA expression with DNA methylation data to identify long-range regulatory regions for lncRNA which were validated using ChiA-Pet-Pol2 loops. lncRNAs play an important role in shaping the gene regulatory landscape in breast cancer. We provide a detailed subtype and cell type-specific expression of lncRNA, which improves the understanding of underlying transcriptional regulation in breast cancer.


Conflict of interest statement

The authors declare no competing interests.

Figures

Fig. 1
Fig. 1. lncRNA expression in breast cancer subtypes.
Hierarchical clustering of log2(TPM + 1) of 4108 lncRNAs expressed above filtering thresholds (see Methods) in the SCAN-B (a), and TCGA-BRCA (b) cohorts. Estrogen Receptor (ER) and Her2 status, as well as PAM50 subtypes are annotated at the top of the heatmap. The expression gradient (blue to red) represents scaled and centered log2(TPM + 1). ce Dot plot of the log Fold Change (FC) from the differential expression analysis using a fitted Limma model (lmfit) and moderated t-statistic (eBayes) between patients of different subtypes in SCAN-B (x-axis) and TCGA-BRCA (y-axis). Each dot represents a lncRNA, while the colour indicates the subtype with the highest expression c ER positive (blue) and ER negative (red), d Her2 negative (dark blue) and Her2 positive (pink). e Luminal A (dark blue), and Luminal B (light blue). Gray dots are lncRNAs that are not significantly differentially expressed, while black dots represent lncRNAs with opposite fold change (FC) in the two cohorts. The number of patients in each clinical group were as follows: ER positive (n = 2409 and n = 807), ER negative (n = 504 and n = 237), Her2 positive (n = 458 and n = 114), Her2 negative (n = 2845 and n = 650), Luminal A (n = 1769 and n = 562), and Luminal B (n = 766 and n = 209) in SCAN-B and TCGA-BRCA respectively.
Fig. 2
Fig. 2. Clustering of lncRNA into relevant pathways for breast cancer.
a Hierarchical clustering of lncRNA-mRNA Spearman correlation values (positive correlation in red, negative correlation in blue) following co-expression analysis between lncRNAs (n = 4108) and protein coding mRNAs (n = 17060). Only lncRNA and mRNA with significant correlation (Bonferroni p-value < 0.05) and −0.4> Spearman’s rho > 0.4 in the TCGA (n = 1095) and SCAN-B (n = 3455) cohorts are used in the unsupervised clustering. In addition, we plot only lncRNAs and mRNAs with number of association higher than the mean value of association (Supplementary Fig. 4). Clusters are defined using cutree_rows = 3 and cutree_cols = 3. lncRNAs (x-axis) are annotated according to the differential expression analysis (Fig. 1). b, d Bar plot showing -log(FDR q.value) from a hypergeometric test (y-axis) of gene set enrichment analysis using Hallmark pathways of the MSigDB database. Input genes for GSEA are genes from mRNA-cluster A (n = 2890) (b), mRNA-cluster B (n = 1480) (c), and mRNA-cluster C (n = 667)(d). Boxplot of the coefficients from the generalized linear modeling of the expression of lncRNAs in the SCAN-B cohort using three variables into the same model, ESR1 mRNA (to reflect estrogen signaling (e)), fibroblast score (to infer fibroblast tumor content (f)) and lymphocyte score (to infer lymphocyte infiltration (g)). Each dot represents the coefficient for a variable and each lncRNA in cluster 1 (n = 610), cluster 2 (n = 199), and cluster 3 (n = 110). Kruskal-Wallis test p-values are shown. The line within each box represents the median. Upper and lower edges of each box represent 75th and 25th percentile, respectively. The whiskers represent the lowest datum still within [1.5 × (75th  −  25th percentile)] of the lower quartile, and the highest datum still within [1.5 × (75th  −  25th percentile)] of the upper quartile.
Fig. 3
Fig. 3. lncRNA expression in single cell RNA-seq data.
a UMAP of 94357 single cells from breast tumours colour-coded according to cell types. b, d Dot plot of lncRNAs (found in the scRNA-seq data set) with highest glm coefficient associated with the characteristics of each cluster, i.e ESR1 mRNA (Cluster 1), fibroblast score (Cluster 2), lymphocyte score (Cluster 3). Size of the dot represents the percentage of cells expressing the lncRNA, while the colour of the dot reflects the average expression in each of the UMAP-cell-type-cluster identified. Cluster 1 lncRNAs b, cluster 2 lncRNAs c, and cluster 3 lncRNAs d. eg Expression of one high ranking lncRNA from each lncRNA cluster plotted on the scRNA-seq UMAP. Cluster 1-lncRNA: GATA3-AS1 c, cluster 2-lncRNA: NR2F1-AS1 d, and cluster 3-lncRNA: LINC0861 e. Colour gradient (purple) represents Log normalized counts using scale.factor = 10000.
Fig. 4
Fig. 4. Functional annotation of lncRNA promoters.
a Schematic overview of the definition of lncRNA promoters not overlapping with a protein coding gene locus. bp: base pair; PC: protein-coding; TSS: transcription start site. b, c Average normalized counts for ATAC-seq peaks mapped to lncRNA promoters in estrogen receptor (ER) positive (+) (blue dots) (n = 58) and ER negative (−) (red dots) (n = 12) breast tumor samples from the TCGA-BRCA cohort. Wilcoxon test p-values are denoted. The line within each box represents the median. Upper and lower edges of each box represent 75th and 25th percentile, respectively. The whiskers represent the lowest datum still within [1.5 × (75th −  25th percentile)] of the lower quartile, and the highest datum still within [1.5 × (75th  −  25th percentile)] of the upper quartile. b Promoters of independent lncRNAs overexpressed in ER positive cases and c promoters of independent lncRNAs overexpressed in ER negative cases. d, e Enrichment of independent lncRNA promoters across ChromHMM genome segmentation from breast cancer cell lines. Enrichment is calculated as the ratio between the frequency of lncRNA promoters found within a specific segment type, over the frequency of all lncRNA promoters within the same segment type. The length of the bars (x-axis) shows the log transformed BH corrected p-value from the hypergeometric test. d Promoters of independent lncRNAs overexpressed in ER positive cases and e promoters of independent lncRNAs overexpressed in ER negative cases. Active Enhancer=EhAct, Active Promoter = PrAct, Repeat Zink Finger = RpZNF, Flanking Promoter region = PrFlk. f, g Swarm plots showing enrichment of TF binding sites (–(log10(p-value) using Fisher’s exact tests) on the y-axis for specific sets of promoters according to UniBind. TF names of the top 10 enriched TF binding sites data sets are annotated by colours. f Promoters of independent lncRNA overexpressed in ER positive cases and g promoters of independent lncRNAs overexpressed in ER negative cases.
Fig. 5
Fig. 5. Distal regulatory element in the LINC01488 locus.
a Enrichment of CpGs with DNA methylation significantly inversely correlated with lncRNA expression across ChromHMM genome segmentation from breast cancer cell lines. Enrichment is calculated by comparing the genomic location of the CpG inversely correlated to all the CpGs on the 450k Illumina array as background. Active Enhancer = EhAct, Ehnancer Genic = EhGen, Transcription flanking = TxFlk. Average normalized counts for ATAC-seq peaks mapped to CpG location for which DNA methylation is significantly inversely correlated with lncRNAs with higher expression in ER positive cases (b) and higher expression in ER negative cases (c). ATAC-seq data from ER + (blue dots) (n = 58) and ER- (red dots) (n = 12) breast tumor samples from the TCGA-BRCA cohort. Wilcoxon test p-values are denoted. The line within each box represents the median. Upper and lower edges of each box represent 75th and 25th percentile, respectively. The whiskers represent the lowest datum still within [1.5 × (75th  −  25th percentile)] of the lower quartile, and the highest datum still within [1.5 × (75th  −  25th percentile)] of the upper quartile. d Swarm plot showing enrichment of TF binding sites (–(log10(p-value) using Fisher’s exact tests) on the y-axis for CpGs with DNA methylation inversely correlated with lncRNA expression. Names of the top 10 enriched TF binding sites data sets are annotated by colours. e Graphical illustration of the LINC01488 locus annotated for different epigenomic tracks. CpGs measured by the 450 k Illumina array are shown together with the significant negative correlations between levels of DNA methylation and LINC01488 expression in the OSLO2 and TCGA cohorts (blue arcs, negative expression-methylation correlation). ChromHMM Enhancer regions (active and genic) in the Mcf7 cell line (green) with ChiA-PET polII loop connecting the TSS of LINC01488 to the CpG in the enhancer region (pink arcs). TF binding of ESR1 (dark blue), FOXA1 (blue), and GATA3 (light blue) from ChIP-seq experiments (ReMap). f, g Correlation plot of levels of LINC01488 expression (x-axis) and levels of DNA methylation of the CpG (y-axis) in long-range interaction in e. Rho and p-value from Spearman correlation is indicated. f OSLO2 (ER positive, n = 214, ER negative, n = 52), g TCGA (ER positive, n = 807, ER negative, n = 237. h Graphical illustration of the LINC01488 locus annotated with ChromHMM Enhancer regions (active and genic) in the Mcf7 cell line (green) and ChiA-PET polII loop connecting LINC01488 to CCND1 (pink arcs). i Correlation plot of log2(TPM + 1) LINC01488 expression (x-axis) and log2(TPM + 1) CCND1 expression (y-axis) in ER positive (n = 2409) and ER negative (n = 504) patients in the SCAN-B cohort. Rho and p-value from Spearman correlation are indicated.

References

    1. Sorlie T, et al. Gene expression patterns of breast carcinomas distinguish tumor subclasses with clinical implications. Proc. Natl Acad. Sci. 2001;98:10869–10874. doi: 10.1073/pnas.191367098. - DOI - PMC - PubMed
    1. Bertucci F, et al. How basal are triple-negative breast cancers? Int J. Cancer. 2008;123:236–240. doi: 10.1002/ijc.23518. - DOI - PubMed
    1. Zhu Q, Tekpli X, Troyanskaya OG, Kristensen VN. Subtype-specific transcriptional regulators in breast tumors subjected to genetic and epigenetic alterations. Bioinformatics. 2020;36:994–999. doi: 10.1093/bioinformatics/btz709. - DOI - PMC - PubMed
    1. Cabili MN, et al. Integrative annotation of human large intergenic noncoding RNAs reveals global properties and specific subclasses. Genes Dev. 2011;25:1915–1927. doi: 10.1101/gad.17446611. - DOI - PMC - PubMed
    1. Iyer MK, et al. The landscape of long noncoding RNAs in the human transcriptome. Nat. Genet. 2015;47:199–208. doi: 10.1038/ng.3192. - DOI - PMC - PubMed

Publication types

Substances