. 2022 Aug 18;5(1):832.
doi: 10.1038/s42003-022-03787-x.

Biophysical differences in IgG1 Fc-based therapeutics relate to their cellular handling, interaction with FcRn and plasma half-life

Affiliations

Biophysical differences in IgG1 Fc-based therapeutics relate to their cellular handling, interaction with FcRn and plasma half-life

Torleif Tollefsrud Gjølberg et al. Commun Biol. .

Abstract

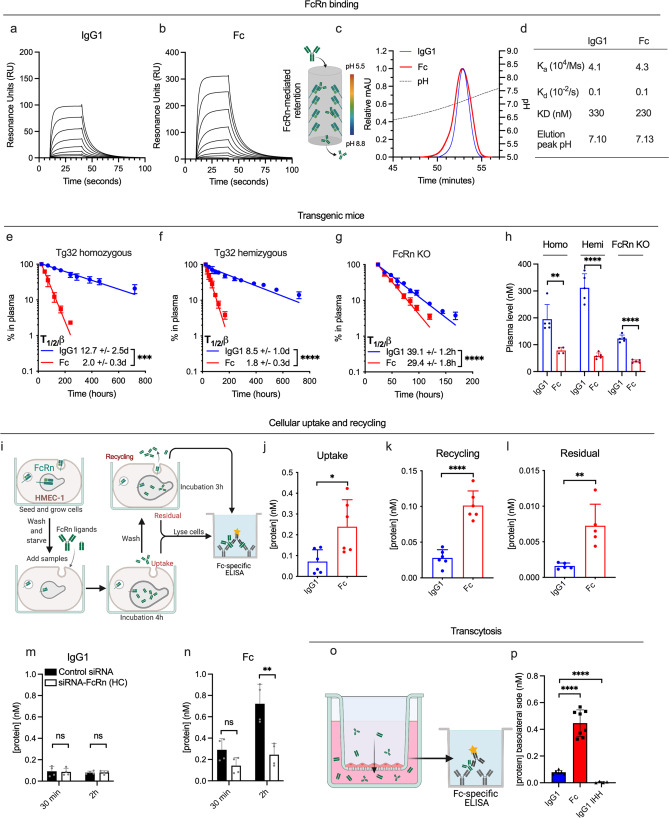
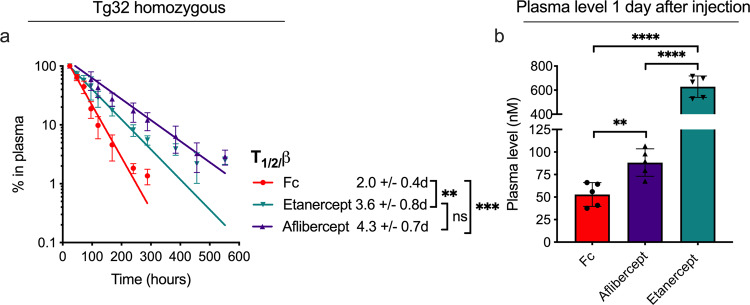
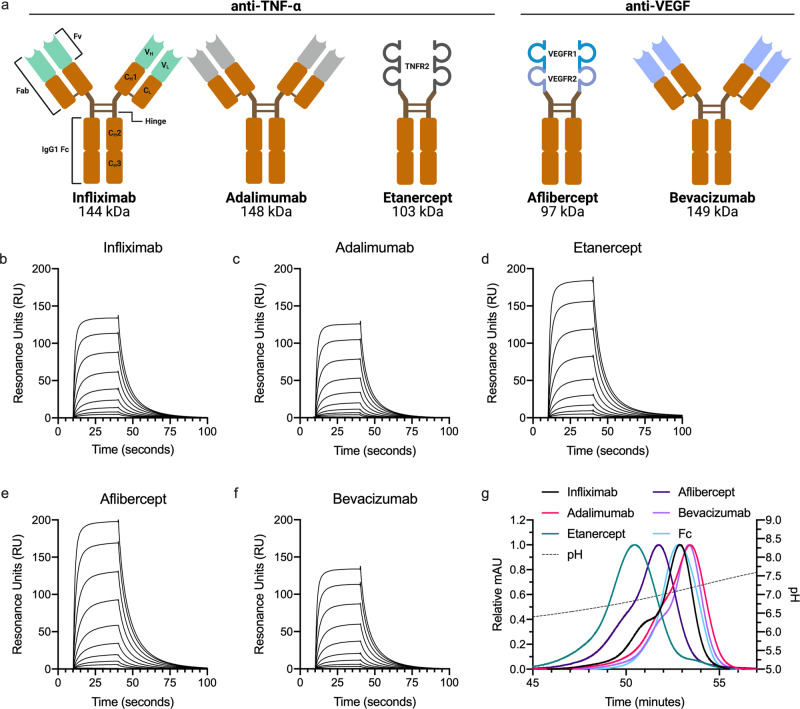
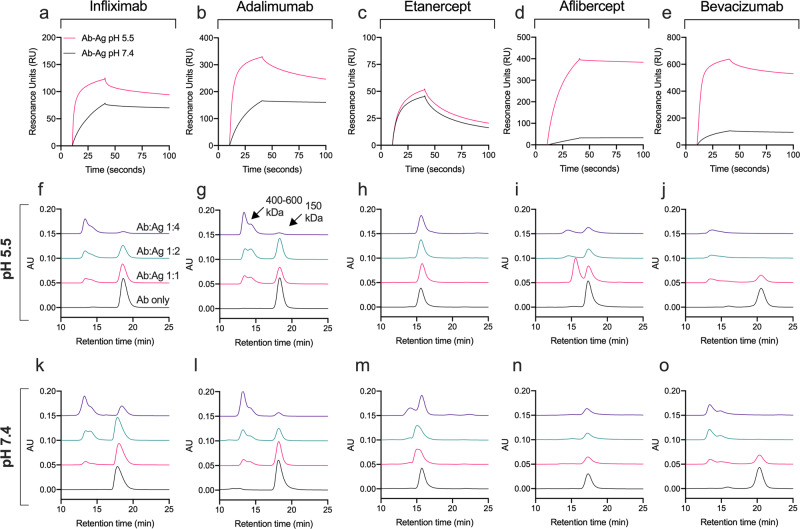
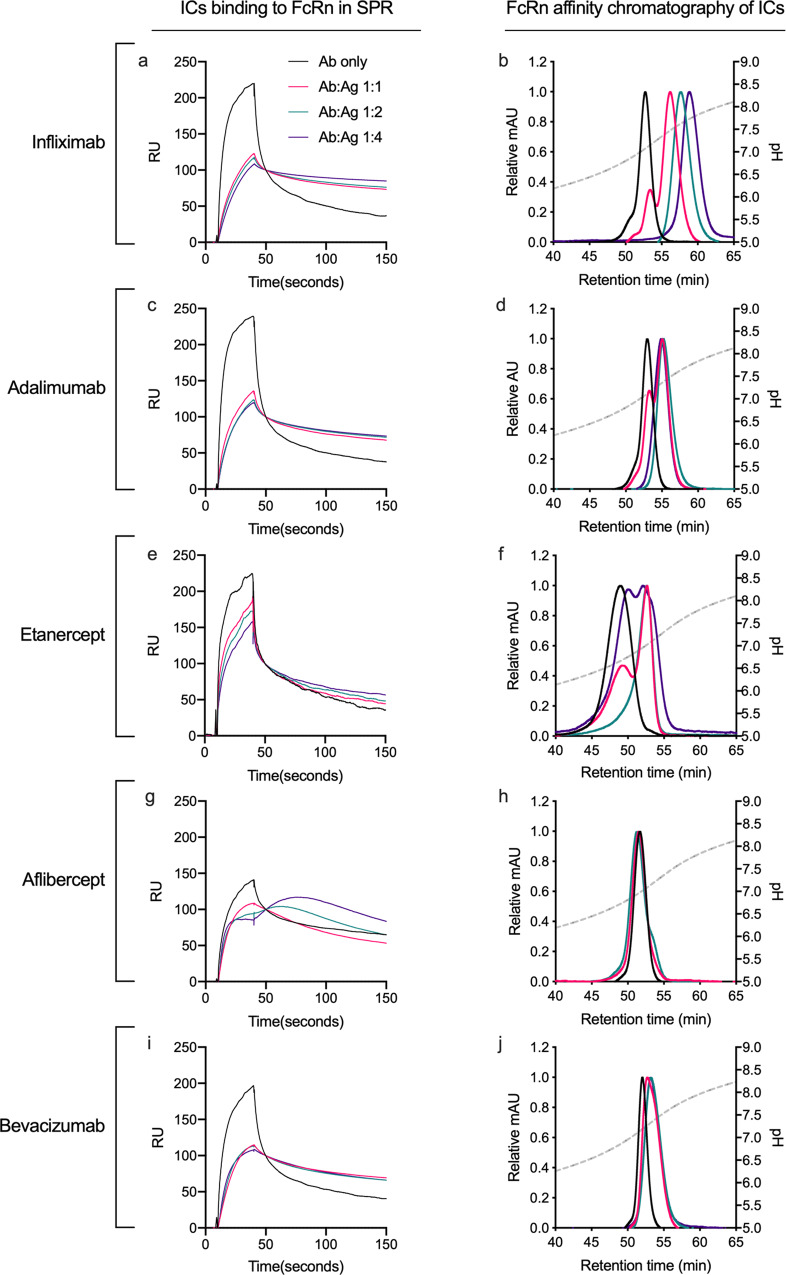
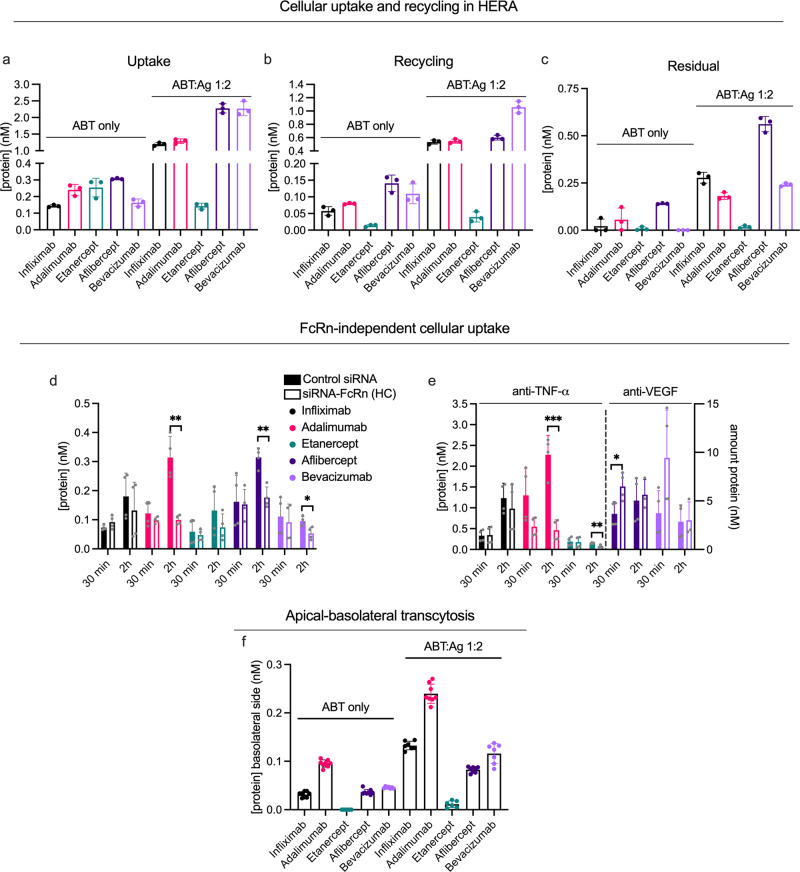
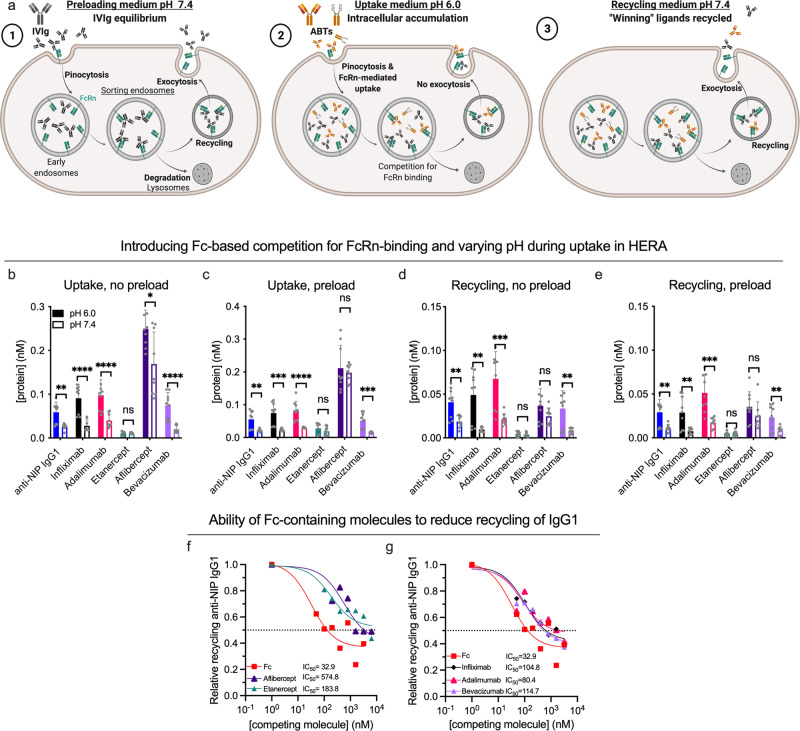
Antibody-based therapeutics (ABTs) are used to treat a range of diseases. Most ABTs are either full-length IgG1 antibodies or fusions between for instance antigen (Ag)-binding receptor domains and the IgG1 Fc fragment. Interestingly, their plasma half-life varies considerably, which may relate to how they engage the neonatal Fc receptor (FcRn). As such, there is a need for an in-depth understanding of how different features of ABTs affect FcRn-binding and transport behavior. Here, we report on how FcRn-engagement of the IgG1 Fc fragment compare to clinically relevant IgGs and receptor domain Fc fusions, binding to VEGF or TNF-α. The results reveal FcRn-dependent intracellular accumulation of the Fc, which is in line with shorter plasma half-life than that of full-length IgG1 in human FcRn-expressing mice. Receptor domain fusion to the Fc increases its half-life, but not to the extent of IgG1. This is mirrored by a reduced cellular recycling capacity of the Fc-fusions. In addition, binding of cognate Ag to ABTs show that complexes of similar size undergo cellular transport at different rates, which could be explained by the biophysical properties of each ABT. Thus, the study provides knowledge that should guide tailoring of ABTs regarding optimal cellular sorting and plasma half-life.


Conflict of interest statement

M.C.M. has been a member of advisory boards at Bayer, Novartis, Roche and Allergan and has received lecture fees from Bayer and Roche. Ø.K.J. has been member of Bayer, Allergan and Roche advisory boards and has received lecture fees from Bayer and Allergan. The remaining authors declare no competing interests.

Figures

Fig. 1
Fig. 1. FcRn-mediated transport properties differ between the IgG1 Fc and full-length IgG1.
a, b Representative SPR sensorgrams of titrated amounts of monomeric FcRn injected over anti-NIP IgG1 and the IgG1 Fc fragment (~300 RU). c FcRn affinity chromatography and resulting elution profiles of anti-NIP IgG1 (shown in blue) and the IgG1 Fc fragment (shown in red). d Table summarizing key parameters from FcRn interaction studies shown in ac. Elimination curves and estimated β-phase half-life of anti-NIP IgG1 and IgG1 Fc fragment in e homozygous Tg32 mice, f hemizygous Tg32 mice, and g mice lacking FcRn (FcRn KO). h Molar amounts in plasma at the start of the β-phase (1 day after IV injection) in the same mice and order as displayed in ac. n = 5 individual mice for all six groups. i Illustration of the HERA methodology. jl HERA parameters obtained for anti-NIP IgG1 and the IgG1 Fc fragment. Shown data represents two independent, representative experiments. HERA uptake following siRNA knockdown of FcRn and varying incubation time for the m anti-NIP IgG1 and n the IgG1 Fc fragment. Shown data represents two independent, representative experiments. o Illustration of transcytosis methodology used to obtain data on apical to basolateral FcRn-dependent transcytosis in MDCK cells stably overexpressing hFcRn shown in p. Shown data represent two independent experiments. IgG1 IHH denotes IgG1 with the amino acid substitutions I253A, H310A and H435A to abolish FcRn binding. *p < 0.05, **p < 0.005, ***p < 0.0005, ****p < 0.0001 (two-tailed, unpaired Student’s t test). Data in bar plots show mean values ± SD.
Fig. 2
Fig. 2. Circulatory properties of IgG1 Fc and Fc-fusions in hFcRn transgenic mice.
a Elimination curves and estimated β-phase half-life of the IgG1 Fc fragment (shown in red), aflibercept (shown in dark purple) and etanercept (shown in teal) in homozygous Tg32 mice. b Molar amounts at the start of the β-phase (1 day after IV injection). n = 5 individual mice per group. **p < 0.005, ***p < 0.0005, ****p < 0.0001 (two-tailed, unpaired Student’s t test). Data show mean values ± SD.
Fig. 3
Fig. 3. Fc-fused modalities affect FcRn-binding throughout the pH-gradient.
a Schematic illustration of structural elements in the ABT panel. All five ABTs contain an IgG1 Fc (orange, CH2 and CH3). ABMs (Fvs and receptor domains) are marked in light green, gray or shades of blue. Infliximab is a chimeric mouse-derived human IgG1 with a murine Fv (marked in light green) binding to TNF-a. Adalimumab is a fully human IgG1 binding to TNF-a (Fv gray). Etanercept consists of the extracellular domains of TNFR2 (gray) fused to the IgG1 Fc via a hinge region. Aflibercept consists of D2 of VEGFR1 (turquoise) linked to D3 of VEGFR2 (light blue) fused to an IgG1 Fc. Bevacizumab is a fully human IgG1 binding to active isotypes of VEGF (Fv light blue). MW of the total amino acid sequence of each ABT is indicated. bf Representative SPR sensorgrams of titrated amounts of monomeric FcRn injected over immobilized ABTs (~400 RU). g Elution profiles of ABTs from FcRn chromatography shown as relative fluorescence intensity throughout the pH gradient. The pH is plotted on the right Y-axis and indicated by a stapled line. Color labeling; infliximab (black), adalimumab (pink), etanercept (teal), aflibercept (dark purple), bevacizumab (light purple), Fc (light blue).
Fig. 4
Fig. 4. Ag-binding and immune complex formation are affected by pH and differ between IgG1s and Fc-fusions.
ae SPR sensorgrams showing ABTs (100 nM) injected over and binding to immobilized cognate Ags (~300 RU) at either pH 5.5 or 7.4. Analytical SEC of ABTs preincubated with increasing amounts of their cognate Ag at either (fj) pH 5.5 or (ko) 7.4 before injection. Color labeling ad; Ab-Ag injected at pH 5.5 (red) and at pH 7.4 (black). Color labeling fo; Ab only (black), Ab:Ag 1:1 (red), Ab:Ag 1:2 (teal), Ab:Ag 1:4 (dark purple).
Fig. 5
Fig. 5. Ag-binding alters the Fc-FcRn interaction.
a, c, e, g, i Sensorgrams showing injection of 15.62 nM ABTs preincubated with increasing amounts of cognate Ags at pH 5.5 and injected over immobilized (~100 RU) site-specifically biotinylated FcRn at pH 5.5. b, d, f, h, j Elution profiles from FcRn chromatography of ABTs preincubated with increasing amounts of cognate Ags at pH 5.5 shown as relative fluorescence intensity and as a function of pH (plotted on the right Y-axis, indicated by a stapled line) Color labeling; Ab only (black), Ab:Ag 1:1 (red), Ab:Ag 1:2 (teal), Ab:Ag 1:4 (dark purple).
Fig. 6
Fig. 6. FcRn-mediated cellular handling differs between ABTs with distinct Fc-fused modalities.
a, c, e HERA parameters from one representative experiment, assessing amounts of ABTs as monomers (ABT only) and preincubated with a two-fold molar excess of their cognate Ags at pH 7.4 (ABT:Ag 1:2) taken up (a), recycled by (b) and kept in (c) HMEC-1-FcRn cells (n = 3 per bar). Two representative experiments showing amount of ABTs, as both monomers (d) and after preincubation with two-fold molar excess of cognate Ags (e), taken up after incubation for 30 min or 2 h on HMEC-1-FcRn cells treated with control siRNA or siRNA against the HC of FcRn. In e, anti-TNF-α and anti-VEGF ABTs are plotted on the left and right y-axis, respectively, as indicated. Differences between ctrl and siRNA-FcRn-treated cells for each sample group are indicated (*p < 0.05, **p < 0.005, ***p < 0.0005, two-tailed, unpaired Student’s t test). n = 4 per bar. f Amount of monomeric and Ag-bound ABTs on the basolateral side of polarized MDCK-hFcRn cells following apical application and an incubation of 4 h. Values correspond to two independent experiments (n = 8 per bar). Color labeling; infliximab (black), adalimumab (pink), etanercept (teal), aflibercept (dark purple), bevacizumab (light purple). Data show mean values ± SD.
Fig. 7
Fig. 7. Varying pH and introducing competition for cellular recycling affect cellular handling of ABTs differently.
a Illustration of the HERA competition protocol. Initially, cells are preloaded for 1 h with 7.5 mg/ml IVIg at pH 7.4 (1). Next, the uptake phase is conducted at either pH 7.4 or pH 6.0 to force intracellular accumulation (2), followed by (3) adding of recycling medium (pH 7.4) and a 3-h incubation. bc Three experiments showing amount of ABTs detected in cells at the end of an uptake phase of either pH 6.0 (solid bars) or pH 7.4 (hollow bars) in either the absence (no preload, b) or presence (preload, c) of competition. n = 9 per bar, arising from three individual experiments. Differences between values measured after uptake at pH 6.0 and pH 7.4 are indicated (*p < 0.05, **p < 0.005, ***p < 0.0005, ****p < 0.0001, two-tailed, unpaired Student’s t test). de Recycled ABT amounts in either the absence (d) or presence (e) of competition, following uptake at either pH 6.0 or 7.4. f, g Amount of recycled anti-NIP IgG1 following simultaneous addition of titrated amounts of ABTs or the IgG1 Fc fragment and 400 nM anti-NIP IgG1 at pH 6.0 to preloaded cells. Values correspond to one representative experiment (n = 3 per data point). Color labeling; anti-NIP IgG1 (blue), infliximab (black), adalimumab (pink), etanercept (teal), aflibercept (dark purple), bevacizumab (light purple), Fc (red). Data in bar plots show mean values ± SD.

References

    1. Lu R-M, et al. Development of therapeutic antibodies for the treatment of diseases. J. Biomed. Sci. 2020;27:1. doi: 10.1186/s12929-019-0592-z. - DOI - PMC - PubMed
    1. Carter PJ, Lazar GA. Next generation antibody drugs: pursuit of the “high-hanging fruit.”. Nat. Rev. Drug Discov. 2017;17:197. doi: 10.1038/nrd.2017.227. - DOI - PubMed
    1. Duivelshof BL, et al. Therapeutic Fc‐fusion proteins: current analytical strategies. J. Sep. Sci. 2021;44:35–62. doi: 10.1002/jssc.202000765. - DOI - PubMed
    1. Rath T, et al. Fc-fusion proteins and FcRn: structural insights for longer-lasting and more effective therapeutics. Crit. Rev. Biotechnol. 2013;0:1–20. - PMC - PubMed
    1. Lagassé HAD, Hengel H, Golding B, Sauna ZE. Fc-fusion drugs have FcγR/C1q binding and signaling properties that may affect their immunogenicity. AAPS J. 2019;21:62. doi: 10.1208/s12248-019-0336-8. - DOI - PubMed

Publication types