. 2022 Sep;54(9):1305-1319.
doi: 10.1038/s41588-022-01148-2. Epub 2022 Aug 18.

Integrating de novo and inherited variants in 42,607 autism cases identifies mutations in new moderate-risk genes

Collaborators, Affiliations

Integrating de novo and inherited variants in 42,607 autism cases identifies mutations in new moderate-risk genes

Xueya Zhou et al. Nat Genet. 2022 Sep.

Abstract

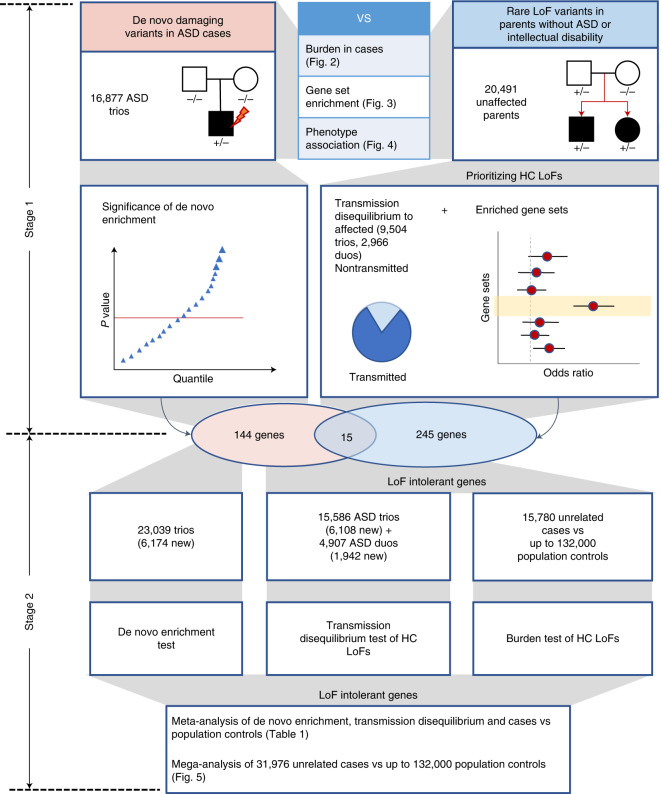
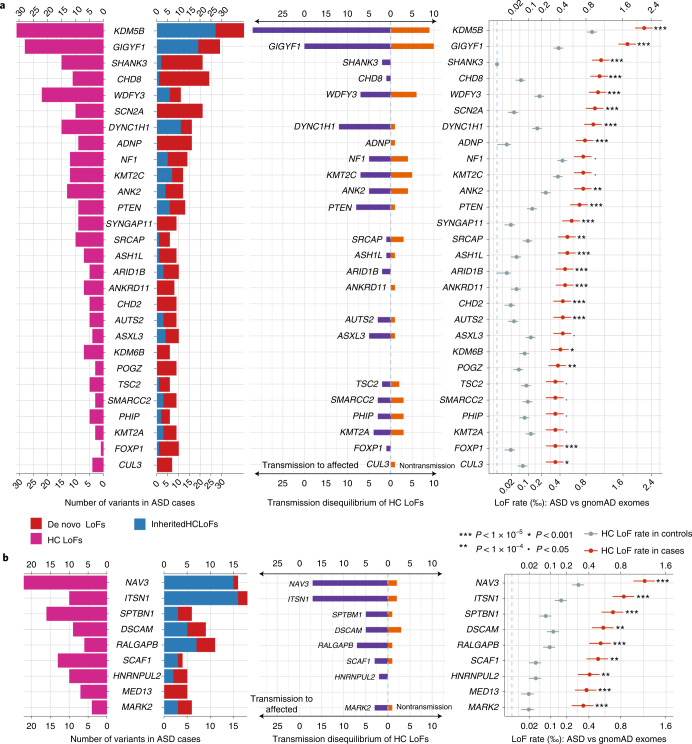
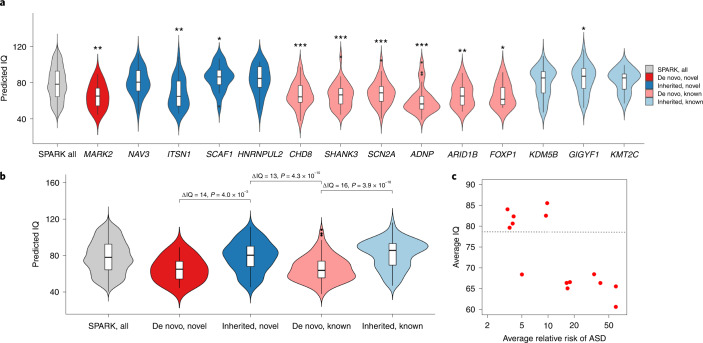
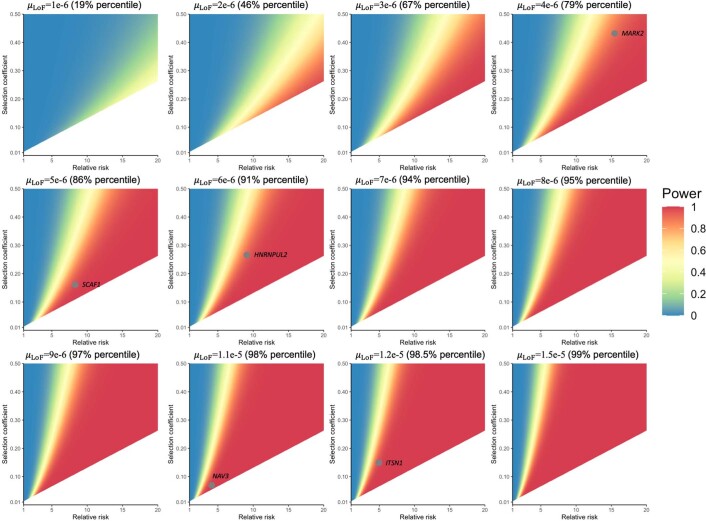
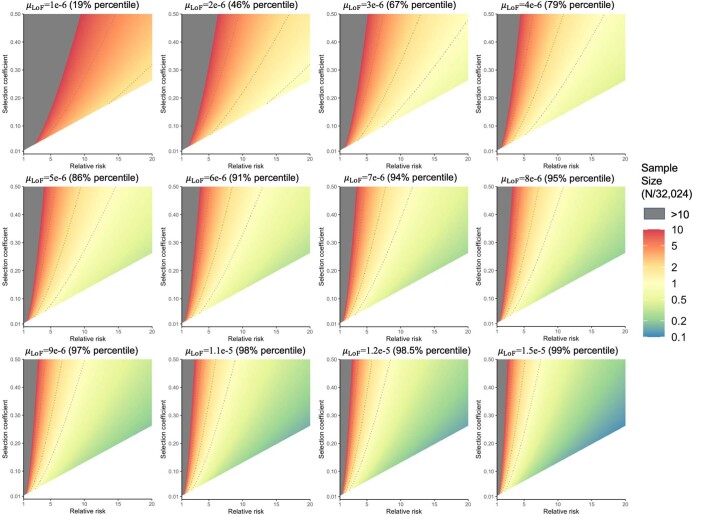
To capture the full spectrum of genetic risk for autism, we performed a two-stage analysis of rare de novo and inherited coding variants in 42,607 autism cases, including 35,130 new cases recruited online by SPARK. We identified 60 genes with exome-wide significance (P < 2.5 × 10⁻⁶), including five new risk genes (NAV3, ITSN1, MARK2, SCAF1 and HNRNPUL2). The association of NAV3 with autism risk is primarily driven by rare inherited loss-of-function (LoF) variants, with an estimated relative risk of 4, consistent with moderate effect. Autistic individuals with LoF variants in the four moderate-risk genes (NAV3, ITSN1, SCAF1 and HNRNPUL2; n = 95) have less cognitive impairment than 129 autistic individuals with LoF variants in highly penetrant genes (CHD8, SCN2A, ADNP, FOXP1 and SHANK3) (59% vs 88%, P = 1.9 × 10⁻⁶). Power calculations suggest that much larger numbers of autism cases are needed to identify additional moderate-risk genes.


Conflict of interest statement

D.H.G. has received consulting fees or equity participation for scientific advisory board work from Ovid Therapeutics, Axial Biotherapeutics, Acurastem, and Falcon Computing. E.E.E. serves on the Scientific Advisory Board of Variant Bio. W.K.C. serves on Scientific Advisory Board of the Regeneron Genetics Center and is the Director of Clinical Research for SFARI. All other authors declare no competing interests.

Figures

Fig. 1
Fig. 1. Analysis workflow.
In the discovery stage, we identified DNVs in 16,877 ASD trios and rare LoF variants in 20,491 parents without ASD diagnoses and intellectual disability. We compared properties of de novo and rare variants to identify rare LoFs that contribute to genetic risk in individuals with ASD. We also evaluated their associations with cognitive impairment and enriched gene sets. We performed an initial exome-wide scan of genes enriched by DNVs or showing transmission disequilibrium of rare LoFs to affected offspring and selected a total of 404 genes for further replication, including 159 de novo enriched genes and 260 prioritized transmission disequilibrium genes from enriched gene sets (15 genes were in both). In the meta-analysis stage, we first evaluated evidence from de novo enrichment and transmission disequilibrium of rare inherited LoFs in an expanded set of family-based samples including over 6,000 additional ASD trios and around 2,000 additional duos. The DNVs in ASD were combined with those from an additional 31,565 NDD trios to refine the filters of high-confidence LoF variants in de novo LoF enriched genes. We also constructed an independent dataset of LoF variants of unknown inheritance from 15,780 cases that were not used in de novo or transmission analysis. We compared LoF rates in cases with two population-based sets of controls (n = ~104,000 and ~132,000, respectively). For 367 LoF-intolerant genes on autosomes, the final gene-level evidence was obtained by meta-analyzing P values of de novo enrichment, transmission disequilibrium of high-confidence rare inherited LoFs, and comparison of high-confidence LoFs from cases and controls not used in the de novo or transmission analysis. We also performed a mega-analysis that analyzed high-confidence LoFs identified in all 31,976 unrelated ASD cases and compared their rates with population-based controls. HC, high-confidence.
Fig. 2
Fig. 2. Comparison of burden between de novo damaging variants and rare inherited LoFs in ASD.
a, The burden of DNVs was evaluated by the rate ratio and rate difference between 16,877 ASD and 5,764 unaffected trios. The exome-wide burden of de novo LoF and D-mis (REVEL ≥ 0.5) variants are concentrated in constrained genes (ExAC pLI ≥ 0.5) and in genes with the highest levels of LoF intolerance in the population (defined by the top two deciles of gnomAD LOEUF scores). Burden analysis was repeated after removing known ASD or NDD genes. The number of genes before and after removing known genes in each constraint bin is shown below the axis label. Data are presented as mean values and 95% confidence intervals. Among constrained genes (ExAC pLI ≥ 0.5 or the top 20% of gnomAD LOEUF scores), close to two-thirds of case-control rate differences of de novo LoF and D-mis variants can be explained by known genes. Exact P values by Poisson test are listed in Supplementary Table 19. b, The burden of inherited LoFs was evaluated by looking at the proportion of rare LoFs in 20,491 parents without ASD diagnoses or intellectual disability that are transmitted to affected offspring in 9,504 trios and 2,966 duos and show evidence of overtransmission of LoFs per ASD trio. As a comparison, we also show the transmission disequilibrium pattern to unaffected offspring in 5,110 trios and 129 duos. Data are presented as mean values ± standard errors as error bars. Two-sided binomial test was used to compute the P values for overtransmission or undertransmission. Using ultra-rare LoFs with pExt ≥ 0.1, exome-wide signals of transmission disequilibrium of rare inherited LoF variants also concentrate in constrained genes (ExAC pLI ≥ 0.5) and in genes within the top two deciles of gnomAD LOEUF scores. Analysis was restricted to autosomal genes and repeated after removing known ASD or NDD genes (number of genes in each constrained bin before and after removing known genes is shown below the axis label). Among all constrained genes, only one-fifth of overtransmission of LoFs to ASD trios can be explained by known ASD or NDD genes. Exact P values by binominal test are listed in Supplementary Table 19.
Fig. 3
Fig. 3. Enrichment of rare LoF variants in ASD cases across gene sets.
Gene sets were defined and grouped by transcriptome proteome, neuronal regulome, ASD gene prediction scores, genetic evidence from neuropsychiatric diseases, and gene-level constraint. Analyses were repeated after removing known ASD or NDD genes. (Number of genes in each set before and after removing known genes are shown in parentheses below gene set.) Dots represent fold enrichment of DNVs or odds ratios for overtransmission of LoF variants in each set. Horizontal bars are presented as mean values with 95% confidence interval as error bars. For each gene set, we show the percentage of overtransmission of rare LoFs to cases. Enrichment of rare inherited LoFs was evaluated by the share of overtransmission events (the transmission and nontransmission of ultra-rare LoFs with pExt ≥ 0.1) in the selected gene set vs those in all other constrained genes using a two-by-two table. P values were determined using the χ2 test. Exact P values are listed in Supplementary Table 19.
Fig. 4
Fig. 4. Association of rare inherited LoFs with cognitive impairment in ASD cases.
Ultra-rare inherited LoFs with pExt ≥ 0.1 in genes with the top 10% of gnomAD LOEUF scores also show a higher proportion of transmission and a higher overtransmission rate to ASD offspring with cognitive impairment (CogImp) than those without (NoCogImp). Rare LoFs in other constrained genes are not significantly associated with phenotypic severity. The increased burden of inherited LoFs in cases with cognitive impairment remains significant after removing known ASD or NDD genes. Data are presented as mean values ± standard errors as error bars. Poisson test was used to compute the P values to assess the fold enrichment, and binominal test was used for overtransmission. Exact P values are listed in Supplementary Table 19.
Fig. 5
Fig. 5. Distribution of de novo and inherited LoF variants in known and novel ASD genes in cases and population controls.
From left to right: pyramid plots summarizing the number of de novo LoFs in 15,857 ASD trios, inherited high-confidence LoFs in 18,720 unrelated offspring included in transmission analysis, and high-confidence LoFs in 15,780 unrelated cases; bar plot of transmission vs nontransmission for rare high-confidence LoFs identified in parents without ASD diagnoses or intellectual disability; three plots comparing the high-confidence LoF rate in 31,976 unrelated ASD cases with gnomAD exomes (non-neuro subset, 104,068 individuals). Horizontal bars are presented as mean values ± standard errors as error bars. a, Twenty-eight known ASD or NDD genes that have LOEUF scores in the top 30% of gnomAD, have a P value for enrichment among all DNVs (P < 9 × 10−6) in 23,039 ASD trios, and have more than 10 LoFs. b, Nine additional ASD risk genes that achieved a P value of <9 × 10−6 in stage 2 of this analysis. The majority of genes in b harbor more inherited LoFs than DNVs. All five novel genes (Table 1) are shown in b. Note that the x axes of LoF rates are in the squared root scale. Poisson test was used to compute the P values. Exact P values are listed in Supplementary Table 6.
Fig. 6
Fig. 6. Predicted full-scale IQ in individuals with pathogenic variants in inherited or de novo genes in SPARK.
We examined the distribution of predicted IQ using a machine learning method for 95 individuals with ASD with an LoF mutation in one of the five novel exome-wide-significant genes (MARK2, NAV3, ITSN1, SCAF1 and HNRNPUL2) and nine known ASD genes (CHD8, SHANK3, SCN2A, ADNP, ARID1B, FOXP1, KDM5B, GIGYF1 and KMT2C), compared with 2,545 SPARK participants with ASD and known IQ scores. The nine known ASD genes include six genes (pink and labeled ‘de novo, known’) that are well-established de novo ASD risk genes that exceed exome-wide significance and were most frequently identified in SPARK, which maximizes the number of samples available for genotype–phenotype analyses. We also included three genes (light blue and labeled ‘inherited, known’) that have some previous evidence for inherited ASD risk (GIGYF1, KDM5B and KMT2C) and were also frequently identified in SPARK. We denote the genes contributing to ASD primarily through de novo LoF variants in our analysis as ‘de novo’ (red), and the genes primarily through inherited LoF variants as ‘inherited’ (blue). a, Distribution of predicted IQ between individuals with ASD with LoF mutations in the five novel genes, nine known genes and all participants with ASD and known IQ scores in SPARK (n = 2,545). We compared the mean predicted IQ between participants with LoF mutations in ASD genes and all participants by two-sample t-test. *, 0.01 ≤ P < 0.05; **, 0.001 ≤ P < 0.01; ***, P < 0.001. Exact P values are listed in Supplementary Table 19. The box plots represent median as center, and interquartile range (IQR) as bounds of the box; the upper whisker extends from the upper bound of the box to 1.5 × IQR, and the lower whisker extends from the lower bound of the box to 1.5 × IQR. Two-sided t-test was used to compute the P values for comparing mean predicted IQ between ASD individuals with LoF mutation in specific gene and all ASD participants. Individuals with pathogenic variants in de novo risk genes have significantly lower predicted IQ than overall SPARK participants with ASD and known IQ scores, whereas individuals with LoF variants in moderate-risk, inherited genes show similar predicted IQ as the overall SPARK participants, with the exception of ITSN1. b, Distribution of predicted IQ between individuals with ASD gene grouped by both inheritance status (‘de novo’ or ‘inherited’) and whether the ASD genes are novel (‘novel’ or ‘known’). We compared the mean predicted IQ between individuals with pathogenic variants in de novo genes and inherited genes among our five novel genes and nine known genes. Overall, people with LoF mutations in de novo genes have an average of 13–16 points lower predicted IQ than individuals with LoF mutations in inherited genes, regardless of whether the ASD genes are novel or known. The box plots represent median as center, and IQR as the bounds of the box; the upper whisker extends from the upper bound of the box to 1.5 × IQR, and the lower whisker extends from the lower bound of the box to 1.5 × IQR. c, Average relative risk of ASD and average predicted IQ among different groups. Each dot shows the average of individuals with rare LoFs of a gene selected in a. The relative risk is estimated from mega-analysis and capped at 60. Pearson correlation between average IQ and log relative risk is −0.78 (P = 0.001). The horizontal line represents the average IQ (IQ = 79) of all SPARK individuals with predicted IQs. ITSN1 is an outlier at the bottom left corner.
Fig. 7
Fig. 7. Functional or phenotypic embedding of ASD risk genes.
a, Using a combination of archetypal analysis and canonical correlation analysis, putative autism risk genes were organized into k= 6 archetypes that represent distinct mechanistic (STRING) and phenotypic (HPO) categorizations (neurotransmission, chromatin modification, RNA processing, vesicle-mediated transport, MAPK signaling and migration, and cytoskeleton and mitosis). Genes implicated by our meta-analysis are indicated by their label, with novel genes in red. b, For each of the five novel genes, we identified the five nearest neighbors in the embedding space among the 62 meta-analysis genes. SCAF1, MARK2 and HNRNPUL2 were identified as ‘mixed’ rather than ‘archetypal’ in their probable risk mechanisms. c, To gain further insight into possible risk mechanisms, we calculated the embedding distance to the centroid of these three genes, which was then used as an index variable to perform gene set enrichment analysis. d, A STRING cluster (CL:6549) containing genes related to cell–cell junctions and the gap junction was identified as being highly localized in this region of the embedding space (P = 4.12 × 1014 by the Kolmogorov–Smirnov test). This may suggest that these genes confer autism risk through dysregulation of processes related to cell adhesion and migration.
Extended Data Fig. 1
Extended Data Fig. 1. Overall burden of de novo variants in four ASD cohorts included in the discovery sample.
(A) Observed rates of de novo LoF, Dmis (REVEL > = 0.5) and silent variants (B) are compared with expected rates. We used a 7mer sequence context dependent mutation rate model to calculate expected rates for different classes of de novo variants after adjusting sequencing coverage, and found a close match with observed de novo rates in control trios. The rates of de novo LoF and Dmis variants in ASD cases are significantly higher than baseline expectation and are reduced in cases with known family history. Data are presented as mean values and 95% confidence interval as error bars.
Extended Data Fig. 2
Extended Data Fig. 2. Enrichment of de novo damaging and rare, inherited LoF variants in ASD cases across gene sets.
Gene sets were defined and grouped by transcriptome proteome, neuronal regulome, ASD gene prediction scores, genetic evidence from neuropsychiatric diseases, and gene level constraint. Analyses were repeated after removing known ASD/NDD genes. Number of genes in each set before and after removing known genes are shown in bracket below gene set. Dots represent fold enrichment of DNVs or odds ratio for over-transmission of LoFs in each set. Horizontal bars indicate 95% confidence interval. For each gene set, also shown are the percentage of excessive DNVs in cases and percentage of over-transmission of rare, inherited LoFs to cases. (A) De novo enrichment analysis was performed by dnEnrich that conditional on the overall increase in burden of de novo damaging variants in cases compared with controls (Methods). P-values were derived from 100,000 random permutations of de novo damaging variants among all 5,754 constrained genes and accounts for the tri-nucleotide sequence context and gene length. (B) Enrichment of rare, inherited LoFs was evaluated by comparing the transmission and non-transmission of ultra-rare LoFs with pExt > =0.1 in the gene set versus those in all other constrained genes using a 2-by-2 table. P-values were given by chi-squared test.
Extended Data Fig. 3
Extended Data Fig. 3. QQ plot showing the ultra-rare synonymous burden test among 404 selected genes between SPARK cases and gnomAD controls for allele frequency<1e-5.
HMCN2 is excluded (not shown) since it has poor coverage in gnomAD. Panel A shows the cross-ancestry case-control ultra-rare synonymous burden comparison, while Panel B shows the European-only case-control ultra-rare synonymous burden comparison. The observed P values for each gene are sorted from largest to smallest and plotted against expected values from a theoretical chi-square distribution.
Extended Data Fig. 4
Extended Data Fig. 4. Transmission disequilibrium of exonic or single gene deletions of ITSN1 (A) and NAV3 (B).
The read depth signal plots show normalized read depth (NDP) of exome targets used in CNV calling by CLAMMS for ITSN1 (A) and NAV3 (B) in Family 1–8. NDPs of −0.5, 0 and 0.5 correspond to copy number (CN) of 1 (deletion), 2 (normal diploid) and 3 (duplication). NDPs of exon targets within deleted regions are colored red. Dark and gray areas correspond to 1 and 2 estimated standard deviations of NDP for each exon target. CN deletions were initially discovered from all unaffected parents, then subsequently genotyped on Family 1–8. Signal plots of Family 1–8 are shown with parents appear in the top and offspring in the bottom. The deletion regions and affected exons of genes are shown below each plot.
Extended Data Fig. 5
Extended Data Fig. 5. Cumulative distribution of haploid mutation rates (per generation) of LoF and D-mis (REVEL > = 0.5) variants of all protein coding genes on autosomes.
Panel A shows the distribution of all autosomal genes vs. known ASD/NDD genes. Panel B shows all autosomal genes vs. prioritized genes. Baseline mutation rates were calculated using 7mer sequence context dependent mutation rates. Known ASD/NDD genes tend to have higher mutation rates than average genes.
Extended Data Fig. 6
Extended Data Fig. 6. Power of case-control association by rare LoFs variants (‘mega-analysis’) with sample size equal to current study.
The mega-analysis of current study compares the rate of LoF variants in 32,024 unrelated ASD cases with population controls with sample sizes about 76,000~132,000. For power calculation, we assumed that population controls are infinite so that cumulative allele frequency are known and presumed to be at equilibrium under selection-mutation balance for constrained genes (f = μLoF/s). Experiment-wide error rate was set at 9e-6 (0.05 divided by the number of autosomal genes at gnomAD LOEUF 30%). Power is calculated as a function of relative risk for ASD (RR) and selection coefficient (s) across different haploid LoF mutation rates (μLoF) using an analytic approximation by Zuk et al.. We only considered selection coefficient between 0.01 and 0.5 and relative risk to ASD between 1 and 20, because genes with huge effect sizes and larger selection coefficients are expected to be identified from the enrichment of de novo variants. The triangular region where s < 0.013RR are left blank because the parameters in this region are not compatible with the current estimates of prevalence of ASD (1/54) and sex-averaged reduction of reproductive fitness (0.71). Five new ASD genes identified in this study are placed onto the heatmap closest to its LoF mutation rate. Their positions within heatmaps are taken from point estimates of using gnomAD exomes (non-neuro subset) as population controls.
Extended Data Fig. 7
Extended Data Fig. 7. Sample sizes required for achieving 90% of power.
Using the same assumptions and experiment-wide error rate as power calculation, we calculated required sample size for 90% of power. Sample size is shown as a factor relative to the current sample size (32,024) and as a function of relative risk to ASD and selection coefficient across with different LoF mutation rates. Contours 1, 2 and 5 times of current size are shown as dashed lines. Regions of parameter space that require over 10 times current sample sizes are shown in gray.

References

    1. Lord C, et al. Autism spectrum disorder. Nat. Rev. Dis. Primers. 2020;6:5. doi: 10.1038/s41572-019-0138-4. - DOI - PMC - PubMed
    1. Iossifov I, et al. The contribution of de novo coding mutations to autism spectrum disorder. Nature. 2014;515:216–221. doi: 10.1038/nature13908. - DOI - PMC - PubMed
    1. De Rubeis S, et al. Synaptic, transcriptional and chromatin genes disrupted in autism. Nature. 2014;515:209–215. doi: 10.1038/nature13772. - DOI - PMC - PubMed
    1. O’Roak BJ, et al. Recurrent de novo mutations implicate novel genes underlying simplex autism risk. Nat. Commun. 2014;5:5595. doi: 10.1038/ncomms6595. - DOI - PMC - PubMed
    1. Yuen RKC, et al. Whole-genome sequencing of quartet families with autism spectrum disorder. Nat. Med. 2015;21:185–191. doi: 10.1038/nm.3792. - DOI - PubMed

Publication types

Substances