. 2022 Sep;54(9):1355-1363.
doi: 10.1038/s41588-022-01154-4. Epub 2022 Aug 18.

Genetic control of RNA splicing and its distinct role in complex trait variation

Affiliations

Genetic control of RNA splicing and its distinct role in complex trait variation

Ting Qi et al. Nat Genet. 2022 Sep.

Abstract

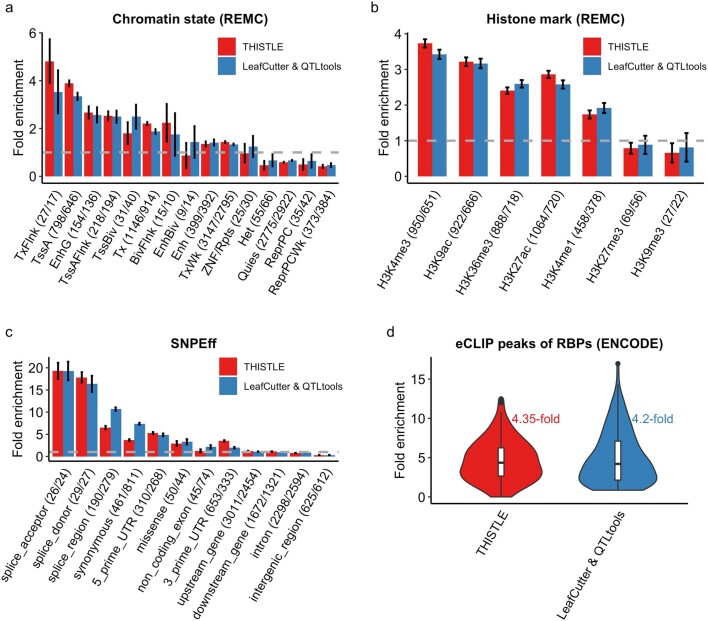
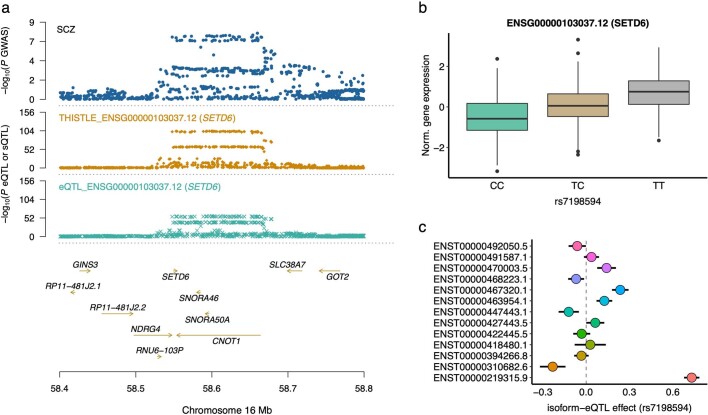
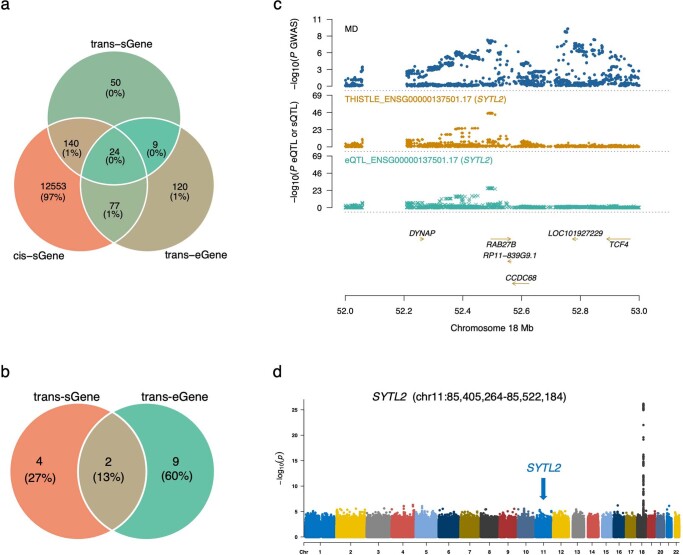
Most genetic variants identified from genome-wide association studies (GWAS) in humans are noncoding, indicating their role in gene regulation. Previous studies have shown considerable links of GWAS signals to expression quantitative trait loci (eQTLs) but the links to other genetic regulatory mechanisms, such as splicing QTLs (sQTLs), are underexplored. Here, we introduce an sQTL mapping method, testing for heterogeneity between isoform-eQTL effects (THISTLE), with improved power over competing methods. Applying THISTLE together with a complementary sQTL mapping strategy to brain transcriptomic (n = 2,865) and genotype data, we identified 12,794 genes with cis-sQTLs at P < 5 × 10⁻⁸, approximately 61% of which were distinct from eQTLs. Integrating the sQTL data into GWAS for 12 brain-related complex traits (including diseases), we identified 244 genes associated with the traits through cis-sQTLs, approximately 61% of which could not be discovered using the corresponding eQTL data. Our study demonstrates the distinct role of most sQTLs in the genetic regulation of transcription and complex trait variation.


Conflict of interest statement

The authors declare no competing interests.

Figures

Fig. 1
Fig. 1. Schematics of the THISTLE sQTL analysis.
In this toy example, a genetic variant with two alleles, G and A, is associated with a splicing event (for example, exon skipping) in a gene with two transcript isoforms, T1 and T2. a,b, Schematics of the THISTLE sQTL analysis in the absence of an eQTL effect. In this scenario, individuals with the G allele show higher mean abundance of T1 than T2 and individuals with the A allele show higher mean abundance of T2 than T1 (a), meaning that the genetic variant is associated with the difference in abundance between isoforms. In other words, there is a difference in the isoform-eQTL effect between T1 and T2 (b). However, there is no difference in overall gene expression between individuals with different alleles, meaning that this genetic variant is not an eQTL. c,d, Schematics of the THISTLE sQTL analysis in the presence of an eQTL effect. In this scenario, individuals with the G allele show similar abundance between T1 and T2 and individuals with the A allele show lower abundance of T1 than T2 (c). The isoform-eQTL effect for T1 is different from that for T2 albeit in the same direction (d). In this case, there is a difference in overall gene expression between alleles G and A, meaning that this genetic variant is also an eQTL.
Fig. 2
Fig. 2. Relationship between sQTLs and eQTLs.
a, Overlap between sGenes and eGenes. b, COLOC PP3 and PP4 values between the cis-sQTL and cis-eQTL signals and LD r2 between the lead cis-sQTL and cis-eQTL SNPs for the 9,389 overlapping genes. The line inside each box indicates the median value, the notches indicate the 95% confidence interval (CI), the central box indicates the interquartile range (IQR) and the whiskers indicate data up to 1.5 times the IQR. c, The number of sGenes (or eGenes) discovered as a function of sample size. d, The number of sQTLs (or eQTLs) discovered as a function of sample size. e, The overlap between sGenes and eGenes (or between sQTLs and eQTLs) as a function of sample size, where sQTL–eQTL overlap is defined as the proportion of sGenes for which the lead sQTL SNP is a significant eQTL SNP for the same gene. Source data
Fig. 3
Fig. 3. Enrichment of the lead cis-sQTL or cis-eQTL SNPs in functional annotation categories.
ad, The annotation categories were defined by the chromatin state annotation data from REMC (a), predicted variant functions by SnpEff (b), histone marks from REMC (c) and eCLIP peaks of 113 RBP binding sites from ENCODE (d). ac, The fold enrichment was computed by dividing the percentage of lead cis-sQTL (or cis-eQTL) SNPs in a category by the mean percentage observed in 1,000 sets of control SNPs sampled repeatedly at random (Methods). Each column represents an estimate of fold enrichment with an error bar indicating the 95% CI of the estimate. The gray dashed line represents no enrichment. The numbers in parentheses are the number of sQTL/eQTL SNPs in each functional category. d, The text in color represents the median across 113 RBP binding sites. e, Distance of the lead cis-sQTL (or cis-eQTL) SNP to the TSS of the gene. The texts in color represent the median across 12,794 sGenes and 16,704 eGenes, respectively; Pdiff was computed from a two-sided t-test for a mean difference between the two groups. d,e, The violin plots show the distributions of fold enrichment estimates of sQTL and eQTL SNPs across the 113 RBP biding sites (d) or distances to the TSS across 12,794 sGenes and 16,704 eGenes (e), respectively. The line inside each box indicates the median value, the notches indicate the 95% CI, the central box indicates the IQR, the whiskers indicate data up to 1.5 times the IQR and the outliers are shown as separate dots. Source data
Fig. 4
Fig. 4. Enrichment of the lead cis-sQTL or cis-eQTL SNPs for heritability of the 12 brain-related traits.
a, Prhg2 is a ratio of heritability attributable to the SNPs in query to the overall SNP-based heritability (hxQTL2/hSNP2). b, Heritability enrichment is defined as a ratio of the proportion of heritability explained by the SNPs in query to the mean proportion observed in 1,000 sets of control SNPs sampled repeatedly at random (Methods). a,b, The blue dashed line represents the median value across traits; each column represents a point estimate with an error bar indicating the 95% CI of the estimate. c, The stratified LD score regression parameter τ was used to assess the contribution of the lead cis-sQTL SNPs to heritability when fitted jointly with the lead cis-eQTL SNPs. d, Proportion of heritability mediated by the cis-sQTL (or cis-eQTL) SNPs (hmed2/hSNP2), estimated by the mediated expression score regression. Only the sQTLs discovered by LeafCutter and QTLtools were included in the mediated expression score regression analysis. c,d, The violin plots show the distributions of the estimates of τ and hmed2/hSNP2, respectively, across the 12 traits. The line inside each box indicates the median value, the notches indicate the 95% CI, the central box indicates the IQR, the whiskers indicate data up to 1.5 times the IQR and the outliers are shown as separate dots. e, Overlap between the trait-associated sGenes and eGenes identified by SMR and COLOC PP4. Source data
Fig. 5
Fig. 5. Association of DGKZ with SCZ through alternative splicing rather than overall mRNA abundance.
a, GWAS, sQTL and eQTL P values. The top track shows −log10(P) of SNPs from the SCZ GWAS. The second, third and fourth tracks show −log10(P) from the LeafCutter and QTLtools sQTL (intron 11:46391100:46392863:clu_288873_), THISTLE sQTL and eQTL analyses, respectively, for DGKZ. The THISTLE sQTL P values were computed using a one-sided sum of chi-squared test and the eQTL and LeafCutter and QTLtools sQTL P values were computed using a one-sided chi-squared test. b, Isoform-eQTL effects for DGKZ in the whole dataset (n = 2,865), with ENST00000318201.12 and ENST00000534125.5 at the 2 extremes with opposite isoform-eQTL effects. Each dot represents an estimate of the isoform-eQTL effect with an error bar indicating the 95% CI of the estimate. c,d, Association of rs7936413 (the lead LeafCutter and QTLtools sQTL SNP) with an excision ratio of 11:46391100:46392863:clu_288873_ and overall mRNA abundance of DGKZ, respectively, in the ROSMAP data. Each box plot shows the distribution of intron excision ratios (c) or mRNA abundances (d) in a genotype class, that is, CC (n = 21), CT (n = 218) or TT (n = 593). The line inside each box indicates the median value, the notches indicate the 95% CI, the central box indicates the IQR, the whiskers indicate data up to 1.5 times the IQR and the outliers are shown as separate dots.
Extended Data Fig. 1
Extended Data Fig. 1. Comparison of statistical power between THISTLE and sQTLseekeR by simulation with transcription abundances generated from a multivariate distribution.
Transcription abundance was simulated from either a multivariate normal distribution (panels a and c) or a multivariate Poisson distribution (panels b and d) with (scenario 4) or without an eQTL effect (scenario 3) in a sample of 500 unrelated individuals (Section 2 of the Supplementary Note). The THISTLE and sQTLseekeR p-values were computed from a one-sided sum of chi-squared test (approximated by the Saddlepoint algorithm) and pseudo-F test (approximated by the Davies algorithm), respectively. Source data
Extended Data Fig. 2
Extended Data Fig. 2. Comparison of statistical power between DRIMSeq, MANOVA, sQTLseekeR, and THISTLE by simulation with transcription abundances generated from RNA-seq reads.
Panels a, b, c and d show the results from 500 simulation replicates to quantify the power, measured by AUC truncated at FPR = 0.05 or 0.001, for DRIMSeq, and MANOVA, sQTLseekeR, and THISTLE. Panel e shows the result from 500 simulation replicates to quantify the power, measured by TPR at different levels of p-value threshold, for sQTLseekeR and THISTLE. Transcriptional abundance data of 500 unrelated individuals were generated by sampling RNA-seq reads to mimic real RNA-seq data using Polyester (Section 2 of the Supplementary Note). The simulations were performed with varying a) sample size, b) sQTL effect size, c) the degree of overdispersion of transcription abundances, and d) the number of isoforms per gene. When one simulation parameter was fixed (for example, n=300 in panel a, all the other parameters were randomly sampled from the specified categories, for example, the sQTL effect size from {small, median, or large}, the number of isoforms per gene from {2, 5, 10, 15, or 20}, and the degree of over-dispersion of transcriptional abundance from {600, 900, 1200, or 1500}. The DRIMSeq, MANOVA, sQTLseekeR, and THISTLE p-values were computed using a one-sided likelihood ratio test, F test, pseudo-F test, and sum of chi-squared test, respectively. Source data
Extended Data Fig. 3
Extended Data Fig. 3. Comparison between sQTL results from the sQTLseekeR, THISTLE, and LeafCutter & QTLtools analyses of real data.
The analyses were performed with the ROSMAP data (n = 832). Panel a shows the numbers of overlapping sGenes between THISTLE and sQTLseekeR. Panel b shows the numbers of overlapping sGenes considering only the SNP-gene pairs tested in common between THISTLE and sQTLseekeR. Panel c shows the number of sGenes discovered at different p-value thresholds for THISTLE and sQTLseekeR. Panel d shows the ratio of the number of sGenes identified by THISTLE to that by sQTLseekeR at different p-value thresholds. Panels e and f show the replication rates of the lead cis-sQTL SNPs at PsQTL < 0.05 and PsQTL < 0.05/m (where m is the number of SNPs taken forward for replication for each method), respectively. Each row represents an analysis from which the lead cis-sQTL SNPs (one SNP per gene) were identified (P<5×10⁸), and each column represents an analysis in which the SNPs were replicated. The THISTLE, sQTLseekeR, and LeafCutter & QTLtool p-values were computed using a one-sided sum of chi-squared test, pseudo-F test, and chi-squared test, respectively. Source data
Extended Data Fig. 4
Extended Data Fig. 4. Comparison of runtime between THISTLE and sQTLseekeR.
We benchmarked the runtime of THISTLE (implemented in OSCA) on a computing platform with 16 GB memory and 16 CPU cores, in comparison with sQTLseekeR2-nf, using the ROSMAP data (n = 832) with 382 genes and 109,853 SNPs on chromosome 22. We repeated each analysis with 10 replicates. Source data
Extended Data Fig. 5
Extended Data Fig. 5. Workflow of the sQTL and eQTL analyses in this study.
RINT: rank-based inverse normal transformation. * Note: we have implemented the QTLtools QTL mapping method (linear regression) in OSCA and used the two tools interchangeably, for example, OSCA for real data analysis to save the sQTL or eQTL mapping results in SMR BESD format and QTLtools for eQTL or Leafcutter sQTL permutation analysis.
Extended Data Fig. 6
Extended Data Fig. 6. Number of sGenes identified by THISTLE based on four different transcriptome references.
The four transcriptome references are RefSeq, GENCODE-Basic (v37), GENCODE (v37), and de novo assembly (constructed from the RNA-seq data using StringTie based on GENCODE). Panel a shows the comparison in the number of sGenes in the MSBB cohort (n = 183), and panel b shows the comparison in the whole dataset (n = 2,865). Source data
Extended Data Fig. 7
Extended Data Fig. 7. Comparison between the sQTLs results from THISTLE and LeafCutter & QTLtools.
a) Comparison between the sGenes identified by THISTLE and LeafCutter & QTLtools. b) COLOC PP3 and PP4 values between the THISTLE and LeafCutter & QTLtools sQTL signals, and LD r2 between the lead THISTLE and LeafCutter & QTLtools cis-sQTL SNPs for 5,113 overlapping sGenes. In panel b, the bold line inside each box indicates the median value, notches indicate the 95% confidence interval (CI), the central box indicates the interquartile range (IQR), and whiskers indicate data up to 1.5 times the IQR. Source data
Extended Data Fig. 8
Extended Data Fig. 8. Enrichment of the lead THISTLE or LeafCutter & QTLtools cis-sQTL SNPs in functional annotation categories.
The annotation categories were defined by the chromatin state annotation data from REMC (a), histone marks from REMC (b), predicted variant functions by SNPEff (c), or eCLIP peaks of 113 RBPs binding sites from ENCODE (d). The fold enrichment was computed by dividing the percentage of lead cis-sQTL SNPs in a category by the mean percentage observed in 1,000 sets of control SNPs sampled repeatedly at random (Methods). Each column represents a point estimate with an error bar indicating the 95% CI of the estimate. The grey dashed line represents no enrichment. The numbers in the parentheses are the numbers of THISTLE/LeafCutter & QTLtools sQTL SNPs in each functional category. In panel d, a violin plot shows the distribution of fold enrichment estimates across 113 RBPs binding sites. The line inside each box indicates the median value, notches indicate the 95% CI, the central box indicates the IQR, whiskers indicate data up to 1.5 times the IQR, and outliers are shown as separate dots. Source data
Extended Data Fig. 9
Extended Data Fig. 9. Association of SETD6 with schizophrenia identified using either sQTL or eQTL data.
a) The top track shows −log10(p-values) of SNPs from the schizophrenia GWAS. The second and third tracks show −log10(p-values) from the THISTLE sQTL and eQTL analyses, respectively. The THISTLE sQTL and eQTL p-values were computed using a one-sided sum of chi-squared test and chi-squared test, respectively. b) Association of rs7198594 (the lead eQTL SNP) with the overall mRNA abundance of SETD6 in the ROSMAP data (n = 832). Each boxplot shows the distribution of mRNA abundances in a genotype class, that is, CC (n = 288), CT (n = 392), or TT (n = 152). The line inside each box indicates the median value, notches indicate the 95% CI, the central box indicates the IQR, whiskers indicate data up to 1.5 times the IQR, and outliers are shown as separate dots. c) Isoform-eQTL effects for SETD6 in the whole dataset (n = 2,865), with ENST00000310682.6 and ENST00000219315.9 at the two extremes with opposite isoform-eQTL effects. Each dot represents an estimate of isoform-eQTL effect with an error bar indicating the 95% CI of the estimate.
Extended Data Fig. 10
Extended Data Fig. 10. Trans-sQTL analysis.
a) Overlaps between trans-sGenes, cis-sGenes, and trans-eGenes. b) Overlap of the trait-associated trans-sGenes and trans-eGenes identified by SMR & COLOC PP4. c) Association of SYTL2 with major depression (MD) through both the trans-sQTLs and trans-eQTLs. The top track shows −log10(p-values) of SNPs from the MD GWAS. The second and third tracks show −log10(p-values) from the THISTLE trans-sQTL and trans-eQTL analyses, respectively, for SYTL2. d) Manhattan plot of p-values from genome-wide THISTLE sQTL analysis for SYTL2. The blue arrow indicates the genomic position where SYTL2 is located. The GWAS and eQTL p-values in panel c were computed using a one-sided chi-squared test, and the THISTLE sQTL p-values in panels c and d were computed using a one-sided sum of chi-squared test.

References

    1. Visscher PM, et al. 10 years of GWAS discovery: biology, function, and translation. Am. J. Hum. Genet. 2017;101:5–22. doi: 10.1016/j.ajhg.2017.06.005. - DOI - PMC - PubMed
    1. Buniello A, et al. The NHGRI-EBI GWAS Catalog of published genome-wide association studies, targeted arrays and summary statistics 2019. Nucleic Acids Res. 2018;47:D1005–D1012. doi: 10.1093/nar/gky1120. - DOI - PMC - PubMed
    1. Maurano MT, et al. Systematic localization of common disease-associated variation in regulatory DNA. Science. 2012;337:1190–1195. doi: 10.1126/science.1222794. - DOI - PMC - PubMed
    1. Ward LD, Kellis M. Interpreting noncoding genetic variation in complex traits and human disease. Nat. Biotechnol. 2012;30:1095. doi: 10.1038/nbt.2422. - DOI - PMC - PubMed
    1. Morley M, et al. Genetic analysis of genome-wide variation in human gene expression. Nature. 2004;430:743–747. doi: 10.1038/nature02797. - DOI - PMC - PubMed

Publication types

MeSH terms