. 2022 Aug;3(8):961-975.
doi: 10.1038/s43018-022-00414-w. Epub 2022 Aug 18.

Single-cell analysis and functional characterization uncover the stem cell hierarchies and developmental origins of rhabdomyosarcoma

Affiliations

Single-cell analysis and functional characterization uncover the stem cell hierarchies and developmental origins of rhabdomyosarcoma

Yun Wei et al. Nat Cancer. 2022 Aug.

Abstract

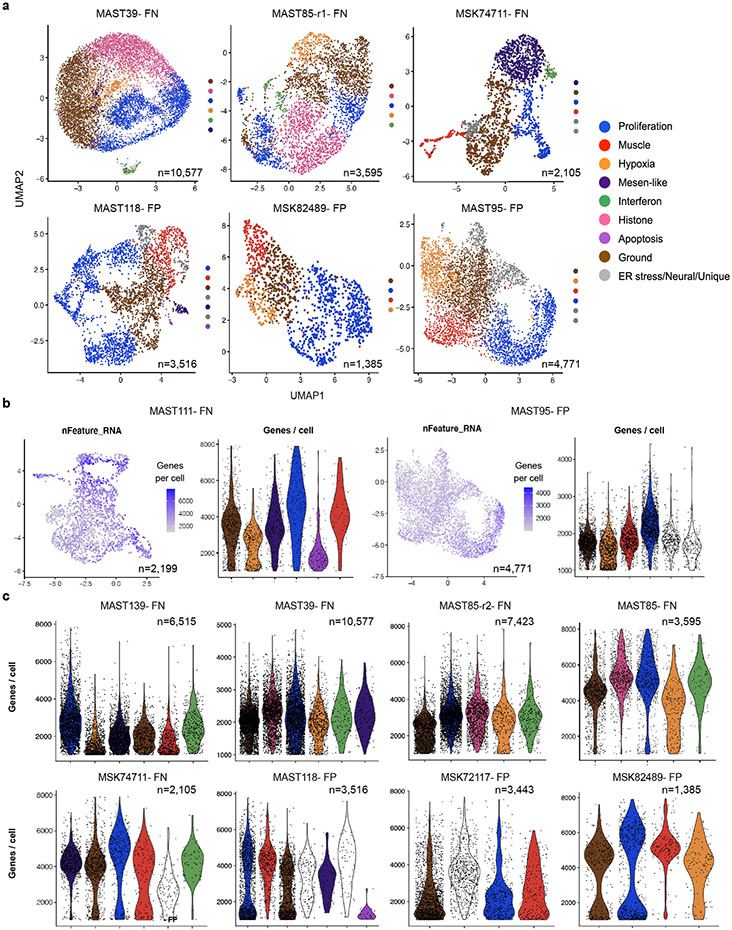
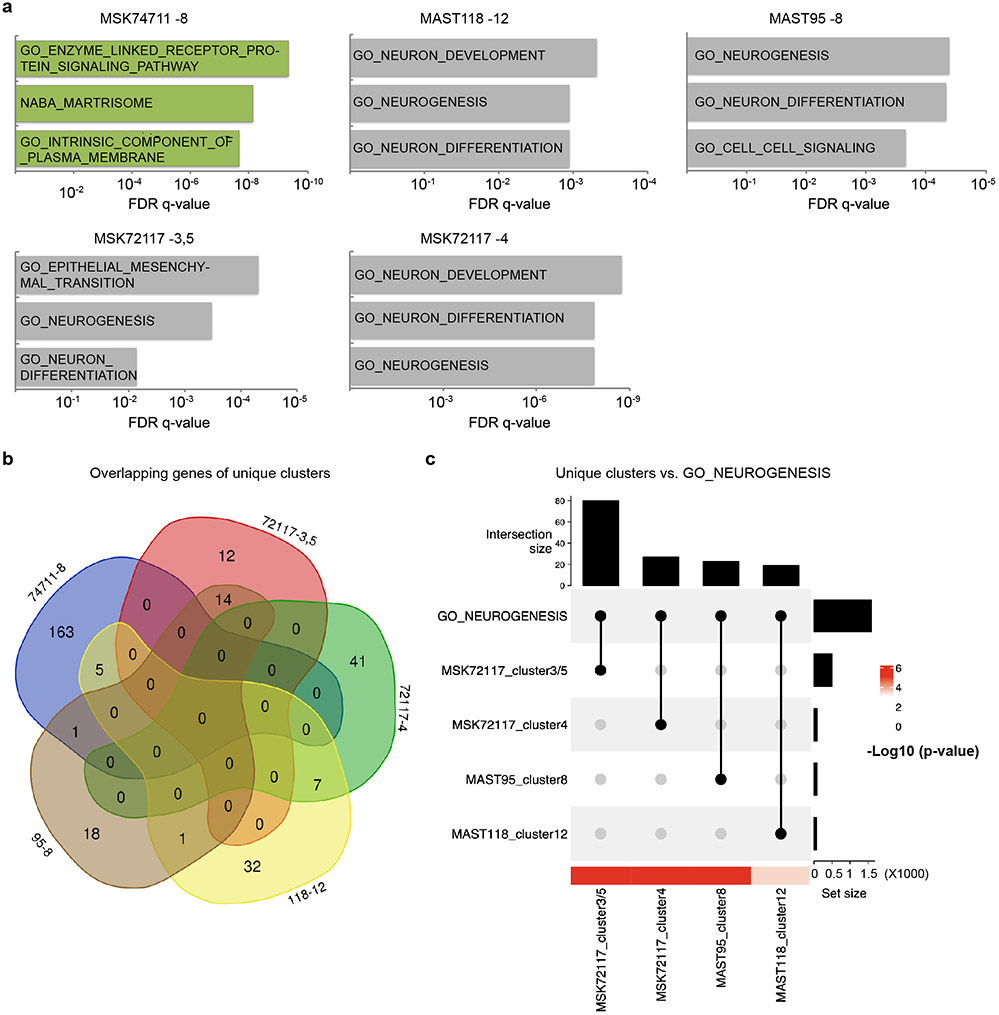
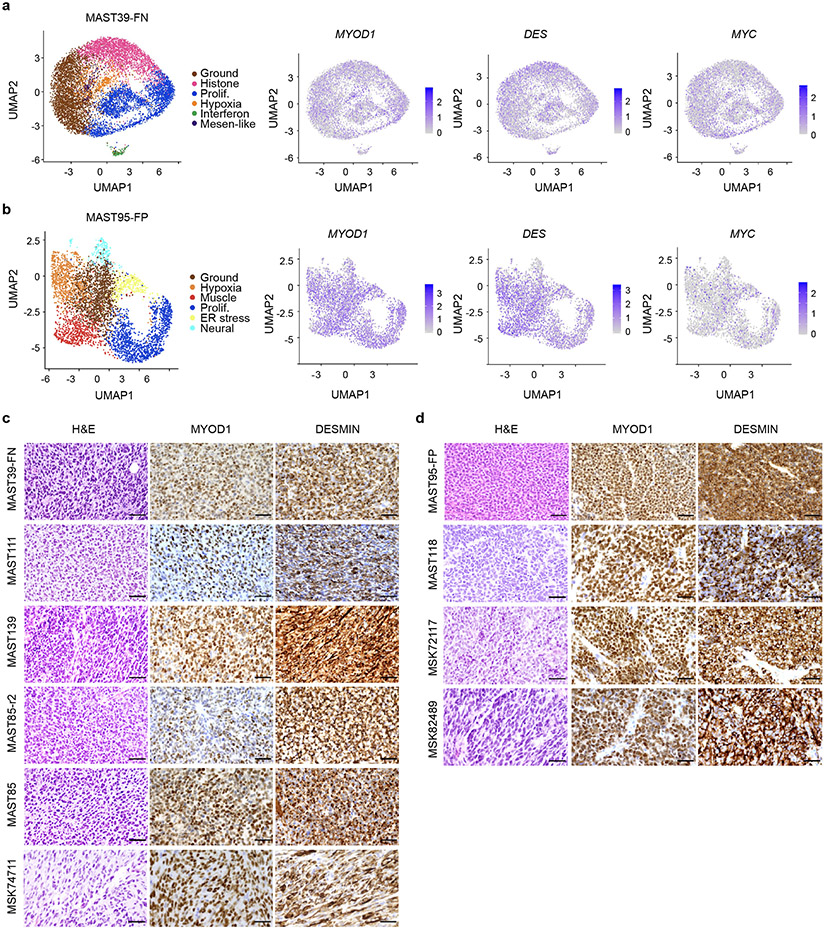
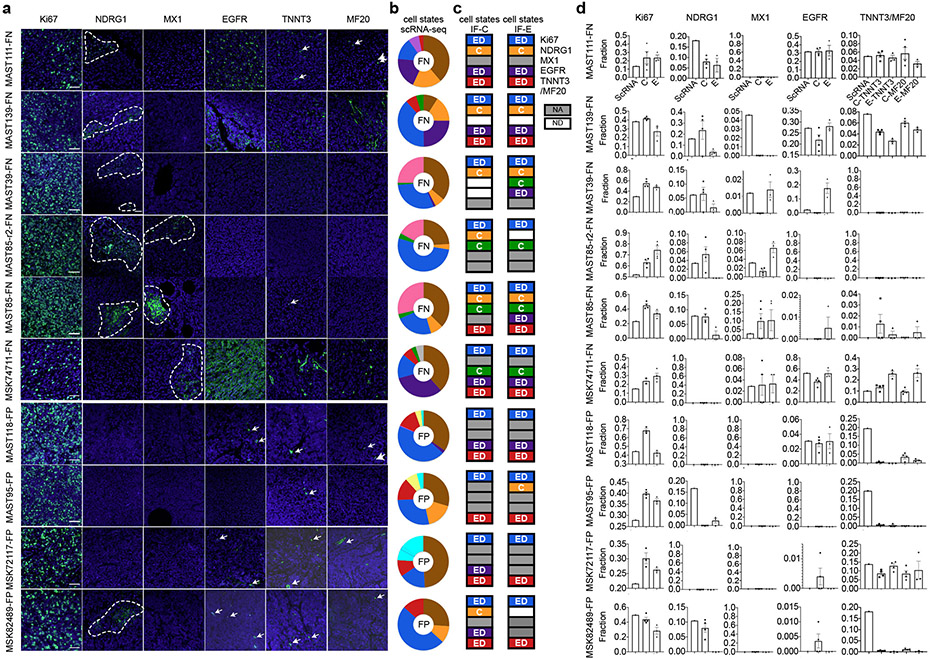
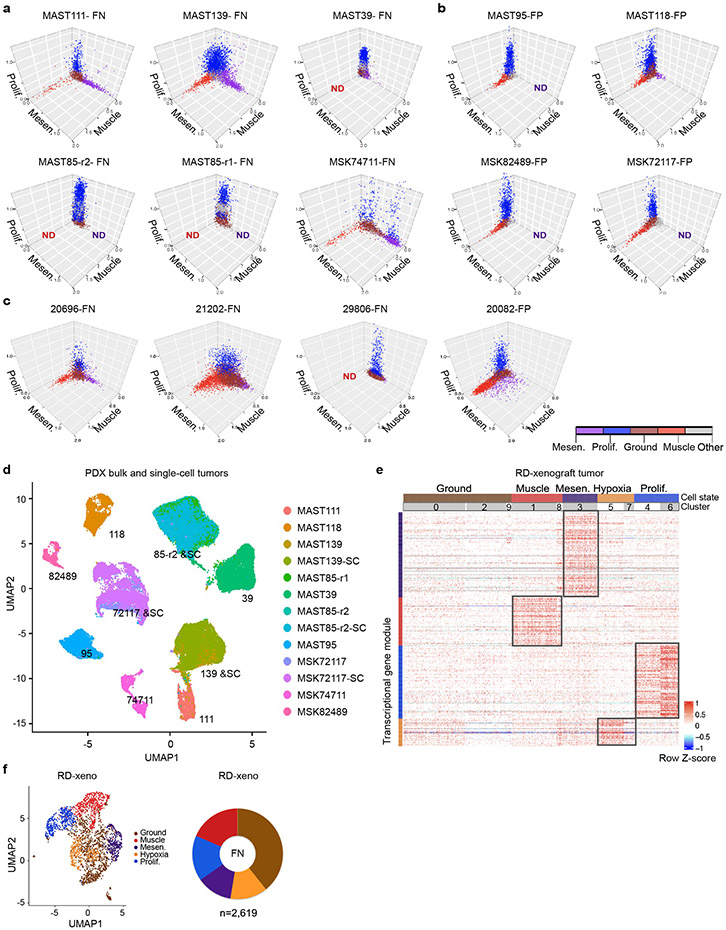
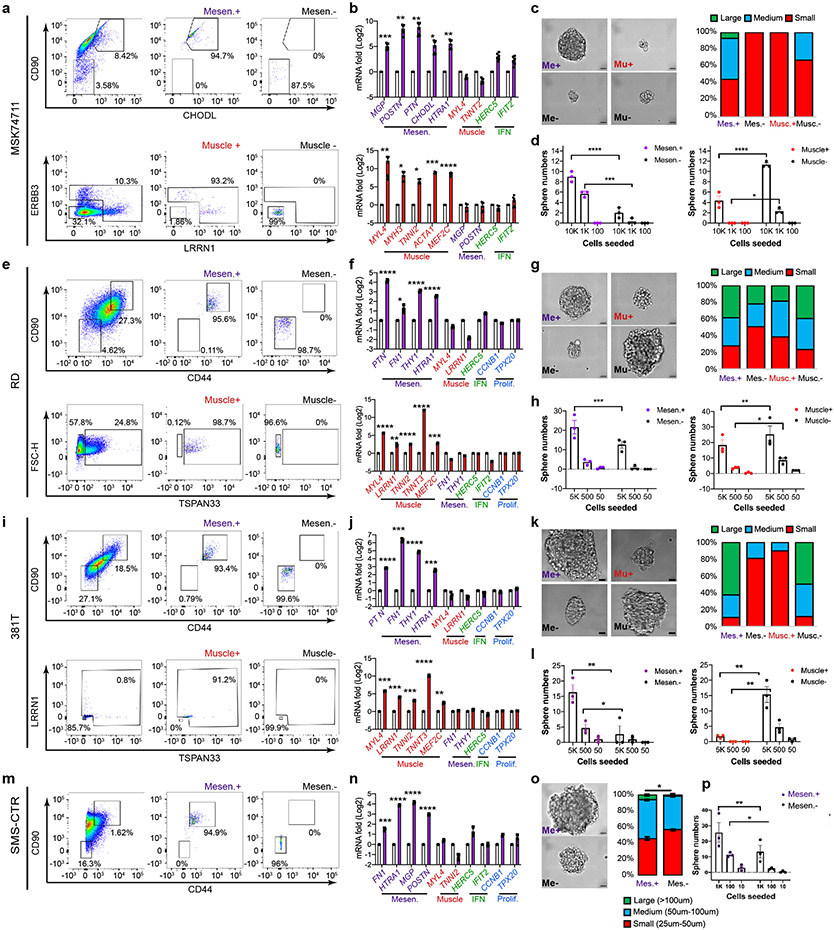
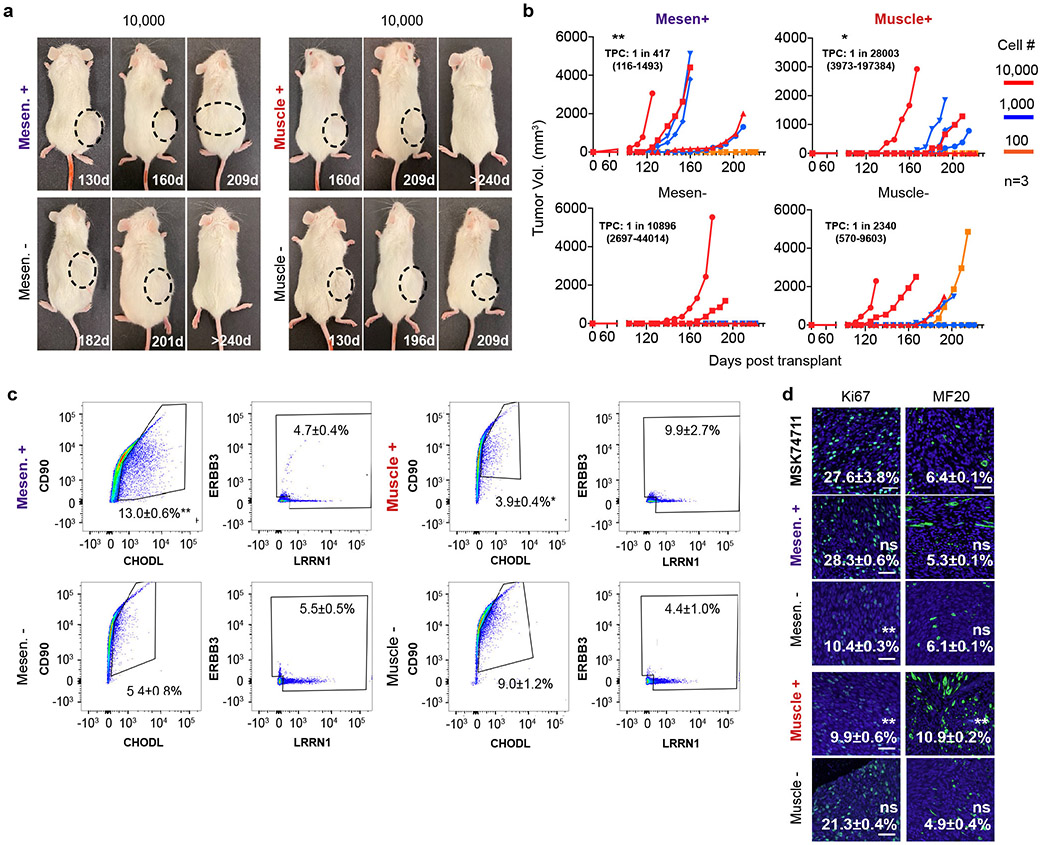
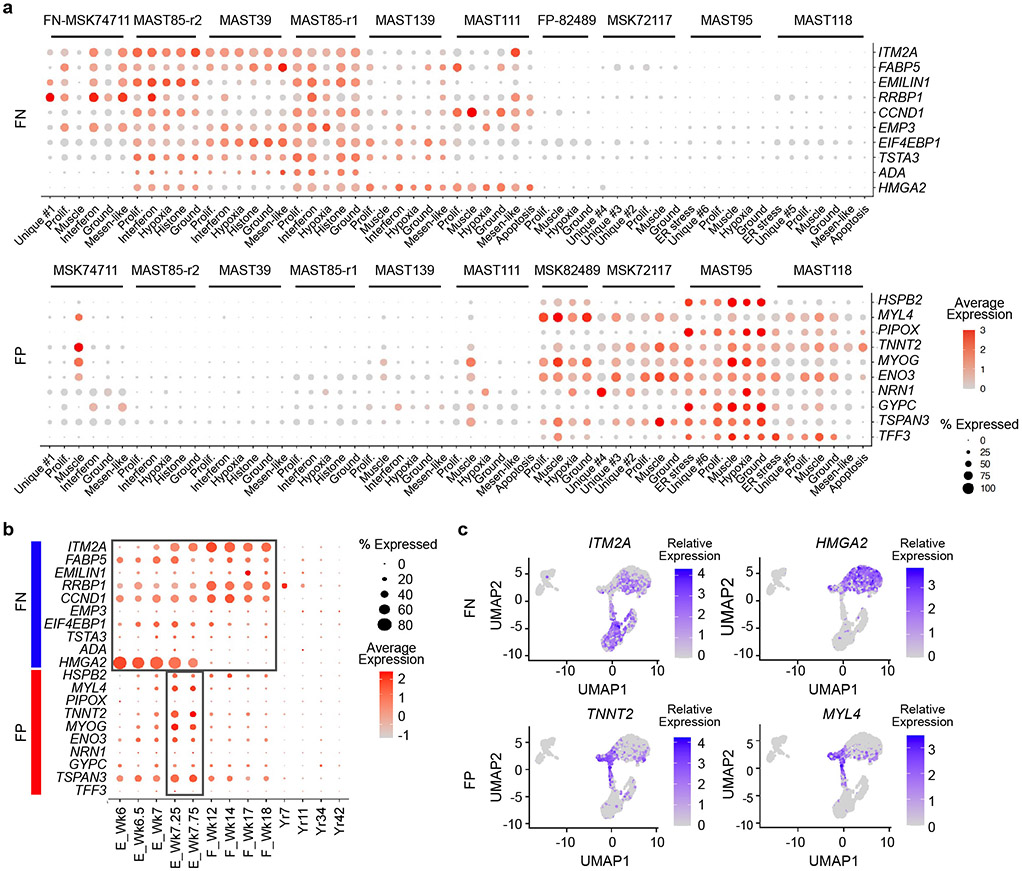
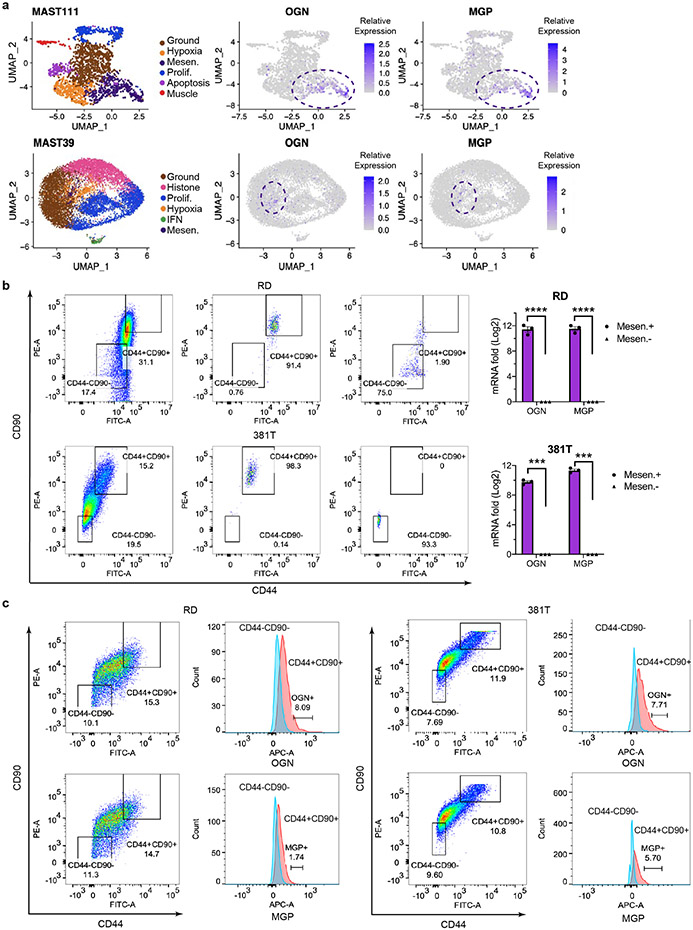
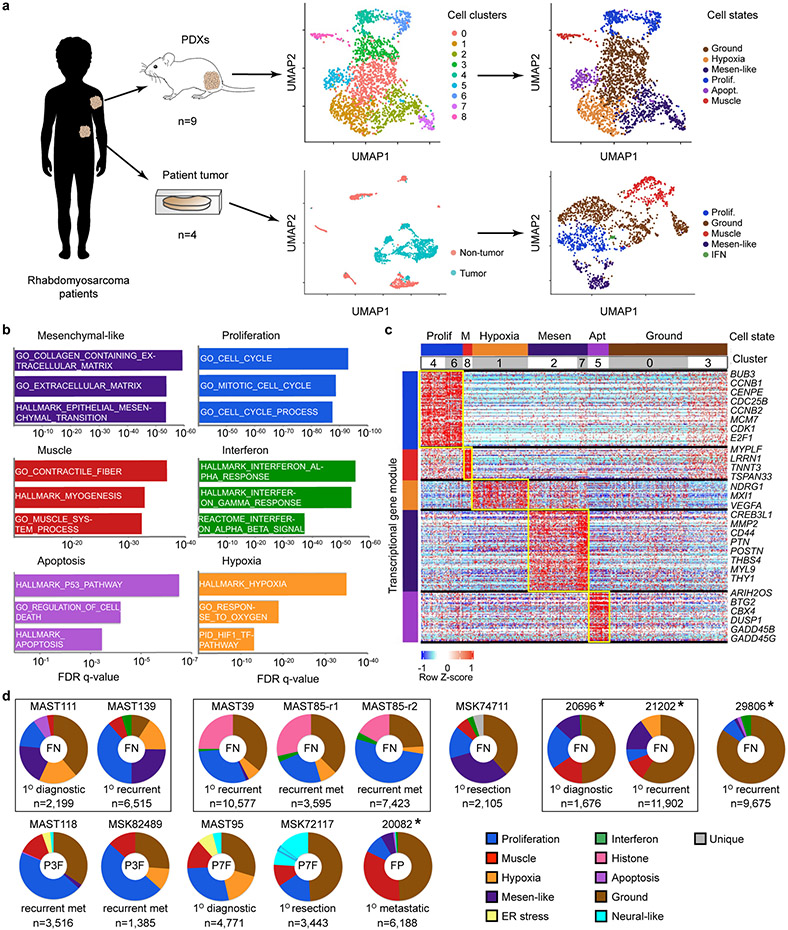
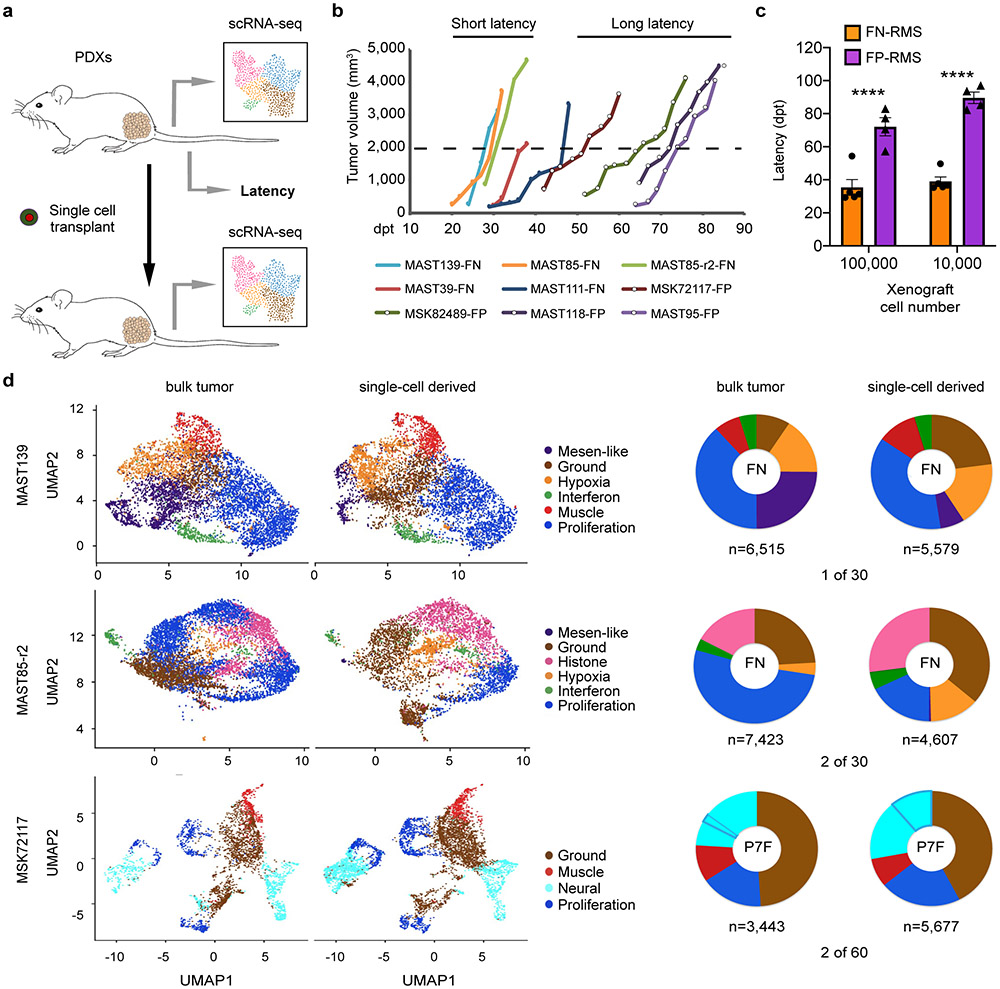
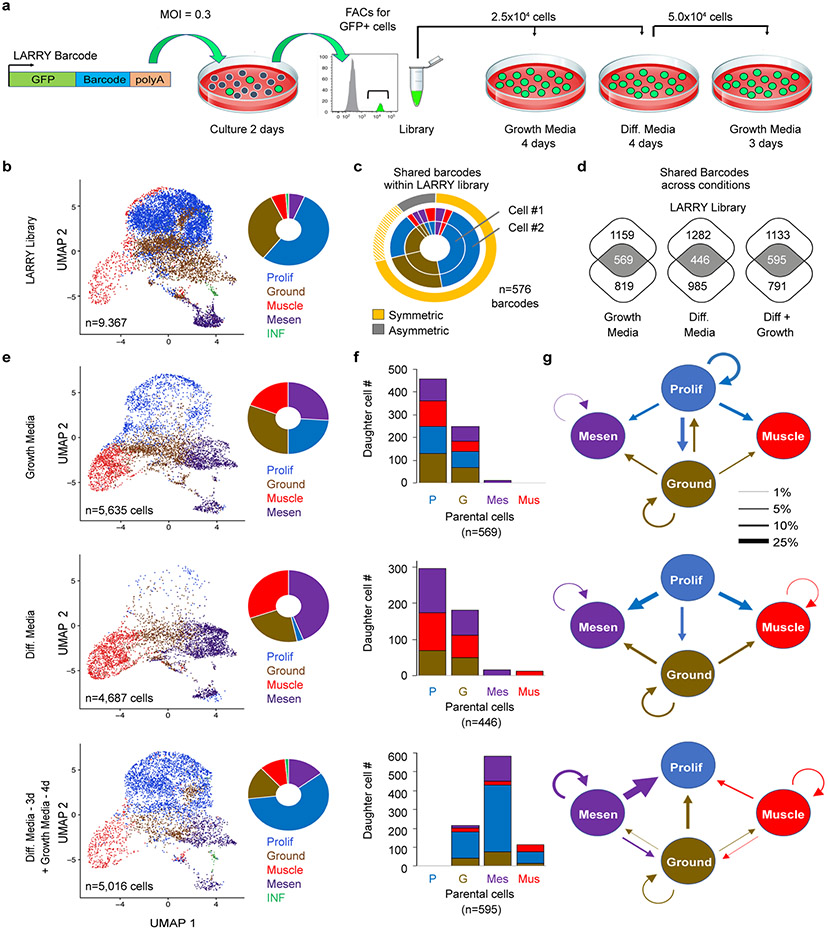
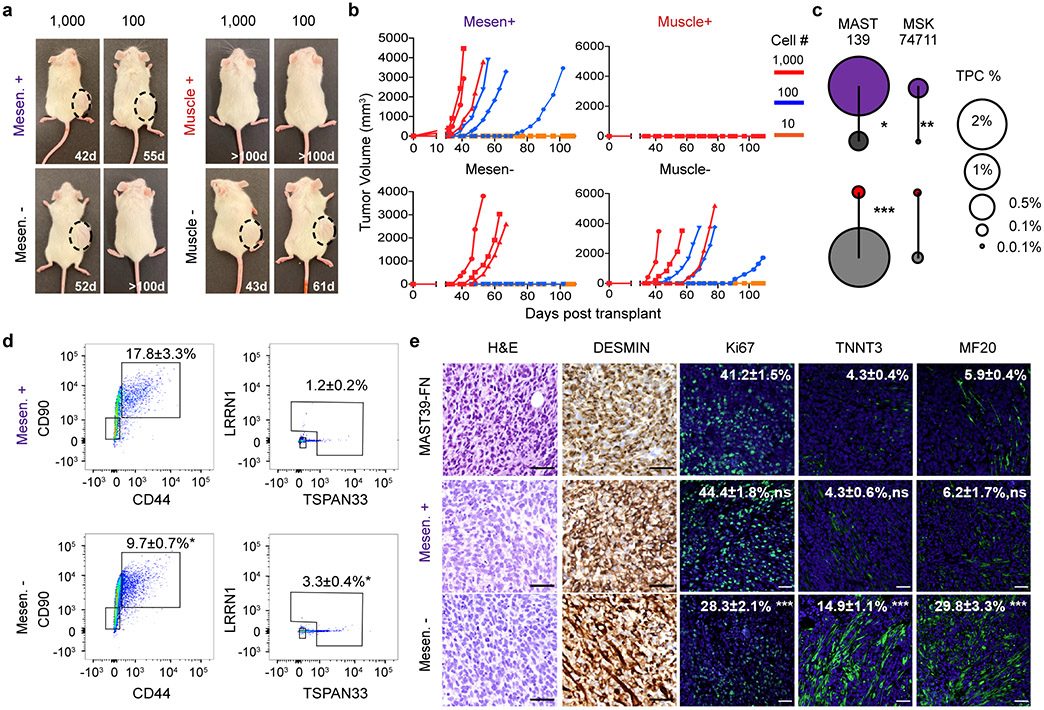
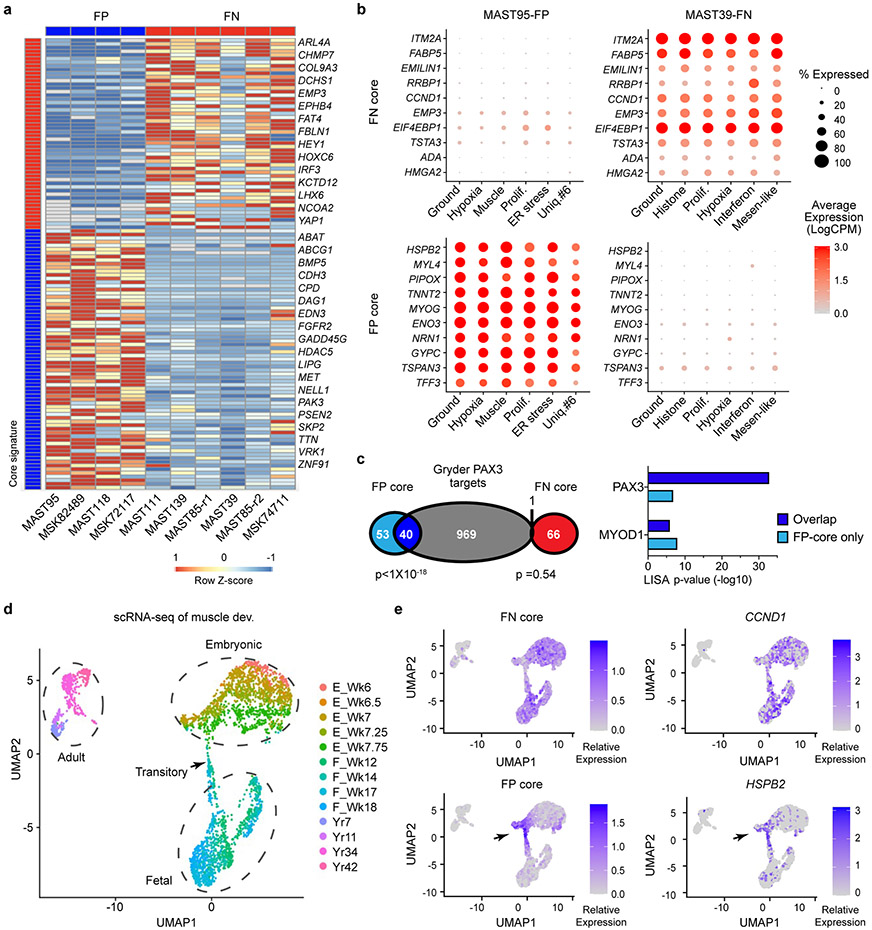
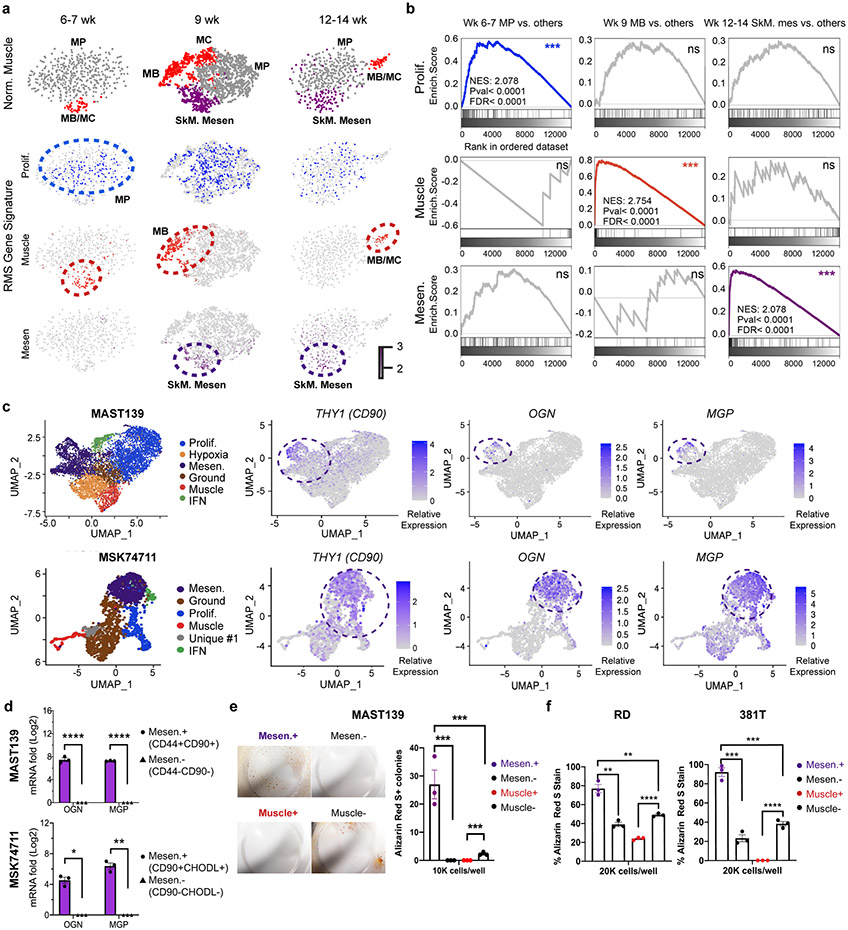
Rhabdomyosarcoma (RMS) is a common childhood cancer that shares features with developing skeletal muscle. Yet, the conservation of cellular hierarchy with human muscle development and the identification of molecularly defined tumor-propagating cells has not been reported. Using single-cell RNA-sequencing, DNA-barcode cell fate mapping and functional stem cell assays, we uncovered shared tumor cell hierarchies in RMS and human muscle development. We also identified common developmental stages at which tumor cells become arrested. Fusion-negative RMS cells resemble early myogenic cells found in embryonic and fetal development, while fusion-positive RMS cells express a highly specific gene program found in muscle cells transiting from embryonic to fetal development at 7-7.75 weeks of age. Fusion-positive RMS cells also have neural pathway-enriched states, suggesting less-rigid adherence to muscle-lineage hierarchies. Finally, we identified a molecularly defined tumor-propagating subpopulation in fusion-negative RMS that shares remarkable similarity to bi-potent, muscle mesenchyme progenitors that can make both muscle and osteogenic cells.


Conflict of interest statement

Competing Interests Statement: A.J.I. receives royalties from ArcherDx and consults for Paige.AI, Repare Therapeutics, Oncoclinicas Brasil, and Kinnate Biopharma. M.L.S. is an equity holder, scientific co-founder, and advisory board member of Immunitas Therapeutics. L.P. has financial interests in Edilytics and SeQure Dx, Inc. All potential competing interests are reviewed and managed by Massachusetts General Hospital and Mass General Brigham HealthCare in accordance with their conflict-of-interest policies. D.M.L receives sponsored research funds from NextCure for an unrelated project.

Figures

Extended Data Fig. 1.
Frozen RMS patient samples have similar cell states as those found in PDX models and cell states contain largely similar numbers of expressed genes per cell. a-b. UMAP showing all cells sequenced from representative FN-RMS 20696. Non-tumor cells were assigned using Cellassign and clusterprofiler enricher analysis (a) and tumor cells analyzed for expression of diagnostic markers for rhabdomyosarcoma (b). c. UMAP visualization of tumor cells from primary FN-RMS 20696. d. Heatmap showing single cells (x-axis) and genes enriched for specific transcription modules (y-axis, FN-RMS 20696). Cells are arranged by UMAP clusters, combined based on expression similarity, and then assigned a specific cell state as noted. e. UMAP renderings for primary RMS samples juxtaposed with graphical analysis showing detected genes/cell when analyzed across different cell states.
Extended Data Fig. 2.
Gene clusters identified by scRNA sequencing of RMS PDXs and expression of similar numbers of detected genes per cell across cell states. a. UMAP renderings of all PDXs, with exception of MAST111, MAST139, MAST85-r2, MSK72117, that were shown in Fig. 1a and Fig. 2d. b. Representative examples of FN-RMS (left) and FP-RMS (right). UMAP showing genes detected per cell (left). Violin plots showing genes detected within each cell for a given RMS subpopulation (right). c. All PDX models assessed by violin plots denoting the number of detected genes per cell across RMS subpopulations.
Extended Data Fig. 3.
A subset of fusion-positive RMS contain unique and tumor-specific cell clusters that express neural genes. a. Top enriched molecular signatures from MSigDB are shown for each unique cell cluster identified from individual FP-RMS PDX models. False Discovery Rate (FDR) q-values noted. Tumor and cluster number are noted (i.e., MSK74711-8). b. Venn diagram showing little overlap in gene expression across unique transcription clusters identified from different tumors. c. Upset plot quantifying the gene set enrichment of unique clusters with the GO_NEUROGENESIS gene set (p-values defined by Fisher’s Exact Test).
Extended Data Fig. 4.
RMS cells ubiquitously express a subset of muscle lineage and cancer-specific genes. a-b. UMAP visualizations showing cell states (left panels) and compared with gene expression for MYOD, DESMIN (DES) and MYC. Representative examples shown for fusion-negative (MAST39) and fusion-positive RMS (MAST95). c-d. Histological analysis of PDXs grown in NSG mice. Representative sections of tumors, Hematoxylin and Eosin (left) and immunohistochemistry for MYOD and DESMIN (right). Fusion-negative (FN, c) and Fusion-positive RMS (FP, d). Scale bar=50μm.
Extended Data Fig. 5.
Immunofluorescence antibody staining reveals intermingling of cell states in PDX tumors. a,c. Immunofluorescence staining within the central tumor mass (a) or at the invasive edge (c). Dashed lines indicate clustered cell populations. Arrows denote rare cells detected by IF staining. Scale bar= 50μm. b,d. Heterogeneity identified by single-cell RNA sequencing (left, b) and compared with immunofluorescence staining of the central tumor mass (b) or at the invasive edge (d, right). Color coding denotes that immunofluorescence was detected in tumor cells within the sections analyzed. Not detected (ND). Not applicable (NA). Evenly distributed through tumor (ED) or clustered (C) based on immunofluorescence staining. e-f. Quantitation of cell state percentages assessed by scRNA-sequencing or immunofluorescence. Error bar equals S.E.M. (n=4 image felids analyzed per condition, range 207-643 cells/field).
Extended Data Fig. 6.
Cell state heterogeneity in primary patient samples, PDX models, single cell engrafted tumors, and RD cells grown in mouse xenografts. a-c. 3D renderings of gene expression for muscle (x-axis), proliferation (z-axis), mesenchymal-like (y-axis) gene modules identified in RMS samples (a, FN-PDXs; b, FP-PDXs, c, primary patient samples). Individual cells are noted by dots and color coded based on cell assignments shown in Figure 1d. Not detected (ND) denotes lack of a given cell state both in the initial UMAP cell cluster annotations and in 3D gene expression space. d. Combined UMAP visualization for all parental and single cell derived PDX models. e-f. Single cell RNA sequencing of RD xenograft. Heatmap showing single cells (x-axis) and genes enriched for specific transcription modules (y-axis, e). Cells are arranged by UMAP clusters, combined based on expression similarity, and then assigned a specific cell state as noted. f. UMAP rendering of xenografted RD cells following single cell sequencing (left) and quantification of cell state composition of all 2,619 RD cells profiled (right). Similar cell states are observed in RD cells raised in 2D cell culture (See Figure 3).
Extended Data Fig. 7.
Tumor-propagating potential is enriched in the mesenchymal-enriched tumor cell fraction in FN-RMS. a, e, i ,m. Flow cytometry analysis of FN-MSK74711 cells harvested directly from PDX tumors grown in NSG mouse (a) or cell line models prior to (left) and after FACS enrichment (right two panels). b,f,j,n. Quantitative real-time PCR confirming cell state enrichment following FACS. Mean±SEM from 6 independent replicates. Two-way ANOVA followed by two-sided Student’s t-test comparison (*p<0.05, **p<0.01; ***p<0.001 and ****p<0.0001). c, g, k, o, Representative images of sphere size following FACS enrichment and plating for two weeks (scale bar=20μm). d, h, l, p, Quantification of sphere sizes. All spheres from the highest limiting dilution group were counted per condition. Shown are the average percentages by sphere size across all replicates for n=2 animals from MSK74711 (two biological replicates, 3 technical replicates per experiment). RD (two biological replicates, 3 technical replicates per experiment), 381T (two biological replicates, 3 technical replicates per experiment), and SMS-CTR cell lines (three biological replicates, 3 technical replicates per experiment). Mean±SEM noted for SMS-CTR, Two-way ANOVA followed by two-sided Student’s T test (*p<0.05, **p<0.01, ***p<0.001). Mesenchymal-enriched (Mesen, Mes, or Me), Muscle (Musc, Mu), Interferon (INF), Proliferative (Prolif).
Extended Data Fig. 8.
Limiting dilution cell transplantation confirms that mesenchymal-enriched cells from FN-RMS PDX 74711 are enriched for tumor propagating potential in vivo. a. Representative images of NSG mice engrafted with CHODL+/CD90+ mesenchymal-enriched or CHODL−/CD90− MSK74711 PDX RMS cells (all three mice from 10,000 cells/mouse group are shown). Mice were imaged at days post-transplantation as noted. Dashed lines delineate tumor. b. Latency of tumor regrowth following engraftment into NSG mice. TPC frequency+/−95% confidence interval noted per condition in parenthesis. Quantification by ELDA *, p<0.05, **, p<0.01. c. Flow analysis of tumors generated from sorted cell populations, mean±SEM noted, n=3 independent tumors, * p<0.05, ** p<0.01, *** p<0.001 by two-sided student’s t-test comparing the Mesen.+ vs. Mesen.− populations. d. Immunostaining of Ki67 proliferation and MF20 differentiation muscle markers in animals engrafted with FACs sorted cells. n= 3 independent tumors. For each tumor, four random fields were selected for quantification. mean ± SEM., * p<0.05, ** p<0.01, ***, p<0.001, by two-sided Student’s t-test.
Extended Data Fig. 9.
Subtype-specific RMS core signatures are expressed at specific muscle development stages. a,b. Dot plot renderings showing the expression of ten representative genes that comprise the fusion-negative or fusion-positive core signature across all PDXs and their identified cell states (a) and across normal muscle cells stratified by age (b). c. UMAP rendering of scRNA sequencing data from embryonic, fetal, and adult skeletal muscle showing expression of representative subtype-specific core signature genes. Week or year of life is noted (Wk and Yr, respectively).
Extended Data Fig. 10.
Osteogenic markers are expressed in the mesenchymal-enriched FN-RMS tumor propagating cells. a. TSNE renderings denoting cell state (left) and compared with OGN and MGP expression in representative FN-RMS PDXs. b. FACS sorting of RD and 381T FN-RMS cells followed by qRT-PCR validates the enrichment of osteogenic markers OGN and MGP within the mesenchymal-enriched subpopulation. qRT-PCR samples are the same as those rendered in Figure 4 and Extended Data Fig. 7, Mean±SEM across three independent biological replicates. *** p<0.001, **** p<0.0001 by ANOVA followed by two-sided Student’s T test. c. Flow cytometric analysis confirming cell surface expression of OGN and MGP in mesenchymal-enriched subfractions of RD and 381T RMS cells.
Fig. 1.
Fig. 1.
Single-cell RNA-sequencing reveals distinct cell states and intertumoral heterogeneity in human RMS. a. Schematic of experimental design. UMAP renderings of representative fusion-negative (FN) RMS from patient-derived xenograft MAST111 (top) and primary patient 20696 (bottom). Non-tumor cells were removed from primary patient sample analysis using Cellassign and tumor cells verified for expression of RMS subtype-specific gene signatures and diagnostic marker expression (middle panel, bottom). Tumor cells were assigned to UMAP clusters and combined based on shared gene expression similarities (right). b. RMS cell state signatures queried against the Molecular Signatures Database v7.4. Top enriched molecular signatures were generated from analysis of all PDX samples (n=10, including MAST85 run in replicate) and are shown with False Discovery Rate (FDR) q-values noted. c. Representative heatmap showing single cells (x-axis) and genes enriched for specific transcriptional gene modules (y-axis) for FN-MAST111 PDX. d. Quantification of cell states within individual tumors. Frozen patient tumors denoted by asterisks. Fusion negative (FN, top) and fusion-positive (FP, bottom). PAX3:FOXO1 (P3F) and PAX7:FOXO1 (P7F). The black boxes indicate samples obtained from the same patient. MAST85-r1 and r2 are replicates of the same PDX tumor. Number of cells analyzed noted for each tumor within image panels.
Fig. 2.
Fig. 2.
Single RMS cells can remake all tumor cell heterogeneity within the cancer. a. Schematic of experimental design. b. Representative tumor growth in PDX models. Threshold cut off for assigning short verses long latency was attaining a tumor volume of 2000mm3 by 40 days post-transplant (dpt, 1x10⁵ cells engrafted per mouse). c. Quantification of latency differences between FN- and FP-RMS completed at two dilutions (1x10⁵ and 1x10⁴ cells, n=5 FN-RMS PDXs and n=4 FP-RMS PDXs). Datum points show the average latency from individual mine (n=3 mice per tumor). Mean ± SEM noted. Two-way ANOVA followed by two-sided Student’s t-test, **** p<0.0001. d. UMAP renderings of parental bulk tumor compared with tumors derived from engraftment of a single RMS cell (left panels). Quantification of cell states by tumor (right). Fusion-negative (FN) and PAX7-FOXO1 fusion-positive RMS (P7F). Number of cells sequenced are indicated below each wheel chart and number of tumors generated from single cell engraftment is noted (i.e. 1 of 30 single cells engrafted tumors by 180 days post transplantation).
Fig. 3.
Fig. 3.
Lineage And RNA RecoverY (LARRY) barcoding of human FN-RMS RD cells reveals that the mesenchymal-enriched cell subfraction is capable of driving tumor growth following culture in low serum, stress conditions. a. Schematic of experimental design. b. UMAP rendering and quantitation of cell states within the LARRY barcoded library (n=9,367 cells). c. Quantification of RMS cells within the library that share the same LARRY barcode and juxtaposed with cell state assigned by gene expression from scRNA sequencing. Cells that divided over the two days of culture adopted largely symmetric cell fates. Dashed yellow highlighting denotes a common and inferred oscillating cell state found in ground and proliferative RMS cells. d. Venn diagram showing shared barcodes found in the LARRY library and after growth under various conditions. e. UMAP renderings and quantitation of cell states following growth under various conditions. f. Analysis of parental cell contribution to overall tumor growth and subsequent generation of daughter cells following cell culture including high serum (top), low serum (middle), and low serum followed by replating into high serum (bottom). g. Quantification of cell lineage and fate decisions under varied growth conditions. Arrow direction and size indicates the probability of a parent cell dividing to produce a daughter cell with the specified cell fate.
Fig. 4.
Fig. 4.
Tumor propagating potential is found within the mesenchymal-enriched cell fraction of fusion-negative RMS. a. Schematic of experimental design. b-e. Analysis of FN-MAST139 cell subpopulations for enrichment of tumor propagating potential. b. Flow cytometry analysis of FN-MAST139 cells harvested directly from a PDX tumor grown in a NSG mouse prior to (left) and after FACS (right). Representative of n=3 mice shown with similar results. c. Quantitative real-time PCR confirming cell state enrichment following FACS (n=3 independent tumors analyzed in replicate, 6 datum points shown). *** p=0.0005, **** p<0.0001. d. Quantification of tumorsphere formation in a representative experiment from PDX MAST139 (tumor cells were directly harvested from a xenografted mouse, n=3 wells/dilution). Experiment was replicated three times from independently engrafted mice with similar results (see source data). Mesen+ vs. Mesen−, *** p=0.0001, Muscle+ vs. Muscle−, *** p=0.0005, **** p<0.0001. e. Representative images of MAST139 tumorspheres (left) and quantification of size distributions (right), scale bar = 20μm. Experiment was replicated three times from independently engrafted mice with similar results (see source data). *** p=0.0005, ** p=0.0074. f. Barbell plot showing differences in the percentage of tumor propagating cells (TPC) determined by limiting dilution tumorsphere assay for MAST139 (139), MSK74711 (74711), RD, 381T, and SMS-CTR (CTR) (* p<0.05, ** p<0.01, ***, p<0.001, ****, p<0.0001 by Extreme Limiting Dilution Analysis, see Supplementary Table 3 for p-values). Mean ± S.E.M noted (c, d, e). Two-way ANOVA followed by two-sided Student’s t-test (c, d, e).
Fig. 5.
Fig. 5.
Limiting dilution cell transplantation confirms that the FN-RMS mesenchymal-enriched subfraction has tumor propagating potential in vivo. a. Representative images of NSG mice engrafted with CD44+/CD90+ mesenchymal-enriched or CD44−/CD90− MAST139 PDX RMS cells (100 and 1,000 cells/mouse). Mice imaged at specific days post-transplantation as noted. Dashed lines delineate tumor. Representative image from n=3 independently engrafted mice shown for each dilution with similar results. b. Latency of tumor regrowth following engraftment into NSG mice. Day 0 is the day of initial engraftment. c. Barbell plot showing differences in the percentage of tumor propagating cells (TPCs) determined by limiting dilution cell transplant of FN-MAST139 and FN-MSK74711 (n=3 animals engrafted per log10 fold dilution). * p=0.02, ** p=0.007, *** p=0.0004. d. Flow analysis of tumors generated from sorted cell populations. Representative FACS plot with mean±SEM noted for analysis of three independently engrafted animals, *** p=0.0005. e. Histopathological analysis of tumors engrafted from RMS sorted cell subpopulations. Representative images of hematoxylin and eosin stain (H&E), immunohistochemistry analysis for Desmin, immunofluorescence for proliferation marker Ki67 (*** p=0.0006) and differentiated muscle markers TNNT3 (*** p=0.0005) and MF20 (*** p=0.001). Quantitation is mean±SEM from analysis of three independently engrafted animals (average obtained from four randomly imaged fields for each tumor). Statistics provided for Extreme Limiting Dilution Analysis (c) and two-sided Student’s t-test (d,e). Not significant (ns). Scale bar equal 50 microns (e).
Fig. 6.
Fig. 6.
Rhabdomyosarcoma subtypes share common gene expression patterns and are arrested at distinct stages of fetal and embryonic muscle development. a. Subtype-specific core signatures were generated from pseudo-bulk analysis of single-cell RNA-sequencing data (n=4 FP-RMS PDXs and n=6 FN-RMS PDXs). b. Dot plot renderings showing representative subtype-specific gene expression across cell states in representative FP (left, MAST95) and FN (right, MAST39) RMS. Dot size indicates the percentage of cells in each subpopulation that express the gene and shading denotes the average expression across cells. c. Venn diagram comparing the FP- and FN-core signatures with PAX3 binding genes identified by Berkeley et al., left. LISA analysis showing the top predicted transcription factor binding sites (TF) that regulate the FP- or FN- core genes (right). p-values noted using Fisher Exact Test. d. UMAP rendering of scRNA sequencing of embryonic (n=5 samples), fetal (n=4 samples), and adult skeletal muscle (n=4 samples), each denoted by dotted lines. n=3,251 total cells analyzed. Transitory cells are noted by arrow. Week or year of life is noted (Wk and Yr, respectively). e. Expression of combined subtype-specific core signatures (left) and representative genes (right) expressed in normal muscle development.
Fig. 7.
Fig. 7.
Mesenchymal-enriched FN-RMS TPCs share transcriptional and functional similarities with the bi-potent, skeletal muscle mesenchyme stem cell (SkM. Mesen). a. tSNE visualization of single cell RNA sequencing from human muscle cells (n=508 cells in 6-7 wk, n=2,345 cells in 9 wk, and n=554 cells in 12-14 wk normal muscle samples). Muscle cell states (top panels) and compared with combined gene expression for RMS cell state signatures including proliferation (Prolif.), differentiated muscle (Muscle), and Mesenchymal-like (Mes). Cells states annotated by dotted lines represent significant gene expression similarity by GSEA analysis (FDR<0.25, NES>1.5, p value<0.001). b. Representative examples of gene set enrichment analysis (GSEA) that assessed rhabdomyosarcoma cell state signature expression within the normal muscle cell subpopulations. *** denotes False discovery rate (FDR)<0.25, NES>1.5, p value<0.001. Not significant (ns). Week of life (Wk). c. UMAP visualizations showing cellular states (left) and gene expression for Osteoglycin (OGN), Matrix Gla protein (MGP), and CD90 that label mesenchymal-enriched RMS cells (right). MAST139, n=6,515 cells and MSK74711, n=2,105 cells. d. Quantitative real-time PCR validation of OGN and MGP in FACS isolated mesenchymal-enriched RMS cells from PDX MAST139 and MSK74711. Datum points show expression from three independently engrafted tumors. * p= 0.03, ** p=0.006, **** p<0.0001. e. Osteogenic differentiation assay using MAST139 cells. Representative images of MAST139 stained with Alizarin Red S after 18 days of growth in osteogenic differentiation medium (left) and quantification (right). (n=3 replicates obtained from a single tumor), *** p<0.001. f. Quantification of Alizarin Red S staining following culture of FACS isolated RD and 381T cells in osteogenic differentiation medium, n=3 replicates obtained from independent sorting of RD and 381T cells, RD Mesen+ vs. Mesen−, ** p=0.008, Mesen+ vs. Muscle−, ** p=0.008, *** p<0.001, **** p<0.0001. Mean±SEM., Statistical analysis used two-sided Student’s t-test (d,f).

References

    1. Reya T, Morrison SJ, Clarke MF & Weissman IL Stem cells, cancer, and cancer stem cells. Nature 414, 105–111 (2001). - PubMed
    1. Miyamoto T, Weissman IL & Akashi K AML1/ETO-expressing nonleukemic stem cells in acute myelogenous leukemia with 8;21 chromosomal translocation. Proc Natl Acad Sci U S A 97, 7521–7526, doi:10.1073/pnas.97.13.7521 (2000). - DOI - PMC - PubMed
    1. Ginestier C et al. ALDH1 is a marker of normal and malignant human mammary stem cells and a predictor of poor clinical outcome. Cell Stem Cell 1, 555–567, doi:10.1016/j.stem.2007.08.014 (2007). - DOI - PMC - PubMed
    1. Merlos-Suarez A et al. The intestinal stem cell signature identifies colorectal cancer stem cells and predicts disease relapse. Cell Stem Cell 8, 511–524, doi:10.1016/j.stem.2011.02.020 (2011). - DOI - PubMed
    1. Quintana E et al. Efficient tumour formation by single human melanoma cells. Nature 456, 593–598 (2008). - PMC - PubMed

Publication types