. 2022 Aug 18;12(1):14112.
doi: 10.1038/s41598-022-18123-w.

Computational simulation of liver fibrosis dynamics

Affiliations

Computational simulation of liver fibrosis dynamics

Misa Yoshizawa et al. Sci Rep. .

Abstract

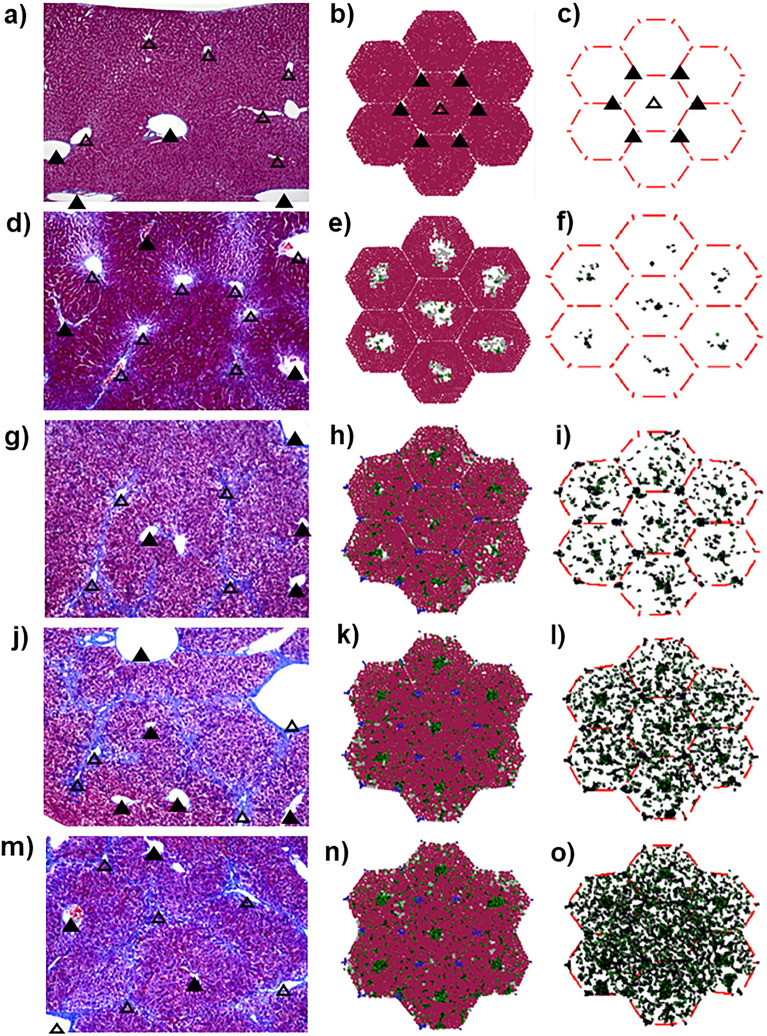
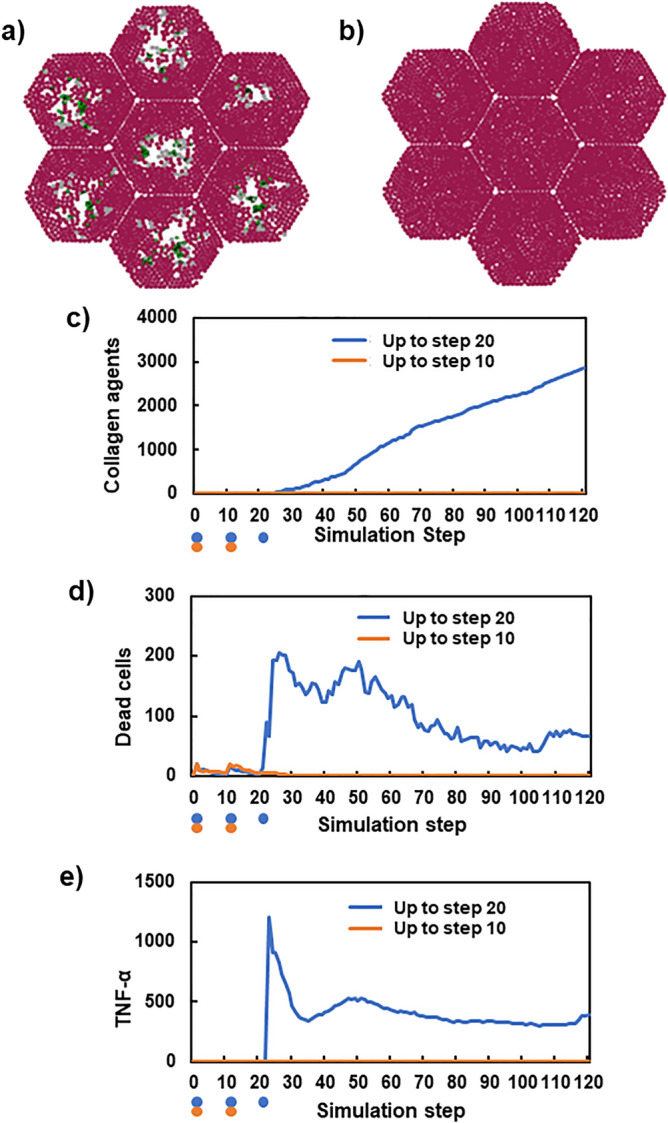
Liver fibrosis is a result of homeostasis breakdown caused by repetitive injury. The accumulation of collagens disrupts liver structure and function, which causes serious consequences such as cirrhosis. Various mathematical simulation models have been developed to understand these complex processes. We employed the agent-based modelling (ABM) approach and implemented inflammatory processes in central venous regions. Collagens were individually modelled and visualised depending on their origin: myofibroblast and portal fibroblast. Our simulation showed that the administration of toxic compounds induced accumulation of myofibroblast-derived collagens in central venous regions and portal fibroblast-derived collagens in portal areas. Subsequently, these collagens were bridged between central-central areas and spread all over areas. We confirmed the consistent dynamic behaviour of collagen formulation in our simulation and from histological sections obtained via in vivo experiments. Sensitivity analyses identified dead hepatocytes caused by inflammation and the ratio of residential liver cells functioned as a cornerstone for the initiation and progression of liver fibrosis. The validated mathematical model demonstrated here shows virtual experiments that are complementary to biological experiments, which contribute to understanding a new mechanism of liver fibrosis.


Conflict of interest statement

The authors declare no competing interests.

Figures

Figure 1
Figure 1
Concept of the developed model. (1) Hepatocytes exposed to toxic compounds (CCl4) become dead cells. (2) Kupffer cells are activated by the phagocytosis of dead cells and secrete TNF-α and TGF-β. Insufficient clearance of dead cells causes accumulation of HMGB1, which also activates Kupffer cells. (3) HSCs are transformed into myofibroblasts when the concentration of TNF-α exceeds the pre-defined threshold. (4) Myofibroblasts and portal fibroblasts secrete collagens when the concentration of TGF-β exceeds the pre-defined threshold. Here, two types of collagens were implemented separately depending on their origin.
Figure 2
Figure 2
Simulated time-courses of components of the developed model. The X-axis indicates the time step. Y-axes show the number of cells and molecules. Hepatocytes (a), dead cells (b), quiescent and activated Kupffer cells (c), TNF-α and TGF-β (d), HSCs and myofibroblasts (e), and myofibroblast- and portal fibroblast-derived collagens (f).
Figure 3
Figure 3
The time-dependent observations of liver lobules. Left panels: experimentally obtained 2-dimensional images of tissue sections (a, d, g, j, and m). Centre panels are computationally simulated results (b, e, h, k, and n). The right panels also show simulated results without hepatocytes (c, f, i, l, and o). The filled and open triangles indicate portal and central veins, respectively. In the simulation results, each agent is shown in different colours; hepatocytes (brown), dead cells (grey), and collagens secreted from myofibroblasts and portal fibroblasts (blue and green).
Figure 4
Figure 4
Relationship between the interval of toxic compound injection and the number of produced collagen agents. X and Y-axes indicate the time (step) and collagen amount, respectively (a). X and Y-axes indicate the interval and the number of collagen agents, respectively (b).
Figure 5
Figure 5
Comparison of the processes of fibrosis between two CCl4 injection conditions. Panels (a) and (b) show simulated liver lobules after 100 steps. CCl4 was injected thrice (a) and twice (b). Hepatocytes (brown), dead cells (grey), and collagens secreted from myofibroblasts and portal fibroblasts (blue and green). The initial conditions before simulation are depicted in Fig. S2. Time courses of the number of collagen agents (c), dead cells (d), and TNF-α (e). Orange and blue circles indicate the timing of CCl4 injections.
Figure 6
Figure 6
The comparison of simulated results with different initial KC cells. The 2-dimensional tissue sections at step 40 (ac). Hepatocytes (brown), dead cells (grey), and collagens secreted from myofibroblasts and portal fibroblasts (blue and green). The initial conditions before simulation are depicted in Fig. S2. Panel (d) shows the relationship between the initial number of KC and blank areas. Panel (e) shows the time-course of collagen agents with various initial KC ratios. Panels (f) and (g) show the relationship between initial KC ratios and collagen agents produced from myofibroblasts and portal fibroblasts, respectively.
Figure 7
Figure 7
Comparison of simulated results with different initial HC cells. The 2-dimensional tissue sections at 40 steps (ac). Hepatocytes (brown), dead cells (grey), and collagens secreted from myofibroblasts and portal fibroblasts (blue and green). The initial conditions before simulation are depicted in Fig. S2. Panel (d) shows the time-course of collagen agents with various initial HSC ratios. Panels (e) and (f) show the relationship between initial KC ratios and collagen agents produced from myofibroblasts and portal fibroblasts, respectively.

References

    1. Trefts E, Gannon M, Wasserman DH. The liver. Curr. Biol. 2017;27:R1147–R1151. doi: 10.1016/j.cub.2017.09.019. - DOI - PMC - PubMed
    1. Pellicoro A, Ramachandran P, Iredale JP, Fallowfield JA. Liver fibrosis and repair: Immune regulation of wound healing in a solid organ. Nat. Rev. Immunol. 2014;14:181–194. doi: 10.1038/nri3623. - DOI - PubMed
    1. Kisseleva T, Brenner D. Molecular and cellular mechanisms of liver fibrosis and its regression. Nat. Rev. Gastroenterol. Hepatol. 2021;18:151–166. doi: 10.1038/s41575-020-00372-7. - DOI - PubMed
    1. Roehlen N, Crouchet E, Baumert TF. Liver fibrosis: Mechanistic concepts and therapeutic perspectives. Cells. 2020;9:875. doi: 10.3390/cells9040875. - DOI - PMC - PubMed
    1. Hernandez-Gea V, Friedman SL. Pathogenesis of liver fibrosis. Annu. Rev. Pathol. 2011;6:425–456. doi: 10.1146/annurev-pathol-011110-130246. - DOI - PubMed

Publication types