. 2022 Aug 18;12(1):14087.
doi: 10.1038/s41598-022-18404-4.

STUB1 is an intracellular checkpoint for interferon gamma sensing

Affiliations

STUB1 is an intracellular checkpoint for interferon gamma sensing

Simon Ng et al. Sci Rep. .

Abstract

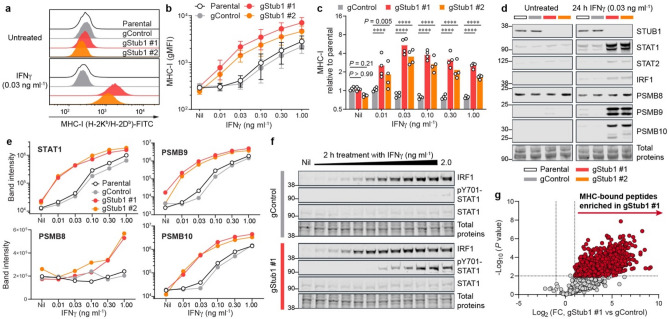
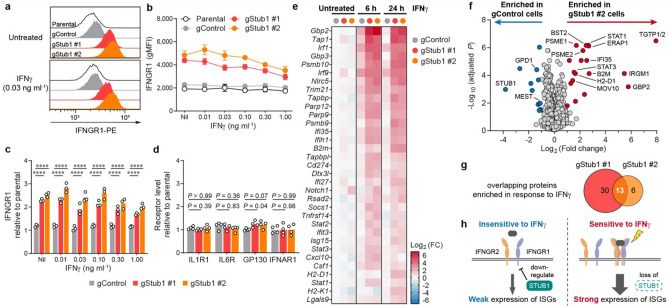
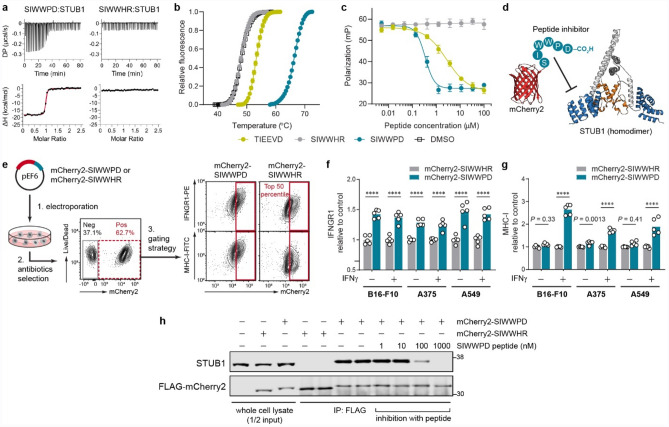
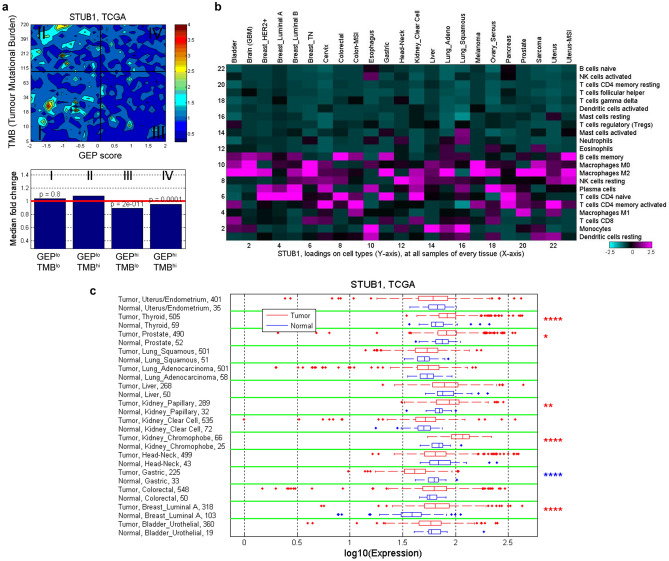
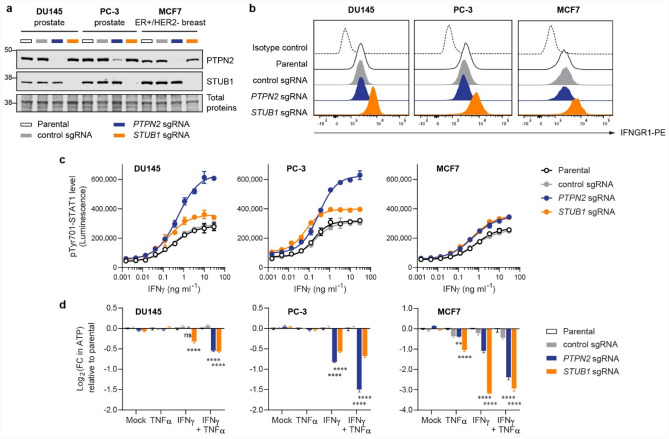
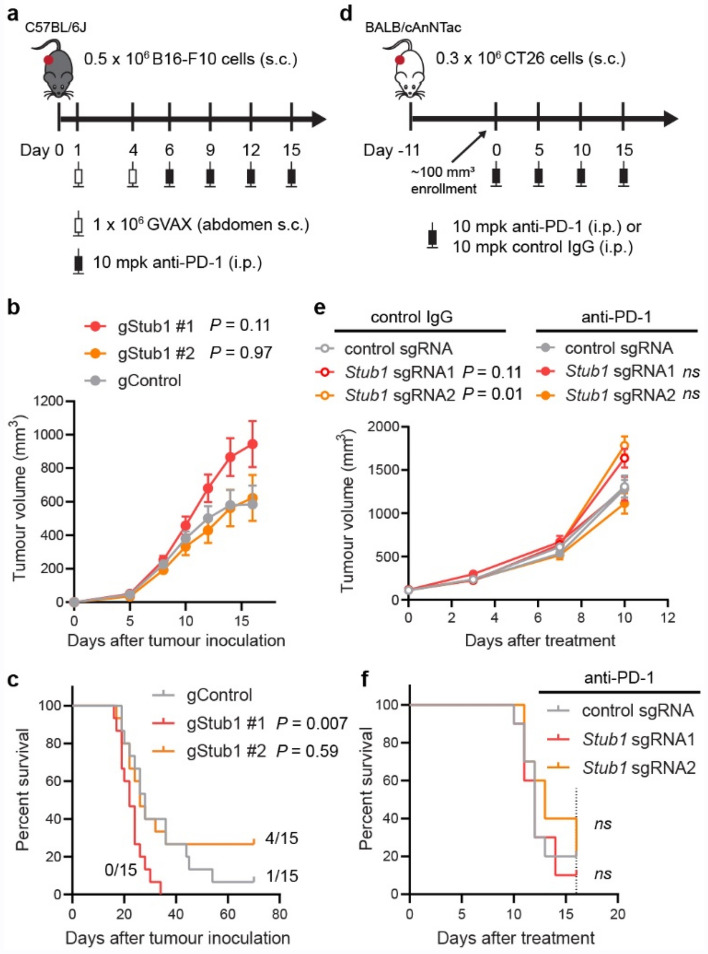
Immune checkpoint blockade (ICB) leads to durable and complete tumour regression in some patients but in others gives temporary, partial or no response. Accordingly, significant efforts are underway to identify tumour-intrinsic mechanisms underlying ICB resistance. Results from a published CRISPR screen in a mouse model suggested that targeting STUB1, an E3 ligase involved in protein homeostasis, may overcome ICB resistance but the molecular basis of this effect remains unclear. Herein, we report an under-appreciated role of STUB1 to dampen the interferon gamma (IFNγ) response. Genetic deletion of STUB1 increased IFNGR1 abundance on the cell surface and thus enhanced the downstream IFNγ response as showed by multiple approaches including Western blotting, flow cytometry, qPCR, phospho-STAT1 assay, immunopeptidomics, proteomics, and gene expression profiling. Human prostate and breast cancer cells with STUB1 deletion were also susceptible to cytokine-induced growth inhibition. Furthermore, blockade of STUB1 protein function recapitulated the STUB1-null phenotypes. Despite these encouraging in vitro data and positive implications from clinical datasets, we did not observe in vivo benefits of inactivating Stub1 in mouse syngeneic tumour models-with or without combination with anti-PD-1 therapy. However, our findings elucidate STUB1 as a barrier to IFNγ sensing, prompting further investigations to assess if broader inactivation of human STUB1 in both tumors and immune cells could overcome ICB resistance.


Conflict of interest statement

All authors are current or former employees of subsidiaries of Merck & Co., Inc., Kenilworth, NJ, USA.

Figures

Figure 1
Figure 1
Stub1 deletion enhances antigen processing and presentation by sensitizing tumour cells to IFNγ. (ac) Flow cytometry analysis of cell surface MHC-I on parental, control or independent Stub1-null B16-F10 cells. gMFI, geometric mean fluorescence intensity. (d, e) Western blot analysis of the expression level of STUB1, STAT1, STAT2, IRF1, PSMB8, PSMB9 and PSMB10 in parental, control or independent Stub1-null B16-F10 cells. Band intensity was normalized with total protein signal. The tumour cells were either untreated (Nil) or treated with IFNγ for 24 h (a–e). See Supplementary Fig. 1 for additional flow cytometry plots, Western blot data and analysis (a, d, e). (f) Western blot analysis of the expression level of IRF1, STAT1, and phosphorylation of Tyr701-STAT1 at 2 h post-treatment with IFNγ (twofold serial dilution from 2.0 ng ml−1). (g) Volcano plot showing differential presentation of MHC-associated peptide in gStub1 #1 versus gControl cells, following stimulation with 0.03 ng ml−1 IFNγ for 24 h. Red circles highlight peptides significantly enriched in gStub1 #1 cells (twofold cutoff, P ≤ 0.01; n = 3 biological replicates). FC, fold change. See Supplementary Fig. 2d for data of gStub1 #2 cells. Representative of four (a) or two (d–f) independent experiments. Data are mean ± s.d. (b) or mean with all data points (c) from four independent experiments. P values were determined by ordinary two-way ANOVA on Log2-transformed data with Dunnett’s multiple comparisons test, ****P ≤ 0.0001 (c).
Figure 2
Figure 2
Stub1 dampens IFNγ sensing by downregulating IFNGR1. (ac) Flow cytometry analysis of cell surface IFNGR1 on parental, control or independent Stub1-null B16-F10 cells which were either untreated (Nil) or treated with IFNγ for 24 h. See Supplementary Fig. 3a for additional plots. (d) Flow cytometry analysis of the surface level of other cytokine receptors on the tumour cells. See Supplementary Fig. 3b–c for the plots. (e) Heatmap showing genes (Supplementary Table S3) being upregulated by > twofold in both gStub1 #1 and #2 cells relative to untreated gControl cells. The cells were treated with 0.03 ng ml−1 IFNγ for 6 or 24 h. See Supplementary Fig. 4a for the full heatmap. FC, fold change. (f) Volcano plot showing differential protein expression in gStub1 #2 versus gControl cells, following stimulation with 0.03 ng ml−1 IFNγ for 24 h. Red or blue circles highlight proteins significantly enriched in gStub1 #2 or gControl cells respectively (twofold cutoff, adjusted P ≤ 0.05; n = 6 replicates per cell group, 3 biological replicates × 2 MS replicates). See Supplementary Fig. 4e for data of gStub1 #1 cell. (g) MS proteomics uncovered 13 proteins commonly enriched in both gStub1 #1 and #2 cells. The overlapping proteins are explicitly labeled in panel (f). (h) Proposed model whereby Stub1 is an intracellular checkpoint that curbs the tumour cells’ ability to sense and respond to IFNγ by downregulating IFNGR1. Representative of three independent experiments (a). Data are mean ± s.d. (b) or mean with all data points (c) from three independent experiments. Data are mean with all data points from four independent experiments (d). P values were determined by ordinary two-way ANOVA (c) or one-way ANOVA (d) on Log2-transformed data with Dunnett’s multiple comparisons test, ****P ≤ 0.0001.
Figure 3
Figure 3
Pharmacological inhibition of STUB1 with expressed biologic phenocopies the genetic knockout. (a, b) Validation of the binding of synthetic peptides to STUB1 (aa25–aa153) by isothermal titration calorimetry (a) and thermal shift assay (b). Representative of three independent experiments (a). Data are mean ± s.d. of six replicates derived from three independent experiments (b). (c) Competitive fluorescence polarization assay. Synthetic peptides were assessed for their ability to compete with 15 nM of tracer peptide (5-FAM-SSGPTIEEVD) for binding to 1 µM STUB1 (aa25–aa153). Data are mean ± s.d. of six replicates derived from two independent experiments. (d) Design of the inhibitory biologic by grafting the peptide (SIWWPD) to the C-terminus of an mCherry2 (red) scaffold. The fused peptide blocks the function of the tetratricopeptide repeat domain (blue) of STUB1 (PDB code 2C2L) and inhibits its substrate binding. U-box domain (orange) which recruits the E2 ubiquitin-conjugating enzyme is not affected. (e) Generation of tumour cell lines stably expressing the biologic or its control. Plasmid encoding the biologic was electroporated into tumour cells, followed by antibiotics selection of the stable clones. The mCherry2-positive cells (red dotted box) were further gated for mCherry2hi population (top 50th percentile, red box). Gating example represents IFNγ-treated B16-F10 stable cell lines. (f, g) Flow cytometry analysis of the relative cell surface level of IFNGR1 (f) and MHC-I (g) expressed by the mCherry2hi population in B16-F10, A375 or A549 cells. The cells were either untreated or treated with mouse IFNγ (0.03 ng ml−1) or human IFNγ (0.01 ng ml−1) for 24 h. The expression levels were normalized to the average value of the control (mCherry2-SIWWHR). n = 5 biological replicates from two independent experiments (f–g). Bars are mean with all data points (f–g). P values were determined by ordinary two-way ANOVA in each cell type with Sidak’s multiple comparisons test, ****P ≤ 0.0001 (f–g). (h) Co-immunoprecipitation (co-IP) of FLAG-mCherry2-peptide and STUB1 from the cellular lysate of B16-F10 using anti-FLAG antibody. Synthetic peptide (SIWWPD) was added into the co-IP mixture to assess specificity of the interaction. Blot is representative of three independent experiments.
Figure 4
Figure 4
Correlation and expression of STUB1 gene in TCGA dataset. (a) Contour plot illustrates the association of STUB1 with TMB and GEP. Blue and red represent under- and overexpression, respectively. TMB cut-off was set at 100 and GEP cut-off corresponds to 55th percentile value for pan-cancer cohort. (b) In-silico deconvolution analysis of bulk RNAseq data from TCGA was used to establish the association between STUB1 expression and different cell types. Deconvolution analysis was performed separately for each tumor type. (c) Expression of STUB1 in tumor tissue and adjacent normal tissue is compared across tumor types for which both tumor and adjacent normal samples are available in TCGA dataset. The significance of the difference is indicated with *P ≤ 0.05, **P ≤ 0.01, and ****P ≤ 0.0001.
Figure 5
Figure 5
Inactivation of STUB1 or PTPN2 sensitized human tumour cells to growth inhibition induced by cytokines. (a) Western blot analysis of the expression level of PTPN2 and STUB1 in tumour cells. (b) Flow cytometry plot showing the surface expression level of IFNGR1 in tumour cells. In parallel, parental cells were stained with PE-conjugated isotype control antibody to demonstrate low level of non-specific binding. (c) Level of phosphorylated Tyr701-STAT1 after 30-min response to varying doses of IFNγ as measured by Lumit immunoassay. (d) Fold change (FC) in ATP level relative to the parental cells as a quantification of viable cells. Measurements were performed using CellTiter-Glo 2.0 assay after 6-day treatment with the cytokines (10 ng ml−1 each). Data are mean ± s.d. from two biological replicates (c) or mean ± s.e.m. from three biological replicates (d). P values were determined by ordinary two-way ANOVA on Log2-transformed data with Dunnett’s multiple comparisons test versus parental cells, **P ≤ 0.01, ****P ≤ 0.0001, ns P > 0.90 (d). Representative of two independent experiments (a–d).
Figure 6
Figure 6
The effect of Stub1 deletion in mouse syngeneic tumour models. (a) Study design for C57BL mice implanted with CRISPR-edited B16-F10 clonal cells. s.c., subcutaneous. i.p., intraperitoneal. mpk, milligram per kilogram. (b) Plot showing tumour volume of the implanted CRISPR-edited B16-F10 clonal cells. Data are mean ± s.e.m., n = 15 mice per group. See Supplementary Fig. 9b–d for individual tumour volume across 70 days. (c) Kaplan–Meier survival curves of tumour-bearing mice. Median survival: gControl, 28 days; gStub1 #1, 22 days; gStub1 #2, 26 days. Either 1 or 4 out of 15 mice bearing gControl or gStub1 #2 tumour cells respectively were still alive at day 70. (d) Study design for BALB mice implanted with CRISPR-edited CT26 cells. See Supplementary Fig. 10 for full characterization of the cells. (e) Plot showing tumour volume of the implanted CRISPR-edited CT26 cells. Data are mean ± s.e.m. See Supplementary Fig. 9f.–h and 8j–l for individual tumour volume across 16 days. (f) Kaplan–Meier survival curves of tumour-bearing mice treated with anti-PD-1 antibody. Median survival: control sgRNA, 12 days; Stub1 sgRNA1, 12 days; Stub1 sgRNA2, 13 days. The study was terminated at day 16 (dotted line). See Supplementary Fig. 9i for the survival curves of mice treated with control antibody. n = 10 mice per group (e, f). P values were determined by ordinary one-way ANOVA on day 16 data (b) or two-way ANOVA on day 10 data (e) versus control tumours with Sidak’s multiple comparisons test, ns P ≥ 0.50. P values were determined by Log-rank (Mantel-Cox) test versus control tumours (c, f), ns P ≥ 0.50.

References

    1. Dighe AS, Richards E, Old LJ, Schreiber RD. Enhanced in vivo growth and resistance to rejection of tumor cells expressing dominant negative IFNγ receptors. Immunity. 1994;1:447–456. doi: 10.1016/1074-7613(94)90087-6. - DOI - PubMed
    1. Kaplan DH, et al. Demonstration of an interferon γ-dependent tumor surveillance system in immunocompetent mice. Proc. Natl. Acad. Sci. USA. 1998;95:7556–7561. doi: 10.1073/pnas.95.13.7556. - DOI - PMC - PubMed
    1. Shankaran V, et al. IFNγ and lymphocytes prevent primary tumour development and shape tumour immunogenicity. Nature. 2001;410:1107–1111. doi: 10.1038/35074122. - DOI - PubMed
    1. Gao J, et al. Loss of IFN-γ pathway genes in tumor cells as a mechanism of resistance to Anti-CTLA-4 therapy. Cell. 2016;167:397–404.e399. doi: 10.1016/j.cell.2016.08.069. - DOI - PMC - PubMed
    1. Zaretsky JM, et al. Mutations associated with acquired resistance to PD-1 Blockade in melanoma. New Engl. J. Med. 2016;375:819–829. doi: 10.1056/NEJMoa1604958. - DOI - PMC - PubMed

Publication types