. 2022 Aug 18;5(1):830.
doi: 10.1038/s42003-022-03802-1.

Ecological analysis of Pavlovian fear conditioning in rats

Affiliations

Ecological analysis of Pavlovian fear conditioning in rats

Peter R Zambetti et al. Commun Biol. .

Abstract

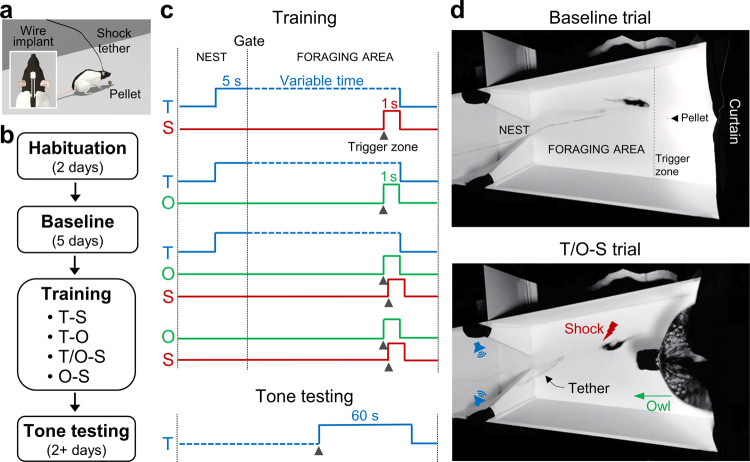
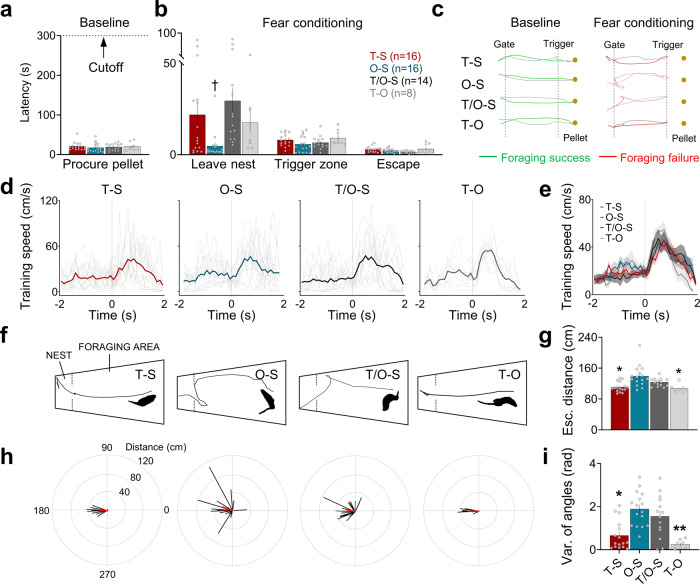
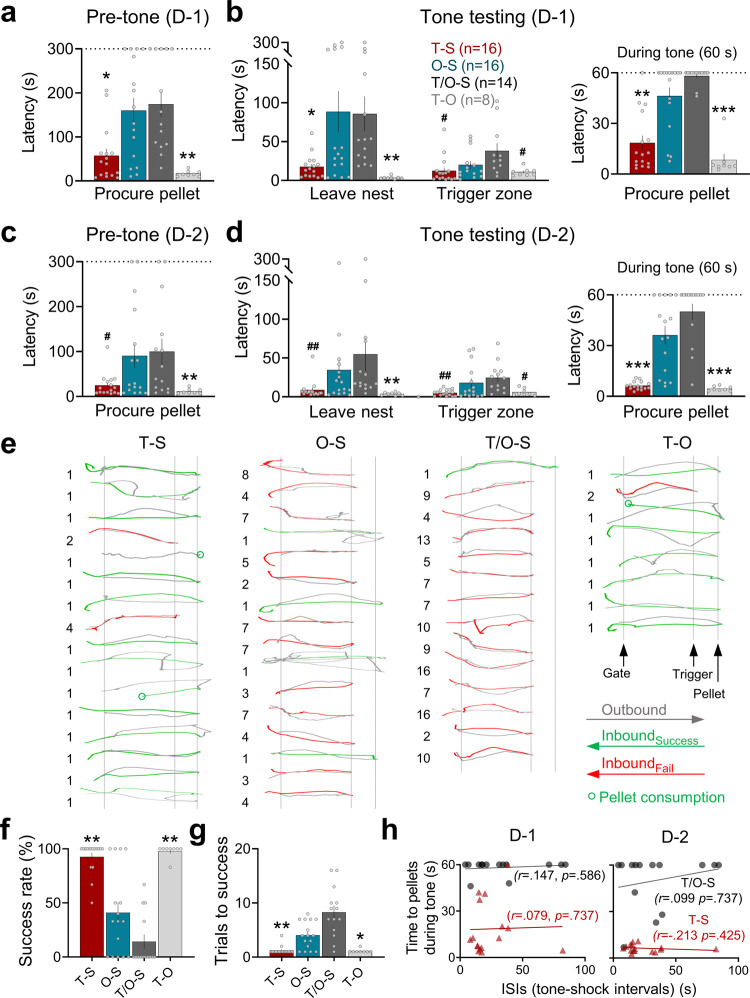
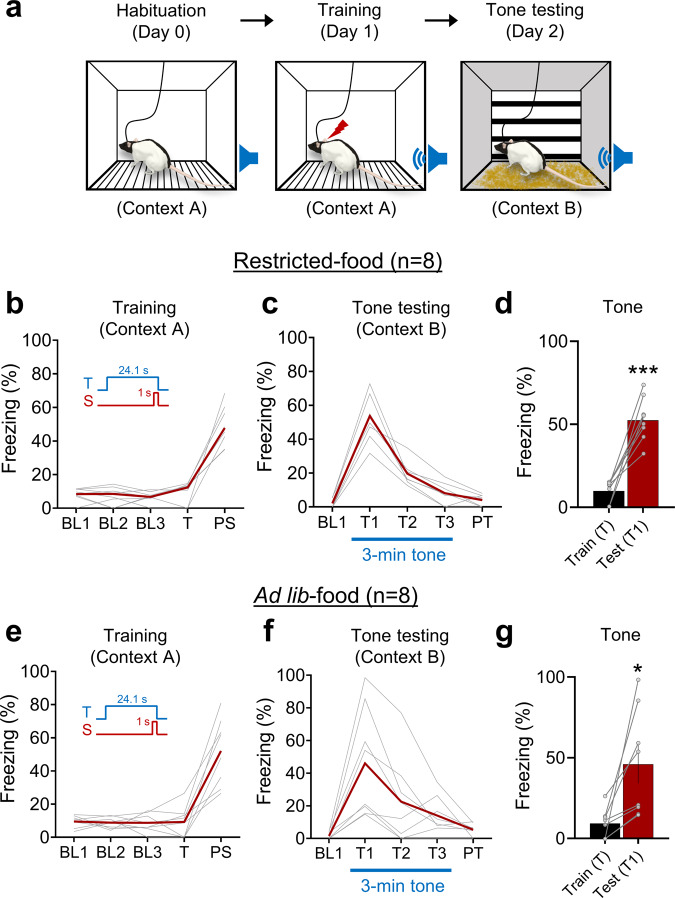
Pavlovian fear conditioning, which offers the advantage of simplicity in both the control of conditional and unconditional stimuli (CS, US) presentation and the analysis of specific conditional and unconditional responses (CR, UR) in a controlled laboratory setting, has been the standard model in basic and translational fear research. Despite 100 years of experiments, the utility of fear conditioning has not been trans-situationally validated in real-life contexts. We thus investigated whether fear conditioning readily occurs and guides the animal's future behavior in an ecologically-relevant environment. To do so, Long-Evans rats foraging for food in an open arena were presented with a tone CS paired with electric shock US to their dorsal neck/body that instinctively elicited escape UR to the safe nest. On subsequent test days, the tone-shock paired animals failed to exhibit fear CR to the CS. In contrast, animals that encountered a realistic agent of danger (a looming artificial owl) paired with a shock, simulating a plausible predatory strike, instantly fled to the nest when presented with a tone for the first time. These results highlight the possibility of a nonassociative, rather than standard associative, fear process providing survival function in life-threatening situations that animals are likely to encounter in nature.


Conflict of interest statement

The authors declare no competing interests.

Figures

Fig. 1
Fig. 1. Experimental design of fear conditioning in a naturalistic setting.
a An illustration of a tethered rat foraging for a food pellet in the open arena (inset shows a headstage and placement of subcutaneous shock wires). b Timeline of experiment. Habituation: Rats were placed in a closed nest with dispersed food pellets for 30 min/day. Baseline: Rats were allowed to leave the nest to discover food pellets placed 25–125 cm (in 25 cm increments from the nest) in the foraging arena. Training: Animals approaching the pellet location experienced a delayed pairing of tone-shock (T-S), tone-owl (T-O), tone/owl-shock (T/O-S), or owl-shock (O-S). Tone Test: On subsequent days, all rats were placed back in the foraging arena and upon nearing the food pellet, the tone was activated. c Schemas of delayed pairings of stimuli. The T-S, T-O, and T/O-S (but not O-S) groups were presented with a tone 5 s before the gate opening that stayed on until the animals were within 25 cm of the food pellet, at which the tone co-terminated with the triggered shock (1 s), owl (1 s,) or owl-shock (100 ms interstimulus interval, ISI) stimuli. d A representative rat in the foraging arena (208 cm length × 66–120 cm expanding width × 61 cm height) during a baseline trial, where the animal successfully acquires the pellet, and during a T/O-S trial, where the animal flees from looming owl and shock into the nest (69 cm length × 58–66 cm width × 61 cm height).
Fig. 2
Fig. 2. Foraging and escape behaviors during fear conditioning.
a Pre-conditioning baseline latencies (mean ± SEM) to procure food pellets in the foraging arena were equivalent between T-S (red), O-S (blue), T/O-S (dark gray), and T-O (light gray) groups (Kruskal–Wallis, H = 2.694, p = 0.441). b During fear conditioning, the T-S, T/O-S, and T-O groups exposed to the tone 5 s before the gate opening had significantly longer latencies to leave the nest than the O-S group (left panel, Kruskal–Wallis, H = 18.6, p < 0.001; pairwise comparisons, p = 0.008 for T-S vs. O-S, p = 0.011 for O-S vs. T-O, p < 0.001 for O-S vs. T/O-S, p = 0.69 for T-S vs. T-O, p = 0.631 for T-S vs. T/O-S, p = 0.343 for T/O-S vs. T-O). Once outside the nest, however, the latency to breach the trigger zone, enroute to the pellet, was not reliably different among the groups (Kruskal–Wallis, H = 7.453, p = 0.059). In response to the triggered shock, owl or owl-shock, all groups showed similar escape-to-nest latencies (Kruskal–Wallis, H = 6.141, p = 0.105). c Representative track plot examples from T-S, O-S, T/O-S, and T-O animals during the baseline, when animals successfully procured the pellet, and during the fear conditioning, when the same animals fled from shock, owl or owl-shock stimuli and thus unable to attain the pellet. d Mean instantaneous speed (±SEM) of each group 2 s before and after the shock, owl or owl-shock onset (t = 0). Thin, gray lines represent individual animal data. e All groups showed comparable escape speed to the shock, owl, and owl-shock stimuli (Kruskal–Wallis, H = 0.901, p = 0.825). f Representative track plots showing escape paths of T-S, O-S, T/O-S, and T-O animals. The inset silhouette images show that the T-S and T-O animals were facing forward at the time of the shock or owl stimulus whereas the O-S and T/O-S animals were turning back at the time of the shock stimulus because of the 100 ms owl-shock interstimulus interval. g Mean escape distance (±SEM) from the trigger zone to the nest. The O-S and T/O-S groups traveled longer distances to escape compared to the T-S and T-O groups (Kruskal–Wallis, H = 21.98, p < 0.001; pairwise comparisons, p = 0.014 for T-S vs. T/O-S, p = 0.008 for T/O-S vs T-O, p = 0.001 for T-S vs. O-S, p = 0.001 for O-S vs T-O). h Representative vector plots of each group showing variabilities in their escape paths. i Mean variance (±SEM) of escape trajectory angles (radian) from the trigger zone to the nest. The O-S and T/O-S groups had greater variance in their escape trajectories when fleeing back to the nest (Kruskal–Wallis, H = 22.37, p < 0.001; pairwise comparisons, p = 0.022 for T-S vs. T/O-S, p = 0.003 for T/O-S vs T-O, p = 0.002 for T-S vs. O-S, p < 0.001 for O-S vs T-O) († compared to T-S, T/O-S, and T-O; * compared to O-S and T/O-S, p < 0.05, **p < 0.01, ***p < 0.001; # compared to T/O-S, p < 0.05, ##p < 0.01).
Fig. 3
Fig. 3. Foraging and escape behaviors during tone testing.
a The mean latency (±SEM) to procure the pellet during the pre-tone baseline trials on testing day 1 (D-1). Both O-S and T/O-S groups took significantly longer times to exit (gate opening, t = 0) and return to the nest with the pellet than T-S and T-O groups (Kruskal–Wallis, H = 20.518, p < 0.001; pairwise comparisons, P = 0.003 for T-S vs. T/O-S, p < 0.001 for T/O-S vs. T-O, p = 0.013 for T-S vs. O-S, p < 0.001 for O-S vs. T-O). b The times (mean ± SEM) to leave nest and reach trigger zone on day 1 tone test trials. Both O-S and T/O-S groups had longer latencies to leave nest (Kruskal–Wallis, H = 27.071, p < 0.001; pairwise comparisons, p = 0.003 for T-S vs. T/O-S, p < 0.001 for T/O-S vs. T-O, p = 0.044 for T-S vs. O-S, p < 0.001 for O-S vs. T-O. Once outside the nest, the T/O-S group took longer time to reach the trigger zone than the T-S and T-O (Kruskal–Wallis, H = 9.153, p = 0.027; pairwise comparisons, p = 0.019 for T-S vs. T/O-S, p = 0.042 for T/O-S vs. T-O). During the tone test, the latencies to procure the pellet within the 60 s allotted time were significantly longer in O-S and T/O-S animals compared to T-S and T-O animals (Kruskal–Wallis, H = 34.428, p < 0.001; pairwise comparisons, p < 0.001 for T-S vs. T/O-S, p < 0.001 for T/O-S vs. T-O, p = 0.002 for T-S vs. O-S, p < 0.001 for O-S vs. T-O). c The mean latency (±SEM) to procure the pellet during the pre-tone baseline trials on testing day 2 (D-2). O-S and T/O-S groups continued to have longer latencies to exit (gate opening, t = 0) and return to the nest with the pellet than T-S and T-O groups (Kruskal–Wallis, H = 12.47, p = 0.006; pairwise comparisons, p = 0.022 for T-S vs. T/O-S, p = 0.002 for T/O-S vs. T-O, P = 0.009 for O-S vs. T-O). d The times (mean ± SEM) to leave nest and reach trigger zone on day 2 tone test trials. There were group differences in the latencies to leave nest (Kruskal–Wallis, H = 21.505, p < 0.001; pairwise comparisons, p = 0.001 for T-S vs. T/O-S, p < 0.001 for T/O-S vs. T-O, p = 0.002 for O-S vs. T-O). Once outside the nest, there were group differences in the latencies to reach the trigger zone (Kruskal–Wallis, H = 21.531, p < 0.001; pairwise comparisons, p < 0.001 for T-S vs. T/O-S, p < 0.001 for T/O-S vs. T-O, p = 0.037 for O-S vs. T-O). During the tone test, the latencies to procure the pellet within the 60 s allotted time were significantly longer in O-S and T/O-S animals compared to T-S and T-O animals (Kruskal–Wallis, H = 37.223, p < 0.001; pairwise comparisons, p < 0.001 for T-S vs. T/O-S, p < 0.001 for T/O-S vs. T-O, p < 0.001 for T-S vs. O-S, p < 0.001 for O-S vs. T-O). e Individual track plots from all animals from each group displaying the XY trajectory coordinates each rat took during the first tone exposure. The parenthesized numbers next to plots represent the trial(s) needed for successful foraging. f The overall success rates of procuring the pellet on the first testing day were significantly lower in the O-S and T/O-S groups compared to the T-S and T-O groups (Kruskal–Wallis, H = 32.299, p < 0.001; pairwise comparisons, p < 0.001 for T-S vs. T/O-S, p < 0.001 for T/O-S vs. T-O, p = 0.001 for T-S vs. O-S, p = 0.003 for O-S vs. T-O). g The O-S and T/O-S animals required extended trials to obtain the pellet (Kruskal–Wallis, H =  = 32.004, p < 0.001; pairwise comparisons, p < 0.001 for T-S vs. T/O-S, p < 0.001 for T/O-S vs. T-O, p = 0.002 for T-S vs. O-S, p = 0.011 for O-S vs. T-O). h In T-S and T/O-S animals, there were no reliable correlations (Spearman’s correlation coefficient) between the tone-induced suppression of pellet procurement (an index of fear) and the temporal intervals (i.e., ISIs) between tone CS onset and shock US onset in neither testing day 1 nor 2 (* compared to both O-S and T/O-S, p < 0.05, **p < 0.01, ***p < 0.001; # compared to T/O-S, p < 0.05, p < 0.01).
Fig. 4
Fig. 4. Auditory fear conditioning in a standard experimental chamber.
a Illustrations of a rat implanted with wires subcutaneously in the dorsal neck/body region undergoing successive days of habituation (10 min tethered, conditioning chamber), training (a single tone CS-shock US pairing), and tone testing (context shift). (restricted-food) b Mean (crimson line) and individual (gray lines) percent freezing data from 8 rats (4 females, 4 males) during training in context A: 3 min baseline (BL1, BL2, BL3); 23.1 s epoch of tone (T); 1 min postshock (PS). c Mean and individual percent freezing data during tone testing in context B: 1 min baseline (BL1); 3 min tone (T1, T2, T3); 1 min post-tone (PT). d Mean ± SEM (bar) and individual (dots) percent freezing to tone CS before (Train, T) and after (Test, T1) undergoing auditory fear conditioning (paired t test; t(7) = −7.319, p < 0.001). (ad lib-food) e Mean (crimson line) and individual (gray lines) percent freezing data from 8 rats (4 females, 4 males) during training in context A: 3 min baseline (BL1, BL2, BL3); 23.1 s epoch of tone (T); 1 min postshock (PS). f Mean and individual percent freezing data during tone testing in context B: 1 min baseline (BL1); 3 min tone (T1, T2, T3); 1 min post-tone (PT). g Mean ± SEM (bar) and individual (dots) percent freezing to tone CS before (Train, T) and after (Test, T1) undergoing auditory fear conditioning (paired t test; t(7) = −3.188, p = 0.015). *p < 0.05, ***p < 0.001.

Similar articles

Cited by

References

    1. Watson JB, Morgan JJB. Emotional reactions and psychological experimentation. Am. J. Psychol. 1917;28:163–174. doi: 10.2307/1413718. - DOI - PubMed
    1. Watson JB, Rayner R. Conditioned emotional reactions. J. Exp. Psychol. 1920;3:1–14. doi: 10.1037/h0069608. - DOI - PubMed
    1. LeDoux J. Fear and the brain: where have we been, and where are we going. Biol. Psychiatry. 1998;44:1229–1238. doi: 10.1016/S0006-3223(98)00282-0. - DOI - PubMed
    1. Fendt M, Fanselow MS. The neuroanatomical and neurochemical basis of conditioned fear. Neurosci. Biobehav. Rev. 1999;23:743–760. doi: 10.1016/S0149-7634(99)00016-0. - DOI - PubMed
    1. Maren S, Quirk GJ. Neuronal signalling of fear memory. Nat. Rev. Neurosci. 2004;5:844–852. doi: 10.1038/nrn1535. - DOI - PubMed

Publication types