. 2022 Aug;54(8):1188-1200.
doi: 10.1038/s12276-022-00830-z. Epub 2022 Aug 18.

Inhibiting peripheral and central MAO-B ameliorates joint inflammation and cognitive impairment in rheumatoid arthritis

Affiliations

Inhibiting peripheral and central MAO-B ameliorates joint inflammation and cognitive impairment in rheumatoid arthritis

Woojin Won et al. Exp Mol Med. 2022 Aug.

Abstract

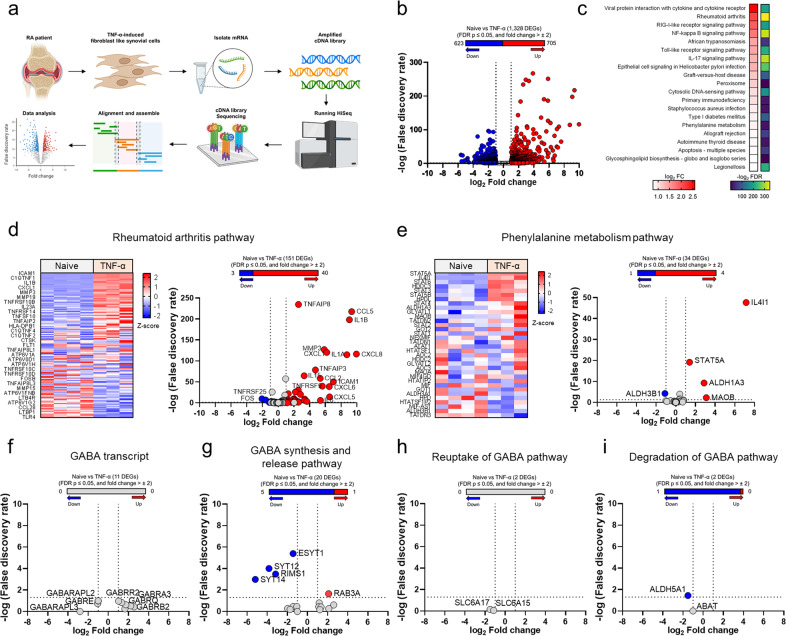
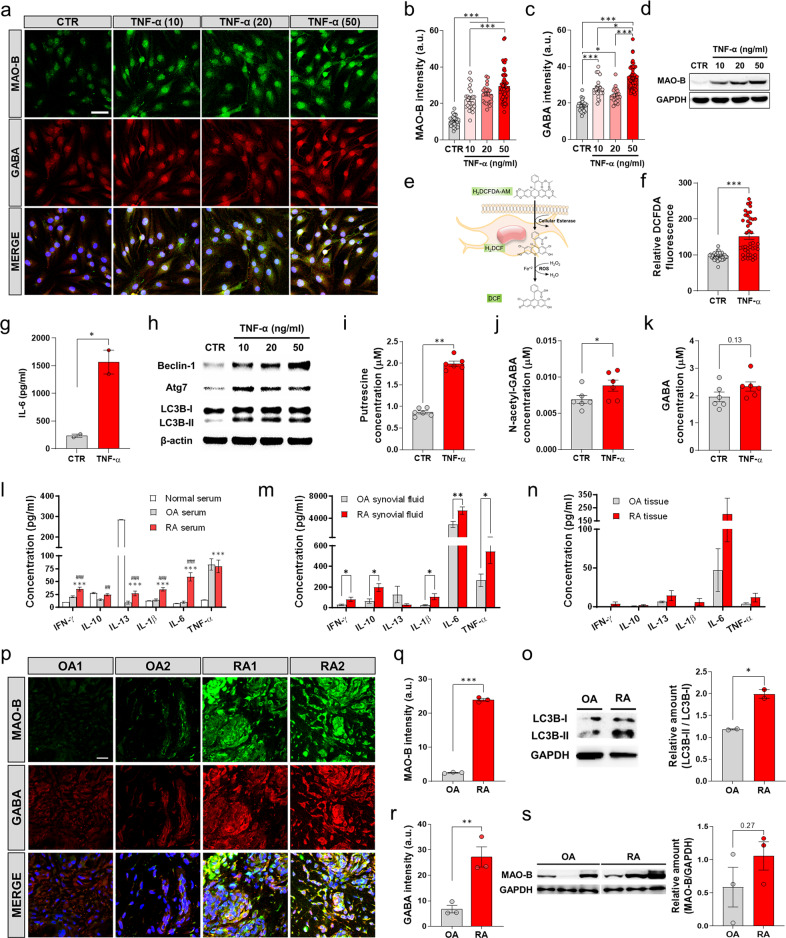
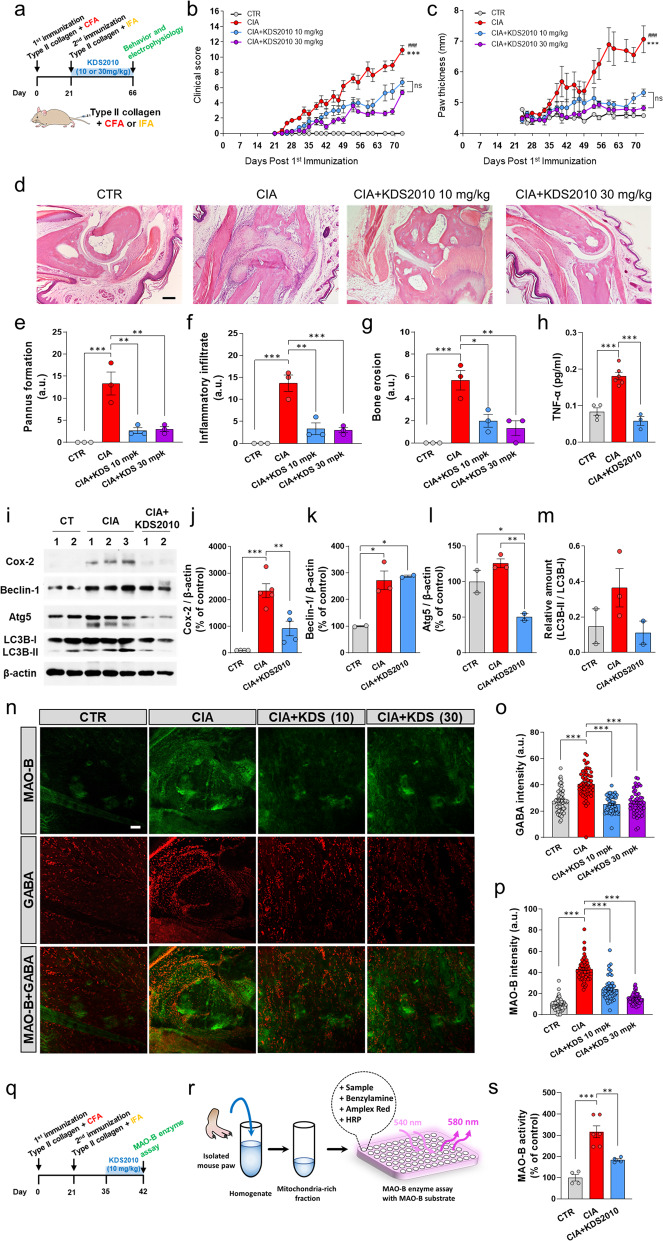
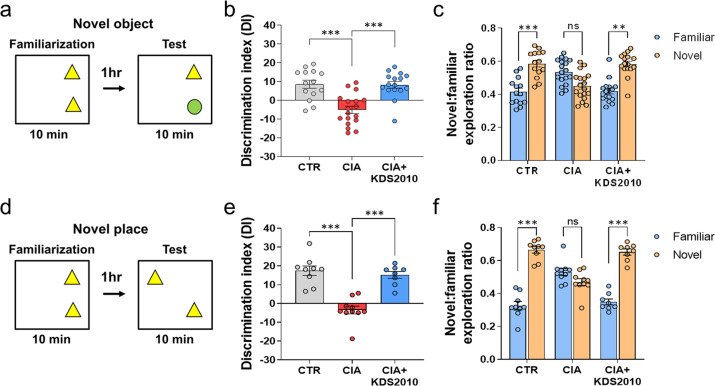
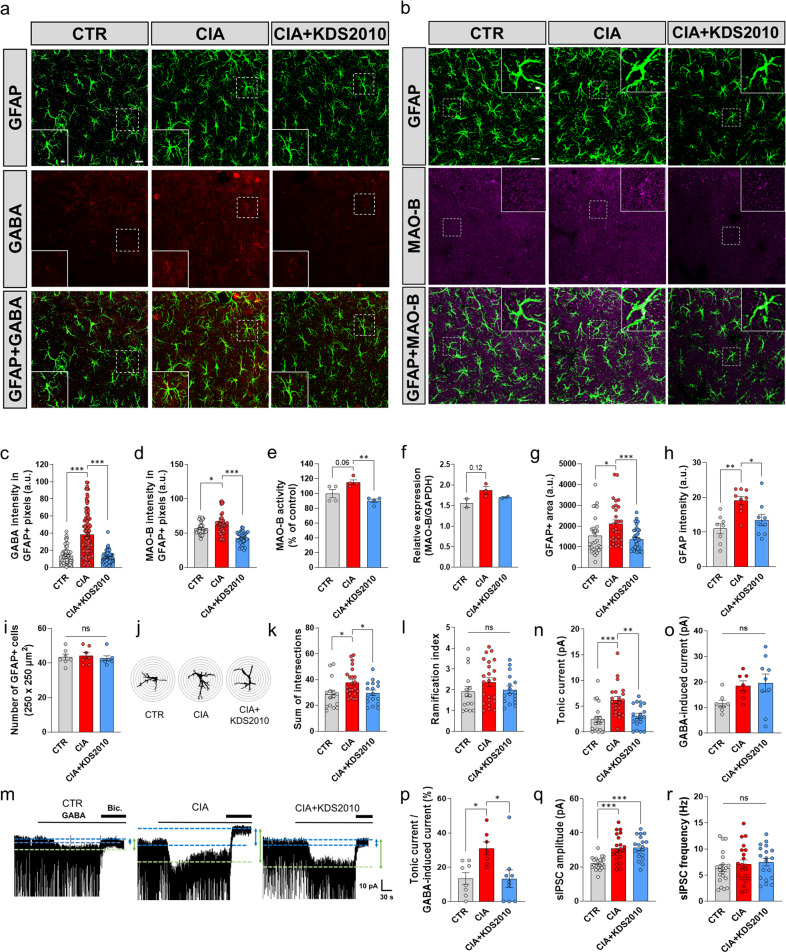
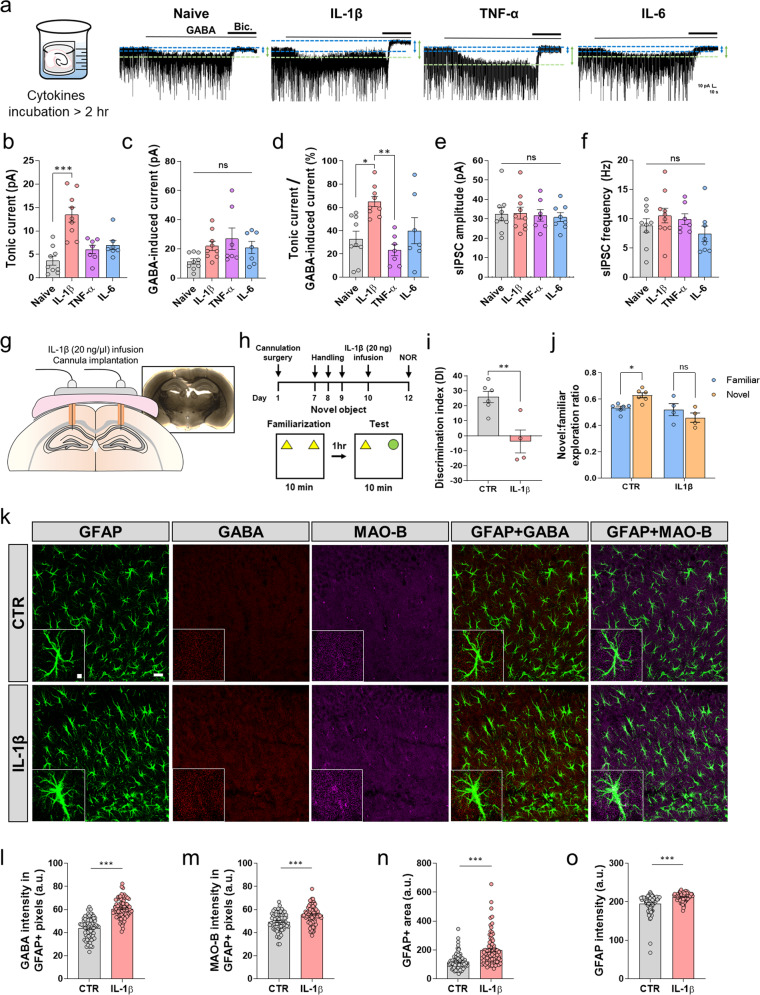
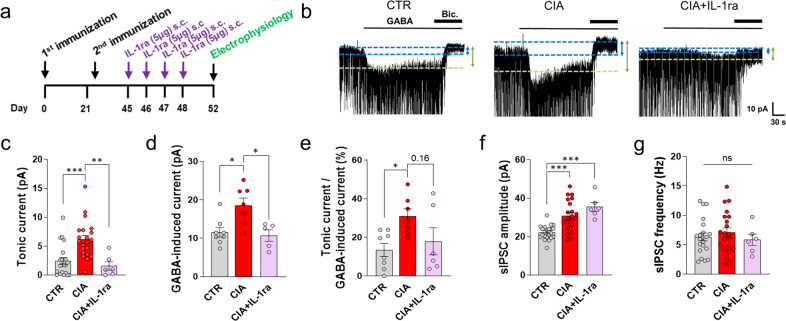
Rheumatoid arthritis (RA) is an autoimmune disorder characterized by chronic inflammation and the destruction of joints and systemic organs. RA is commonly accompanied by neuropsychiatric complications, such as cognitive impairment and depression. However, the role of monoamine oxidase (MAO) and its inhibitors in controlling neurotransmitters associated with these complications in RA have not been clearly identified. Here, we report that peripheral and central MAO-B are highly associated with joint inflammation and cognitive impairment in RA, respectively. Ribonucleic acid (RNA) sequencing and protein expression quantification were used to show that MAO-B and related molecules, such as gamma aminobutyric acid (GABA), were elevated in the inflamed synovium of RA patients. In primary cultured fibroblast-like synoviocytes in the RA synovium, MAO-B expression was significantly increased by tumor necrosis factor (TNF)-α-induced autophagy, which produces putrescine, the polyamine substrate for GABA synthesis. We also observed that MAO-B-mediated aberrant astrocytic production of GABA was augmented by interleukin (IL)-1β and inhibited CA1-hippocampal pyramidal neurons, which are responsible for memory storage, in an animal model of RA. Moreover, a newly developed reversible inhibitor of MAO-B ameliorated joint inflammation by inhibiting cyclooxygenase (Cox)-2. Therefore, MAO-B can be an effective therapeutic target for joint inflammation and cognitive impairment in patients with RA.


Conflict of interest statement

The authors declare no competing interests, but W.W., K.D.P., S.Y.J., and C.J.L. applied for a patent in the Republic of Korea on the composition for the prevention or treatment of rheumatoid (KR-10-2020-0120924) and competing interests for the commercial development of KDS2010.

Figures

Fig. 1
Fig. 1. RNA profiling of TNF-α-stimulated fibroblast-like synoviocytes (FLSs).
a Schematic showing the experimental design for bulk RNA-seq. b RNA-seq detected 1328 DEGs between naive (n = 4, biologically independent) and TNF-α-induced FLSs (n = 3, biologically independent). c Top 20 pathways altered in FLSs, which were identified by Partek flow pathway analysis. The log2 fold change and –log2 FDR are shown. d Heatmap (left) and volcano plot (right) of the genes listed in the rheumatoid arthritis pathway. e Heatmap (left) and volcano plot (right) of the genes listed in the phenylalanine metabolism pathway. fi Volcano plot of the genes listed in GABA-related transcripts. The red circle in the graph indicates significant upregulation; the blue circle indicates significant downregulation; FDR ≤ 0.05, and fold change >± 2.
Fig. 2
Fig. 2. MAO-B and GABA are aberrantly expressed in RA.
a Representative confocal images of concentration-dependent changes in MAO-B and GABA in response to TNF-α in FLSs (n = 3 for each group; scale bar, 50 µm). b, c Quantification of MAO-B and GABA intensity in FLSs (one-way ANOVA, Tukey’s multiple comparisons test). d Western blot showing MAO-B in FLSs. e, f Schematic image of the DCFDA assay and quantification of H2O2 in naive and TNF-α-stimulated FLSs (two-tailed unpaired t test, n = 43 for each group). g Quantification of IL-6 expression in naive and TNF-α-stimulated FLSs. h Western blot showing activated autophagy markers in TNF-α-activated FLSs. ik Metabolite quantification in control and TNF-α-stimulated FLSs (one-way ANOVA, Tukey’s multiple comparisons test). l Quantification of IFN-γ, IL-10, IL-13, IL-1β, IL-6, and TNF-α in the serum of normal, OA, and RA patients (one-way ANOVA with Tukey’s multiple comparisons test, n = 20, 16, and 16). m Quantification of IFN-γ, IL-10, IL-13, IL-1β, IL-6, and TNF-α in the synovial fluid of OA and RA patients (two-tailed unpaired t test, n = 16 for each group). n Quantification of IFN-γ, IL-10, IL-13, IL-1β, IL-6, and TNF-α in the joint tissue of OA and RA patients (two-tailed unpaired t test, n = 16 for each group). o Western blot showing activated autophagy markers in the joint samples of OA and RA patients p Representative confocal images showing synovial MAO-B and GABA in OA and RA samples (N = 3 for each group; scale bar, 20 µm). q, r Quantification of synovial MAO-B and GABA (two-tailed unpaired t test). s Representative Western blot showing MAO-B and GAPDH and the quantification of synovial MAO-B expression (two-tailed unpaired t test). Error bars in the graphs indicate the SEM. *P < 0.05; **P < 0.01; ***P < 0.001. Statistical details are provided in Supplementary Table 1.
Fig. 3
Fig. 3. CIA mice show MAO-B-dependent joint inflammation.
a Schematic timeline of the experiments with CIA mice and KDS2010. b, c Comparison of arthritis severity clinical scores and paw thickness between control, CIA, and CIA + KD2010 (10 and 30 mg/kg/day) mice (N = 2, 7, 5, and 4; two-way ANOVA, Tukey’s multiple comparisons test). A higher score indicates more severe arthritis, and 16 was the highest score. ‘*’ indicates CIA vs. CIA + KDS2010 (10 mg/kg/day) and ‘#’ indicates CIA vs. CIA + KDS2010 (30 mg/kg/day). d Representative H&E-stained sections of control, CIA, and CIA + KDS2010 (10 and 30 mg/kg/day) samples (N = 3 for each group; scale bar, 200 µm). eg Quantification of pannus formation, inflammatory infiltration, and bone erosion based on histological analysis (one-way ANOVA, Tukey’s multiple comparisons test, N = 3 for each group). h Quantification of TNF-α in the lysates of paw tissues. im Western blot showing activated markers in the lysates of paw tissues from control, CIA, and CIA + KDS2010 mice. n Representative confocal images showing synovial MAO-B and GABA in control, CIA, CIA + KDS2010 (10 and 30 mg/kg/day) mice (N = 2 for each group; Sale bar, 20 µm). o, p Quantification of MAO-B and GABA in the synovium of the RA mouse model. q, r Timeline and schematic image of the MAO-B enzyme analysis of the lysate of paw tissues. s MAO-B enzyme analysis of the lysates of paw tissues from control, CIA, CIA + KDS2010 mice (N = 2, 3, and 2; one-way ANOVA, Tukey’s multiple comparison test). Error bars in the graphs indicate the SEM. *P < 0.05; **P < 0.01; ***P < 0.001; ns nonsignificant. Statistical details are provided in Supplementary Table 1.
Fig. 4
Fig. 4. CIA mice show MAO-B-dependent cognitive impairment.
a, d Schematic protocols of the NOR test and NPR test. All objects were positioned in the middle of the first, second, and fourth quadrants of the cage. b, c The summary results of the NOR test of control, CIA and CIA + KDS2010 (10 mg/kg/day) mice (N = 14, 18, and 16; one-way ANOVA, Tukey’s multiple comparisons test). e, f The summary results of the NPR test of control, CIA and CIA + KDS2010 (10 mg/kg/day) mice (N = 9, 10, and 8; one-way ANOVA, Tukey’s multiple comparisons test). Error bars in the graphs indicate the SEM. *P < 0.05; **P < 0.01; ***P < 0.001; ns nonsignificant. Statistical details are provided in Supplementary Table 1.
Fig. 5
Fig. 5. Enhanced inhibitory signaling in the hippocampal CA1 region in CIA mice.
a, b Representative confocal images showing GFAP, GABA, and MAO-B in the CA1-hippocampus (scale bar, 10 µm). c GABA intensity in GFAP-positive areas (one-way ANOVA, Tukey’s multiple comparisons test, N = 4 for each group; n = 53, 104, and 67 for CTR, CIA, and CIA + KDS2010). d MAO-B intensity in GFAP-positive pixels (one-way ANOVA, Tukey’s multiple comparisons test, N = 3 for each group; n = 46, 47, and 41 for CTR, CIA, and CIA + KDS2010). e Colorimetric enzymatic analysis of MAO-B activity in hippocampal tissue (one-way ANOVA, Tukey’s multiple comparisons test, N = 4 for each group). f MAO-B mRNA levels in the hippocampus (one-way ANOVA, Tukey’s multiple comparisons test, N = 2 for each group). g, h Summary graph showing the GFAP-positive area and GFAP intensity (one-way ANOVA, Tukey’s multiple comparisons test, N = 4 for each group; n = 30, 30, and 36 for g and n = 8, 9, and 9 for h). i Number of GFAP-positive cells (N = 2 for each group; n = 7 for each group). j Sholl-analysis image of astrocytes using ImageJ. k, l The number of intersections and the ramification index of astrocytes (one-way ANOVA, Tukey’s multiple comparisons test, n = 15, 23, and 17 for CTR, CIA, and CIA + KDS2010). m Representative trace of GABAAR-mediated current in the CA1-hippocampus in control, CIA and CIA + KDS2010 mice (10 mg/kg/day). n Amplitude of the tonic GABA current (one-way ANOVA, Tukey’s multiple comparisons test, N = 5, 6 and 6; n = 21, 21, and 19 for CTR, CIA, and CIA + KDS2010). o Amplitude of the GABA-induced current (one-way ANOVA, Tukey’s multiple comparisons test, N = 3, 3 and 4; n = 8, 7, and 9 for CTR, CIA, and CIA + KDS2010). p Calculation of the GABA release component (calculated as the tonic current over the GABA-induced full current; one-way ANOVA, Tukey’s multiple comparisons test, N = 3, 3, and 4; n = 8, 7, and 9 for CTR, CIA, and CIA + KDS2010). q, r Amplitudes and frequencies of sIPSC amplitudes before bicuculline treatment (one-way ANOVA, Tukey’s multiple comparisons test, N = 5, 6, and 6; n = 21, 21, and 19 for CTR, CIA, and CIA + KDS2010). Error bars in the graphs indicate the SEM. *P < 0.05; **P < 0.01; ***P < 0.001; ns nonsignificant. Statistical details are provided in Supplementary Table 1.
Fig. 6
Fig. 6. IL-1β is sufficient for aberrant astrocytic GABA in the hippocampus.
a Schematic image of the incubation and a representative trace of the GABAAR-mediated current in the CA1-hippocampus within at least 2 h post of incubation with cytokines, including IL-1β (20 ng/ml), TNF-α (100 ng/ml), and IL-6 (10 ng/ml). b Amplitude of tonic current after 2 h of incubation (Kruskal–Wallis test with uncorrected Dunn’s multiple comparisons test, N = 3 for each group; n = 9, 9, 7, and 7). c Amplitude of the GABA-induced current (Kruskal–Wallis test with uncorrected Dunn’s multiple comparisons test, n = 9, 9, 7, and 9). d GABA release component (calculated as the tonic current over the GABA-induced current, Kruskal–Wallis test with uncorrected Dunn’s multiple comparisons test, n = 9, 9, 7, and 7). e Amplitude of sIPSCs before bicuculline application (Kruskal–Wallis test with uncorrected Dunn’s multiple comparisons test, N = 3 for each group; n = 9, 10, 7, and 8). f Frequency of sIPSCs before bicuculline application (Kruskal–Wallis test with uncorrected Dunn’s multiple comparisons test, n = 9, 10, 7, and 8). g, h Schematic image of bilaterally implanted guide cannulae and the timeline of IL-1β (20 ng/µl) or vehicle infusion into the hippocampus CA1 and the NOR test. i, j The summary results of the NOR test in the control and IL-1β infusion groups (N = 6 and 4 for control and IL-1β infusion). k Representative confocal images showing GFAP, GABA, and MAO-B in the CA1-hippocampus (N = 3 for each group; scale bar, 20 µm). l, m GABA and MAO-B intensity in GFAP-positive areas (n = 78 and 82 for control and IL-1β infusion). n, o The GFAP-positive area and GFAP intensity (n = 78 and 82 for each group). Error bars in the graphs indicate the SEM. *P < 0.05; **P < 0.01; ***P < 0.001; ns nonsignificant. Statistical details are provided in Supplementary Table 1.
Fig. 7
Fig. 7. IL-1β is sufficient for aberrant astrocytic GABA in the hippocampus.
a Timeline of subcutaneous (s.c.) injection of IL-1ra (5 µg) in CIA mice. b Representative trace of the GABAAR-mediated current in the CA1-hippocampus in control, CIA, CIA + IL-1ra mice. c Amplitude of the tonic GABA current (one-way ANOVA, Tukey’s multiple comparisons test, N = 5, 6, and 2; n = 21, 21, and 5 for CTR, CIA, and CIA + IL-1ra). d Amplitude of the GABA-induced current (one-way ANOVA, Tukey’s multiple comparisons test, N = 3, 3, and 2; n = 8, 7, and 5 for CTR, CIA, and CIA + IL-1ra). e Calculation of the GABA release component (calculated as the tonic current over the GABA-induced full current; one-way ANOVA, Tukey’s multiple comparisons test, N = 3, 3, and 2; n = 8, 7, and 5 for CTR, CIA, and CIA + IL-1ra). f, g Amplitudes and frequencies of sIPSC amplitudes before bicuculline treatment (one-way ANOVA, Tukey’s multiple comparisons test, N = 5, 6, and 2; n = 21, 21, and 5 for CTR, CIA, and CIA + IL-1ra). Error bars in the graphs indicate the SEM. *P < 0.05; **P < 0.01; ***P < 0.001; ns nonsignificant. Statistical details are provided in Supplementary Table 1.

References

    1. McInnes IB, Schett G. The pathogenesis of rheumatoid arthritis. N. Engl. J. Med. 2011;365:2205–2219. doi: 10.1056/NEJMra1004965. - DOI - PubMed
    1. Guo Q, et al. Rheumatoid arthritis: pathological mechanisms and modern pharmacologic therapies. Bone Res. 2018;6:15. doi: 10.1038/s41413-018-0016-9. - DOI - PMC - PubMed
    1. Smolen JS, et al. Rheumatoid arthritis. Nat. Rev. Dis. Prim. 2018;4:18001. doi: 10.1038/nrdp.2018.1. - DOI - PubMed
    1. Muller-Ladner U, Ospelt C, Gay S, Distler O, Pap T. Cells of the synovium in rheumatoid arthritis. Synovial fibroblasts. Arthritis Res. Ther. 2007;9:223. doi: 10.1186/ar2337. - DOI - PMC - PubMed
    1. Wang D, et al. Mechanisms of lung disease development in rheumatoid arthritis. Nat. Rev. Rheumatol. 2019;15:581–596. doi: 10.1038/s41584-019-0275-x. - DOI - PubMed

Publication types

MeSH terms