. 2022 Sep;7(9):1404-1418.
doi: 10.1038/s41564-022-01176-y. Epub 2022 Aug 18.

A biosynthetic pathway for the selective sulfonation of steroidal metabolites by human gut bacteria

Affiliations

A biosynthetic pathway for the selective sulfonation of steroidal metabolites by human gut bacteria

Lina Yao et al. Nat Microbiol. 2022 Sep.

Abstract

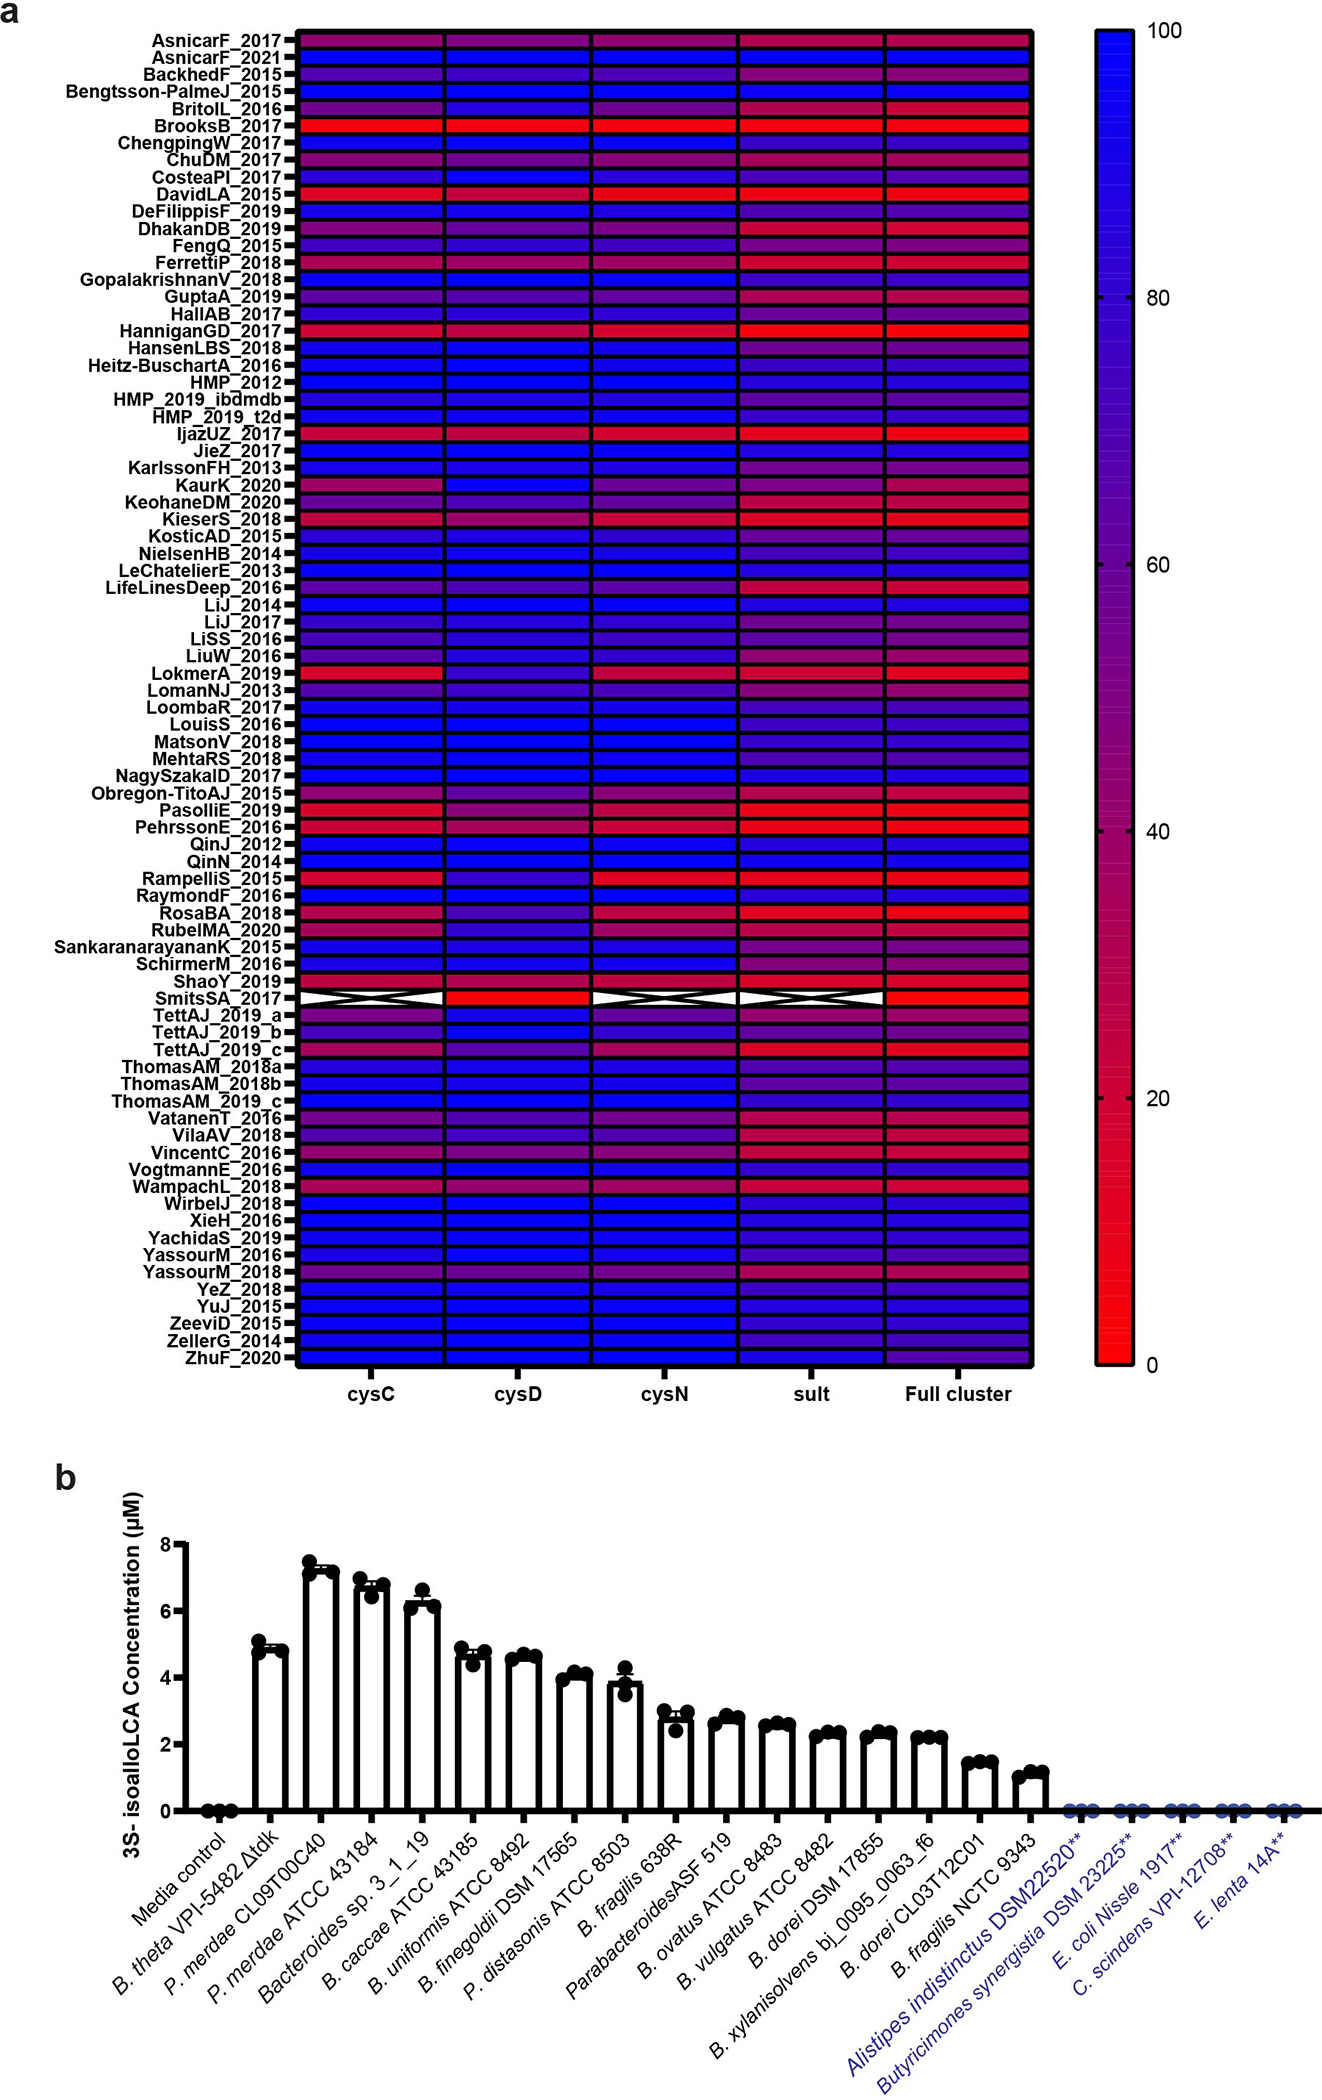
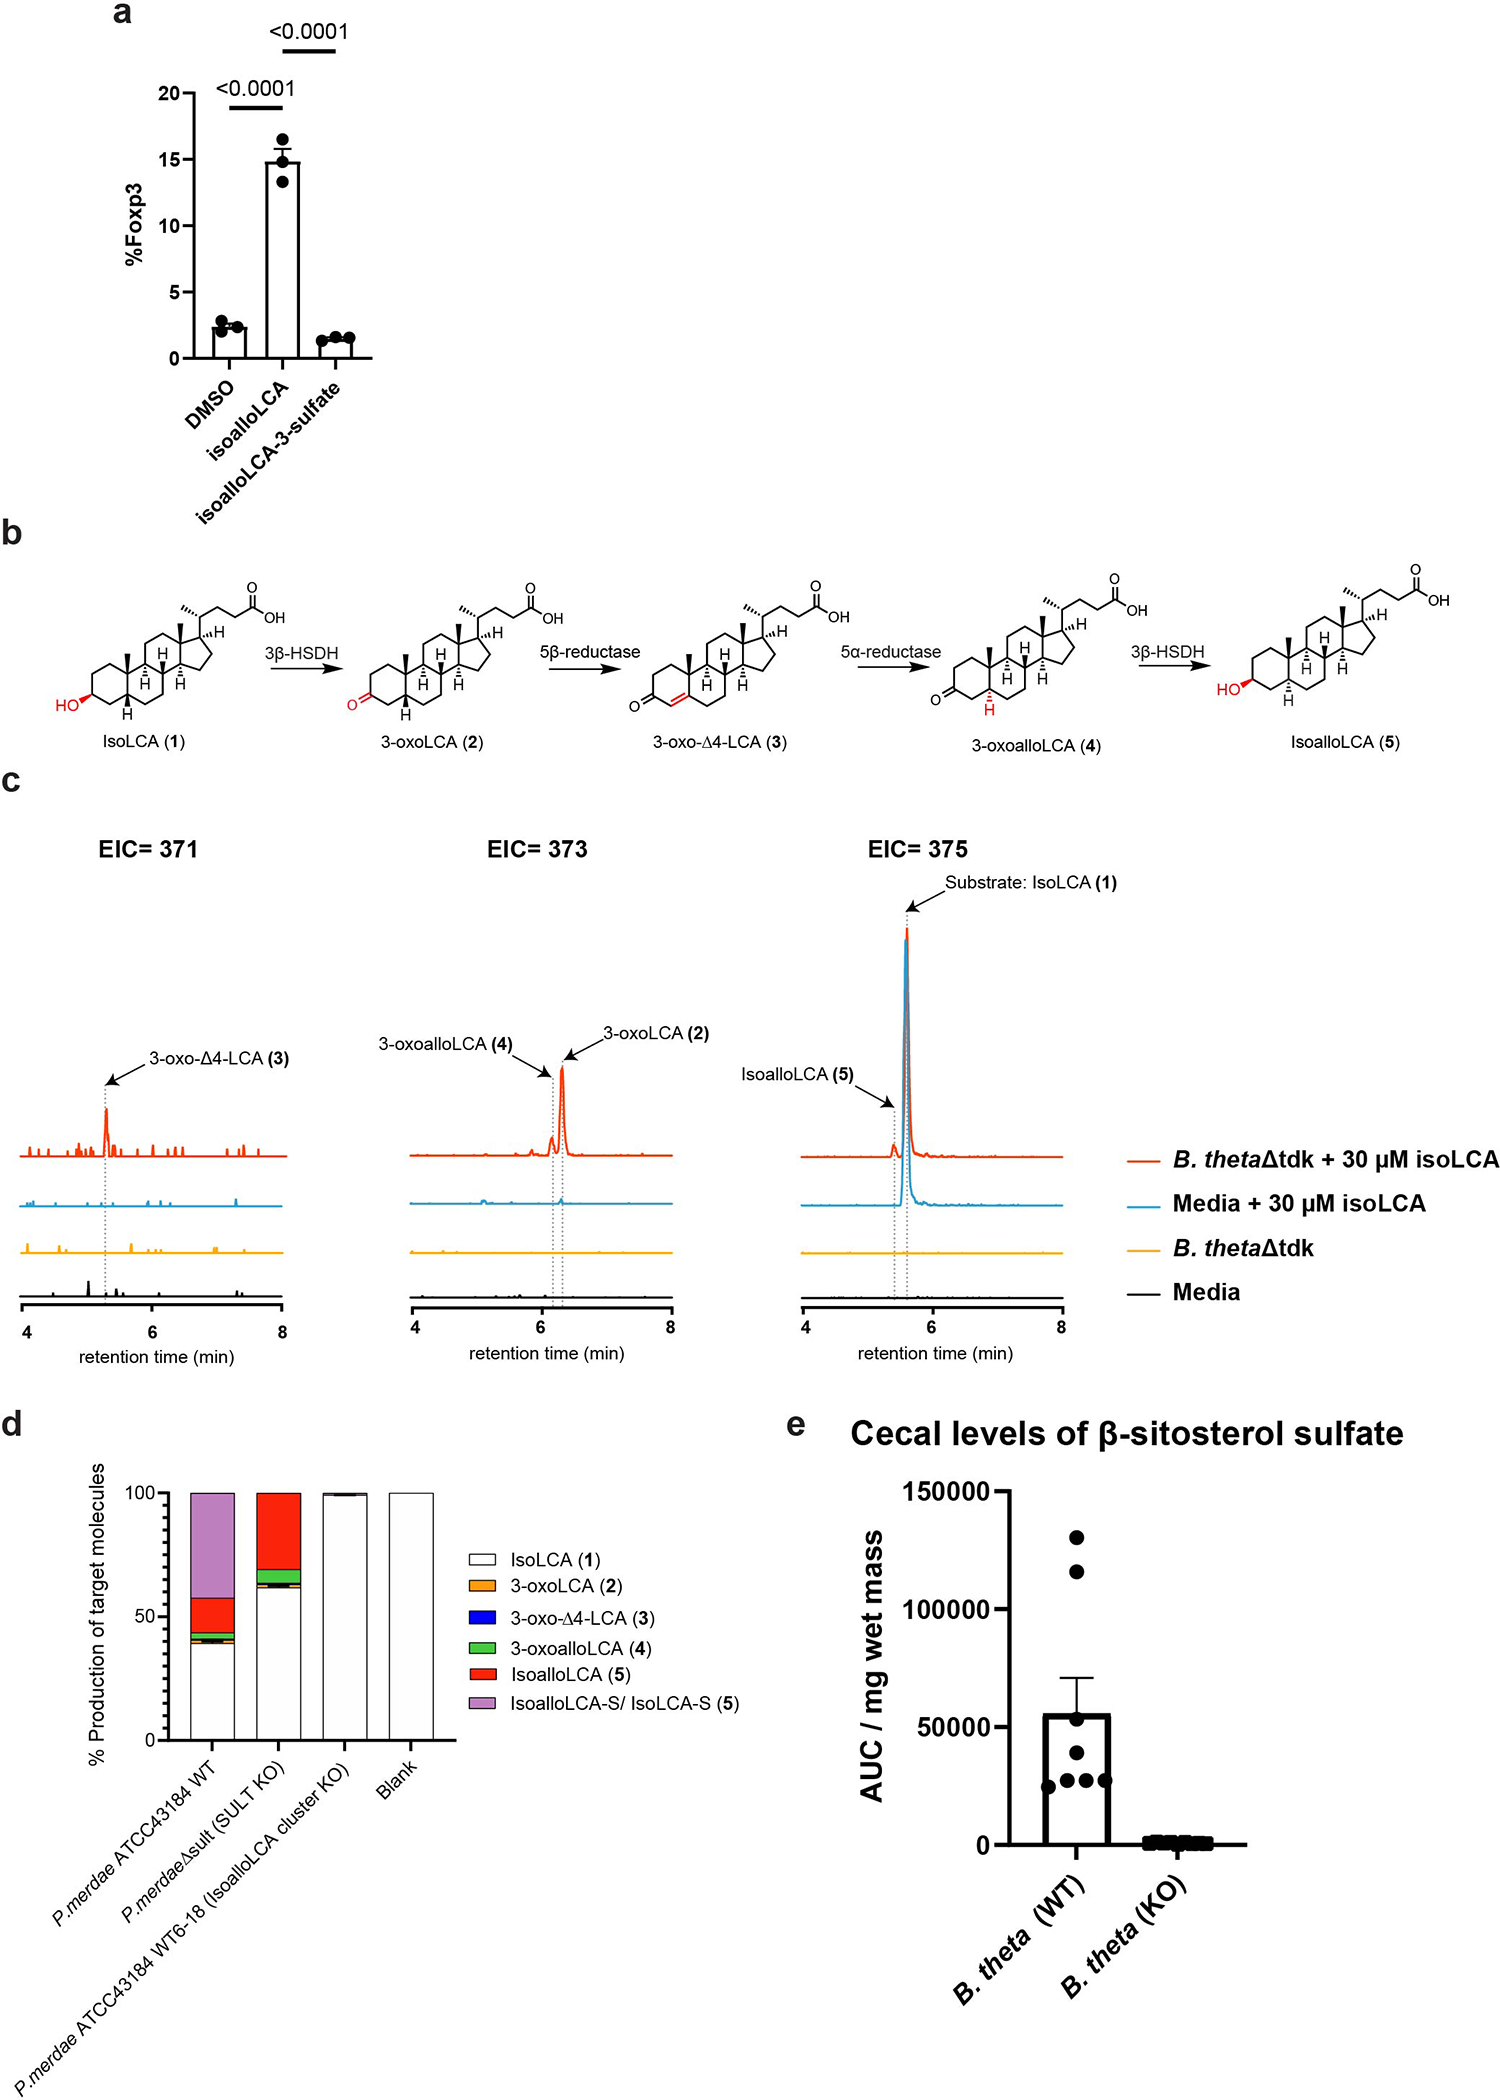
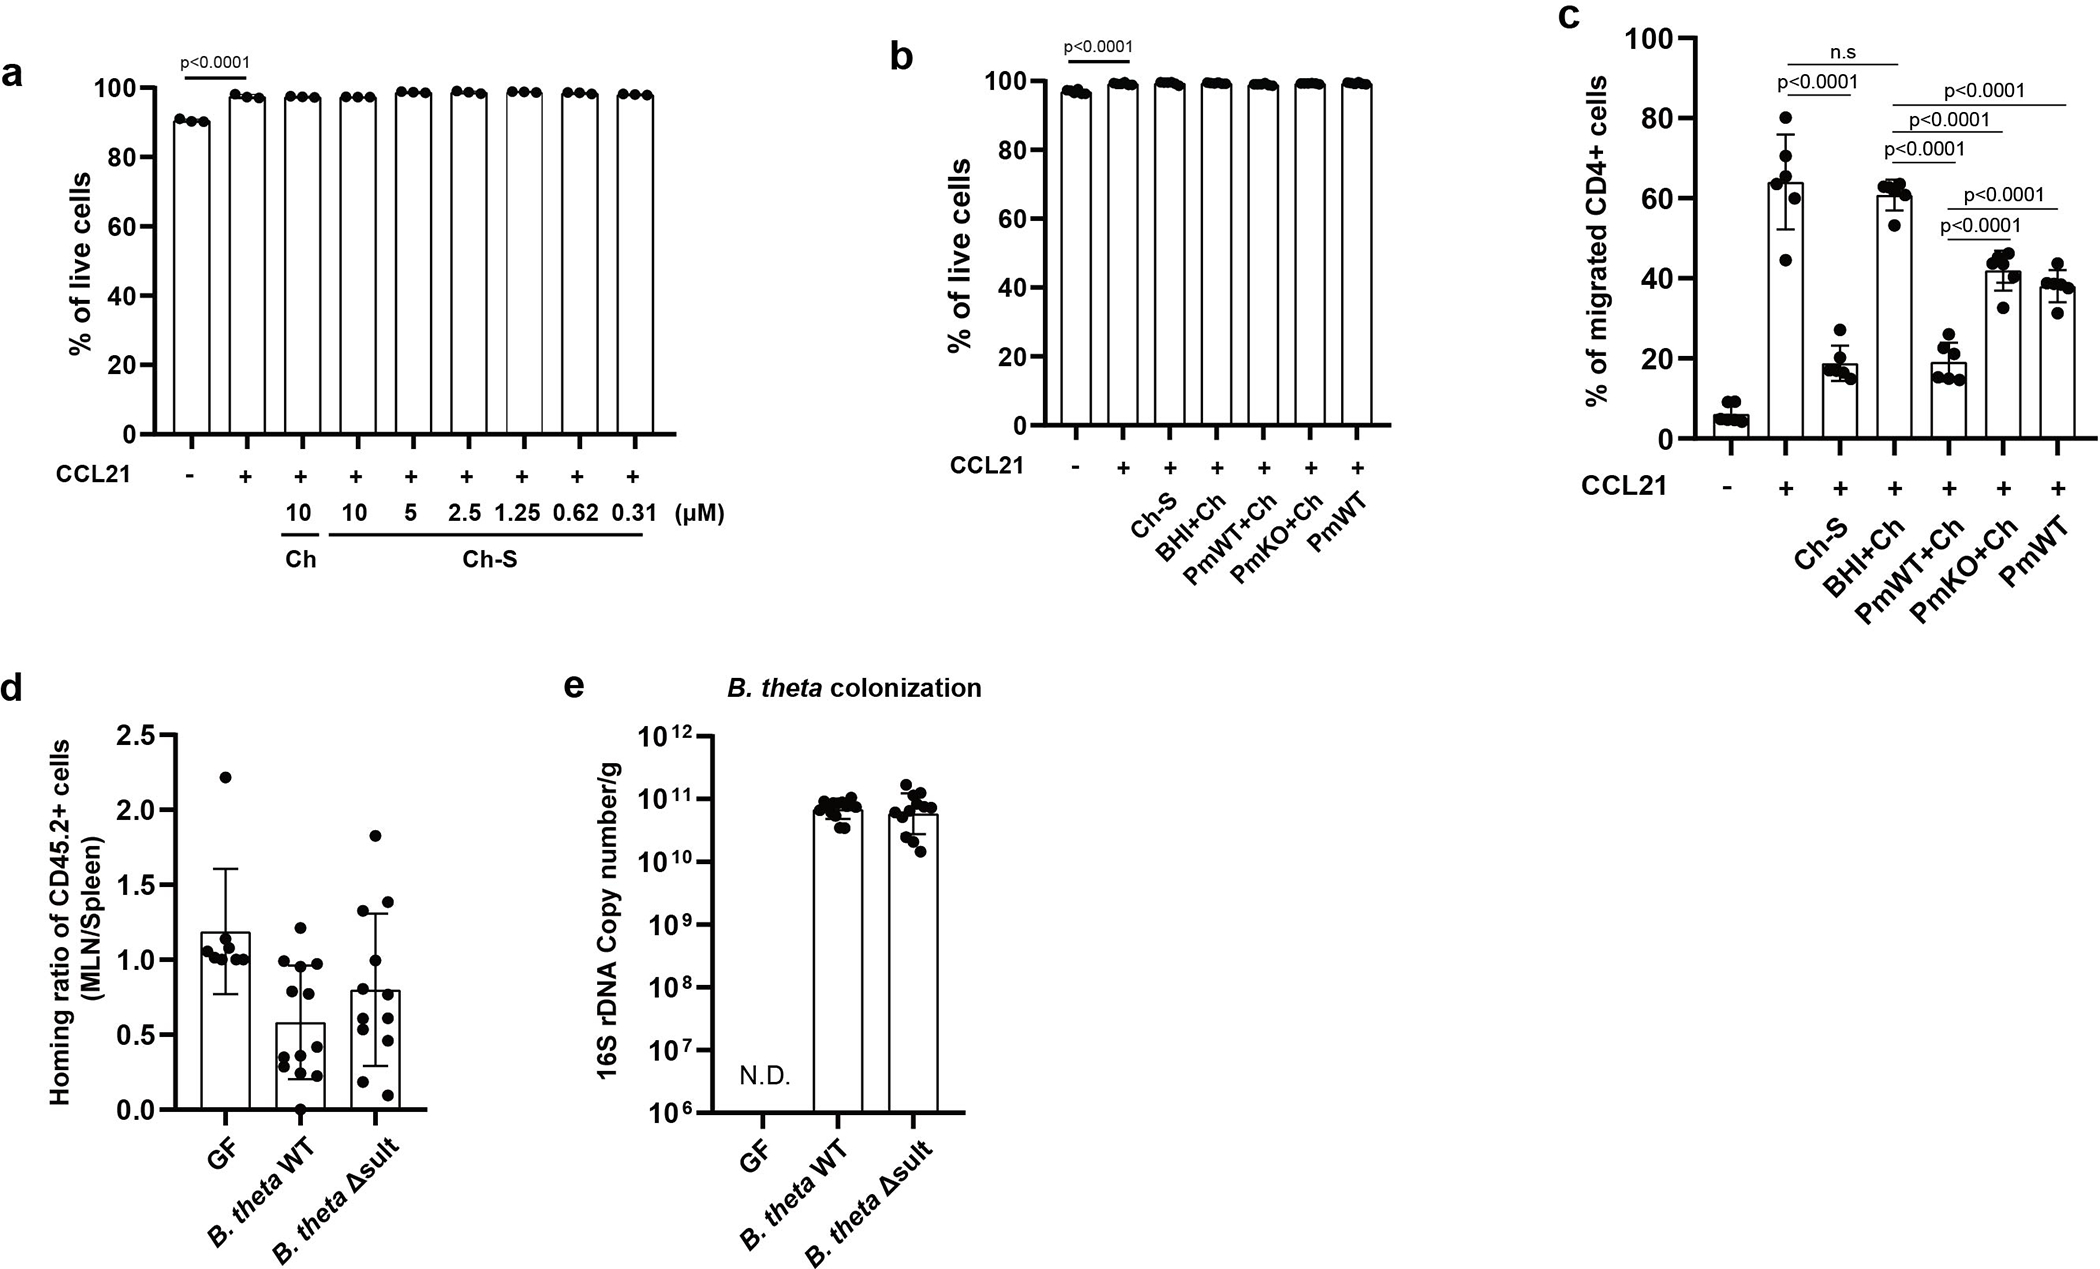
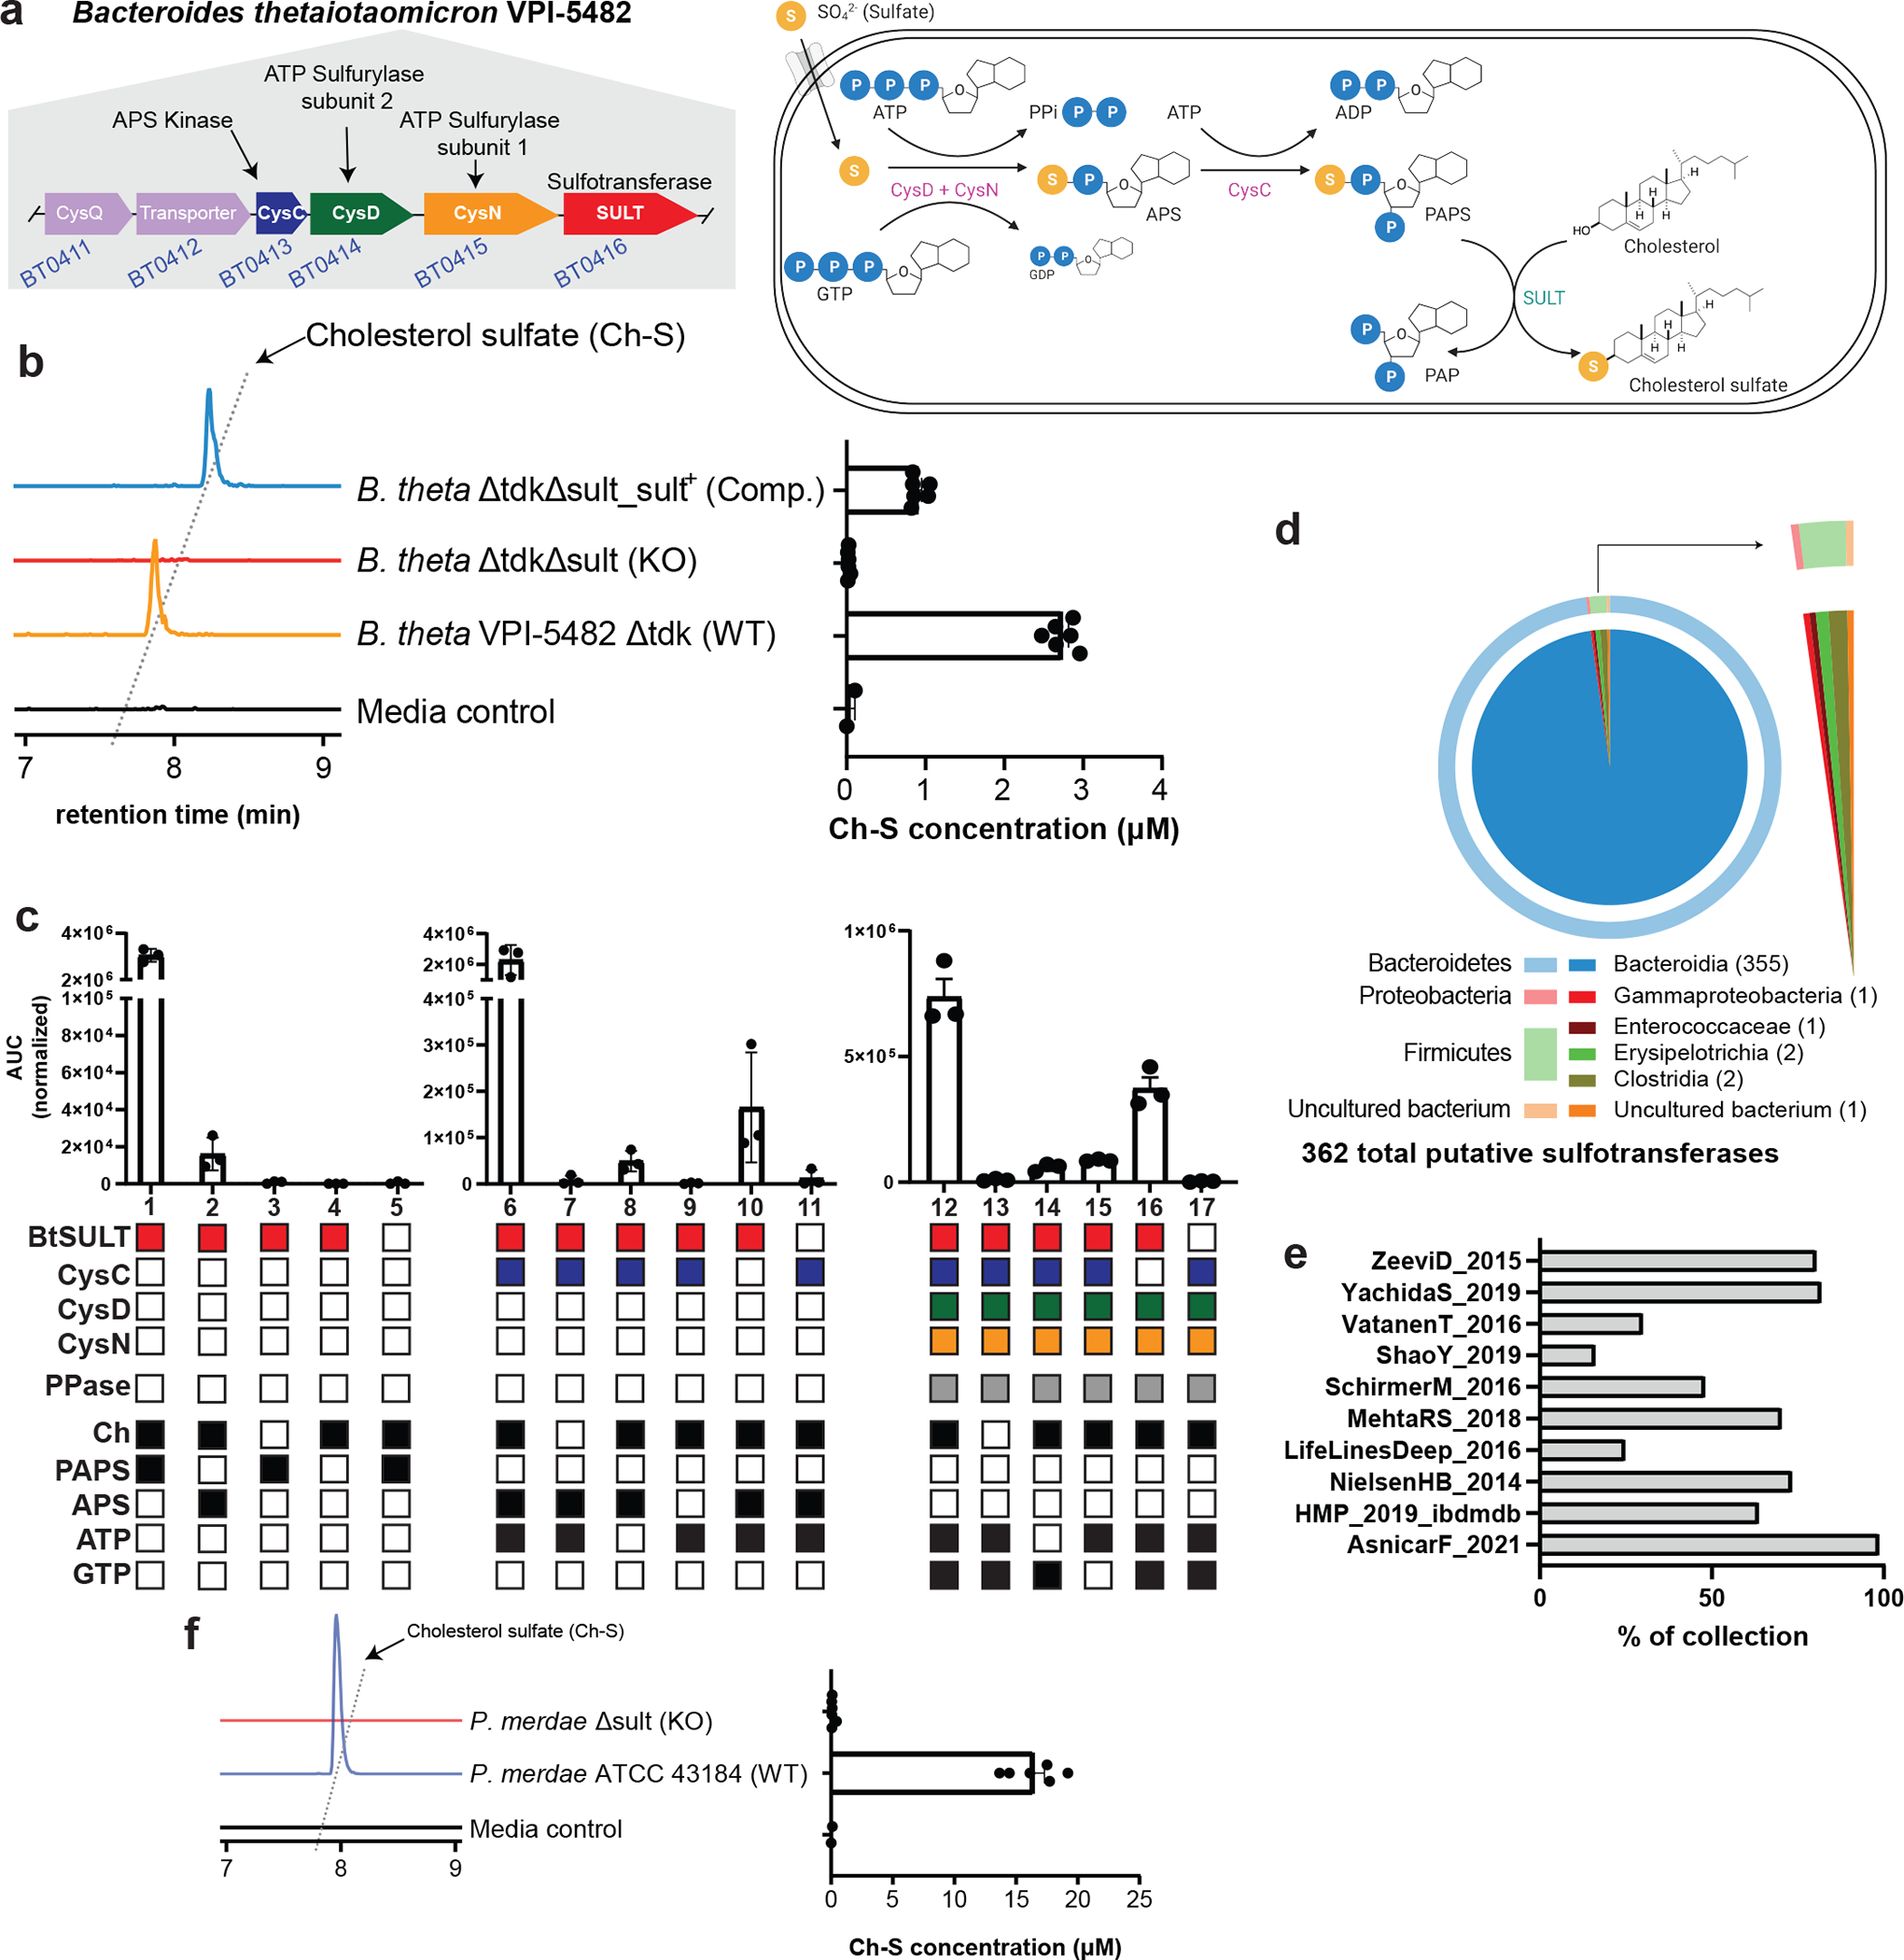
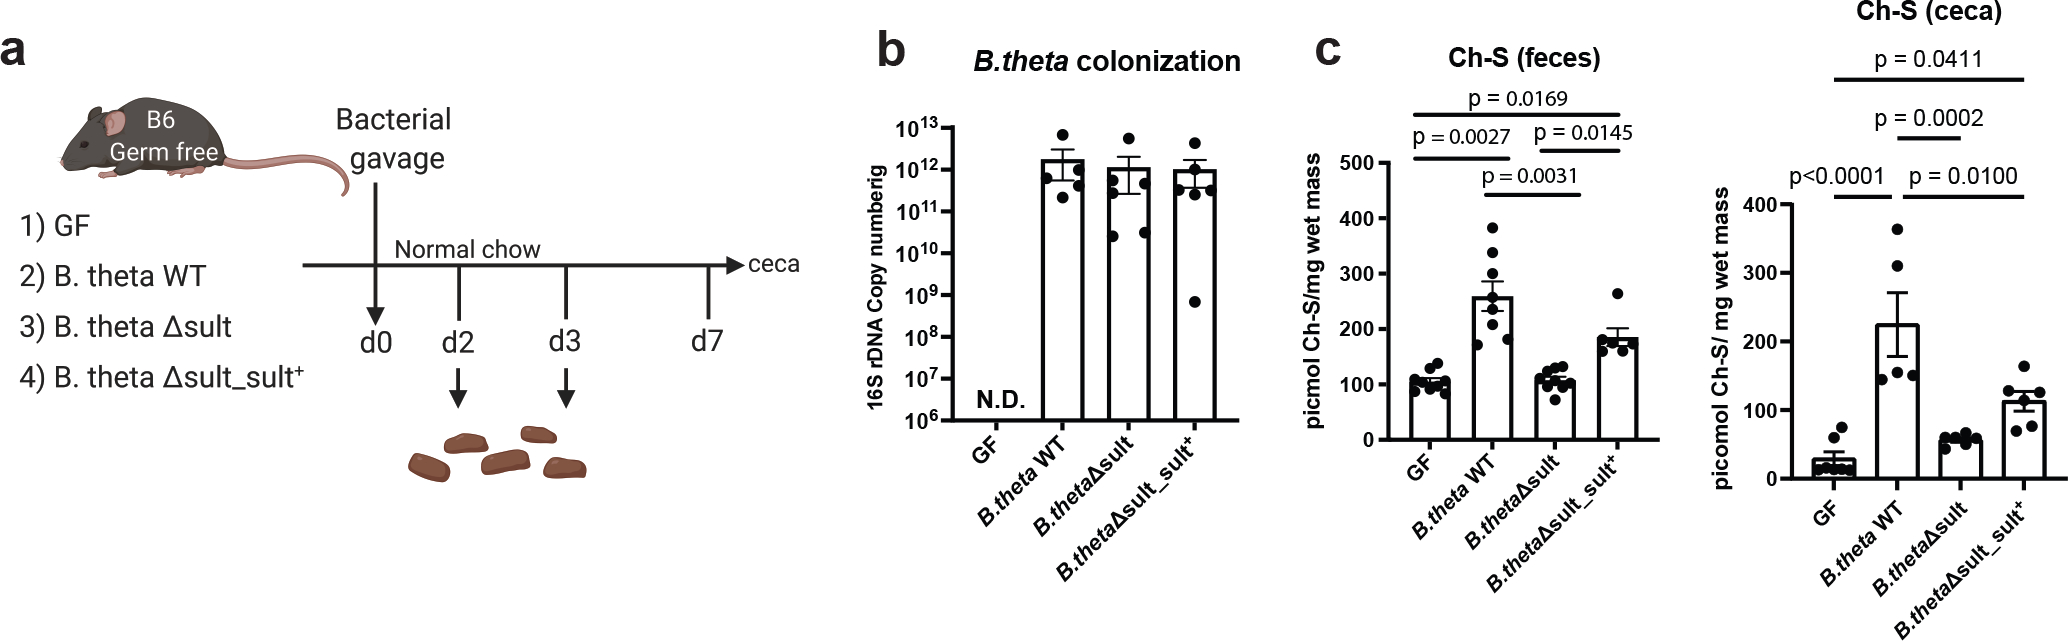
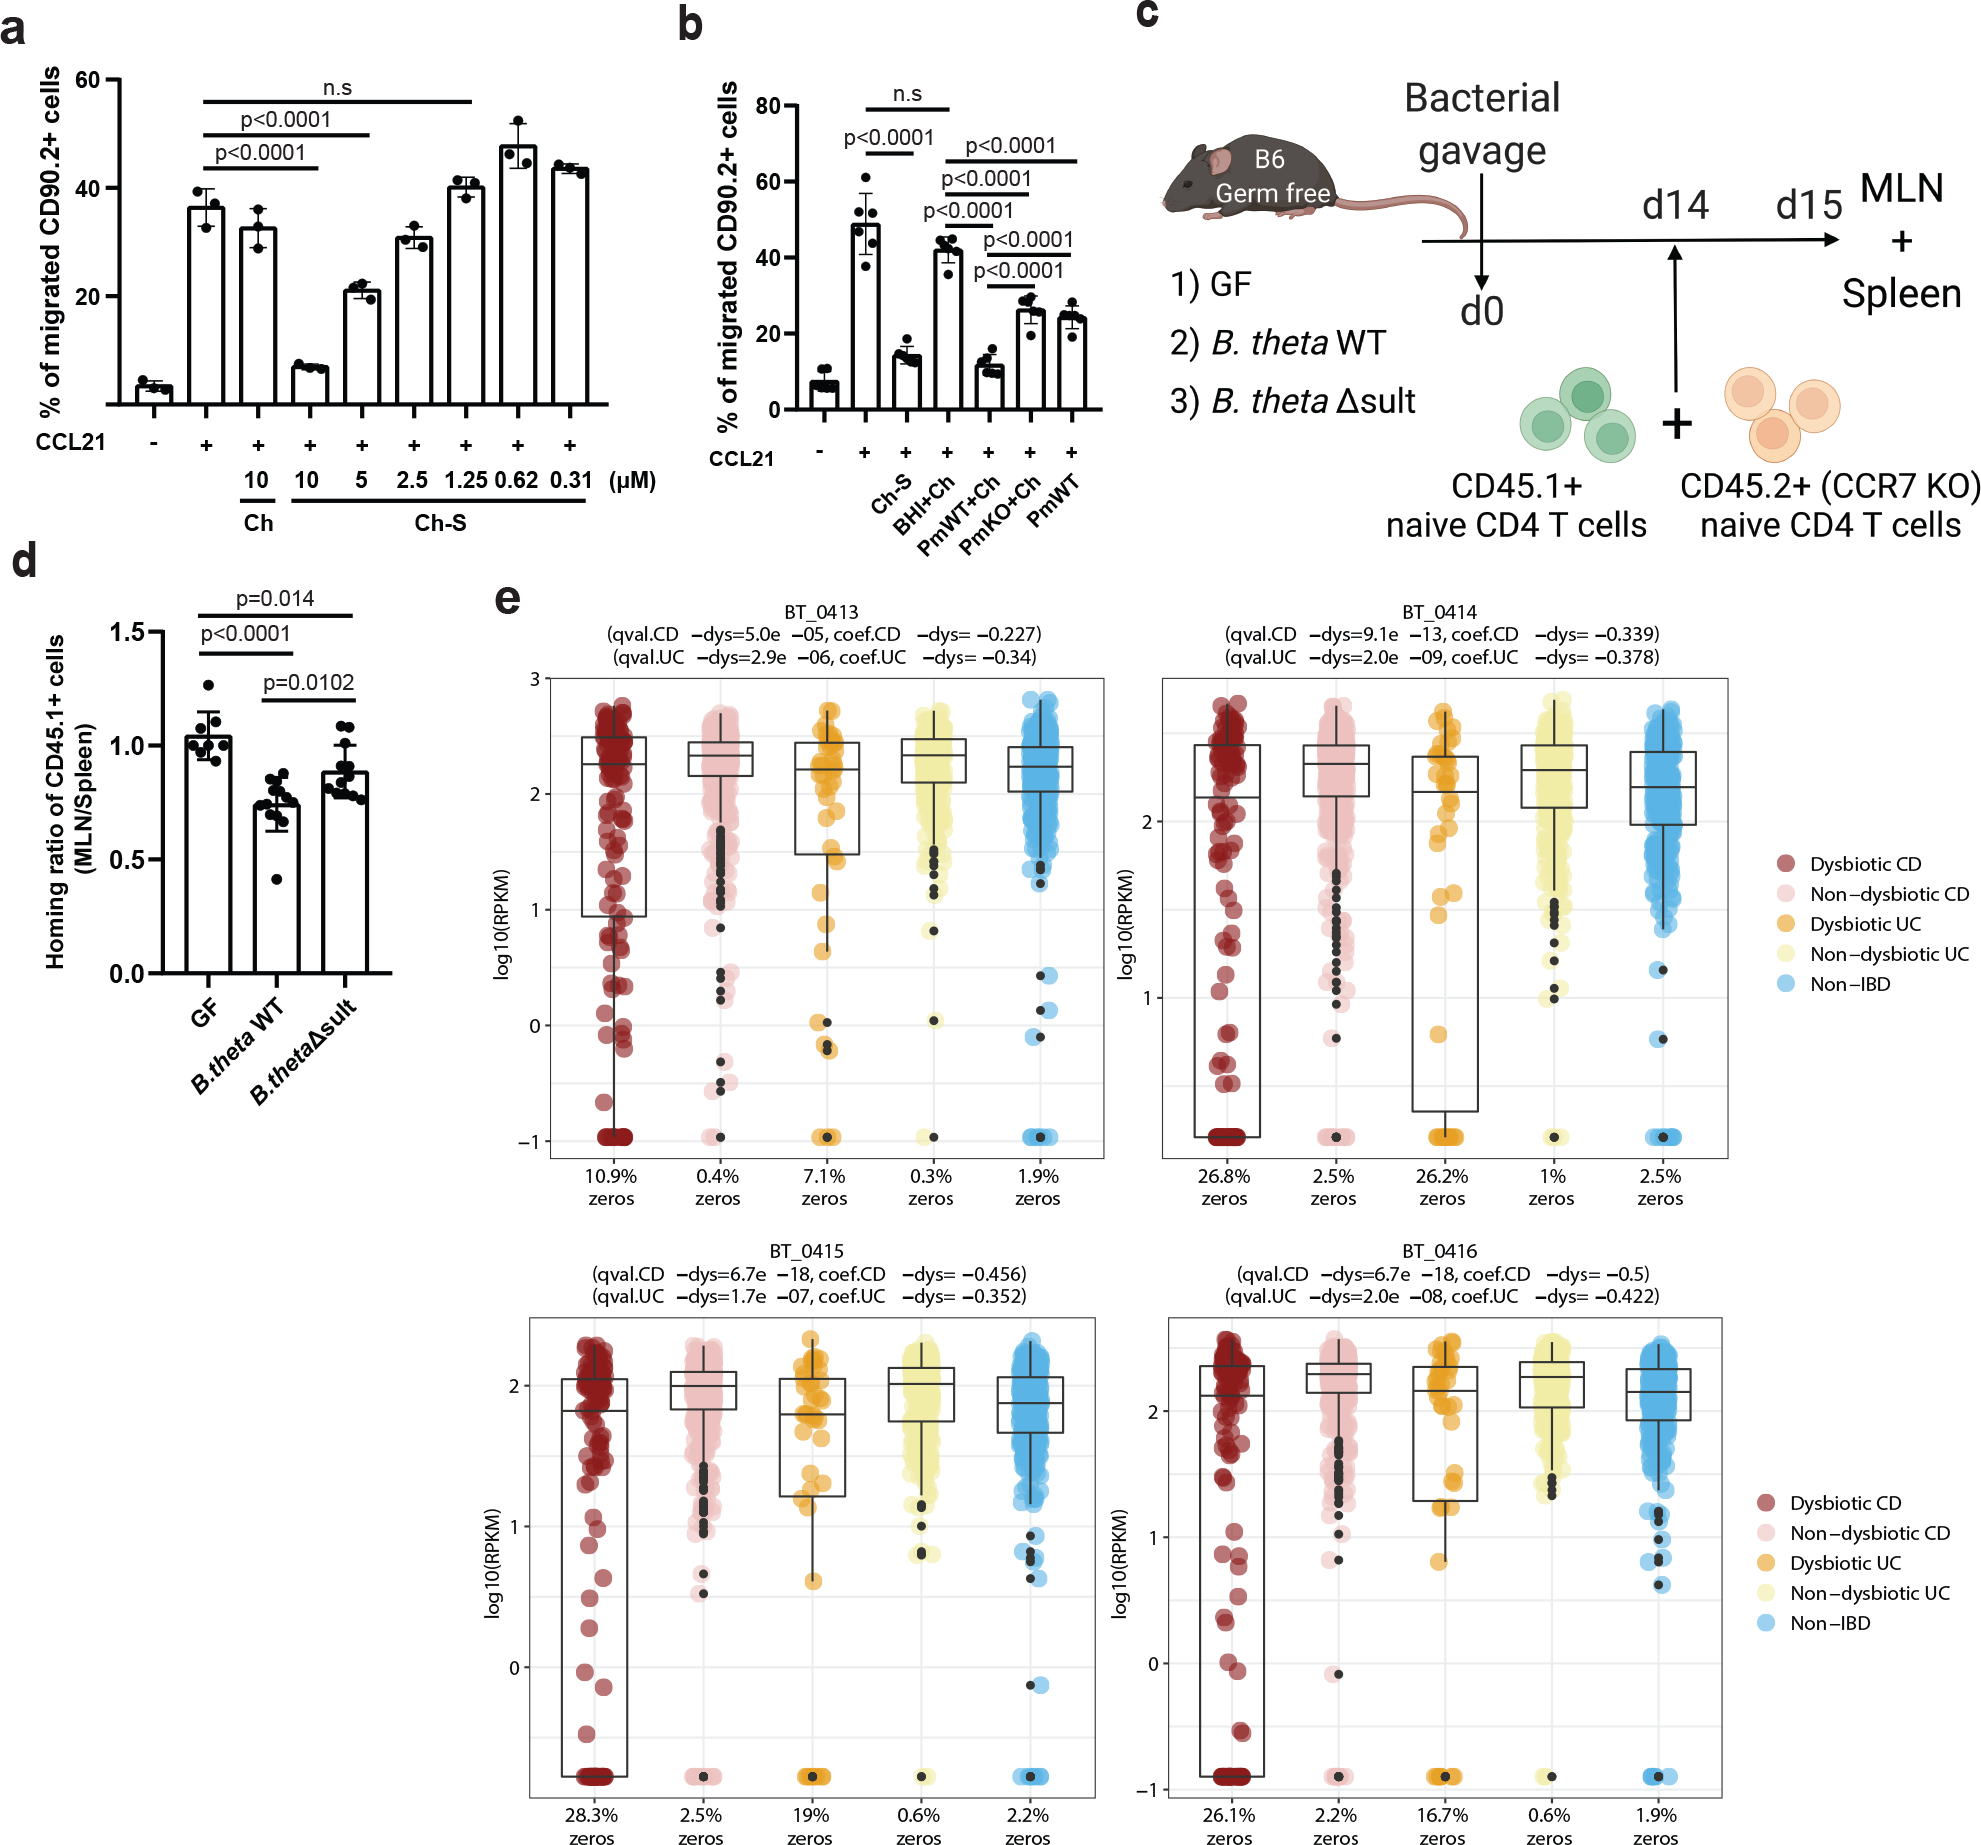
Members of the human gut microbiome enzymatically process many bioactive molecules in the gastrointestinal tract. Most gut bacterial modifications characterized so far are hydrolytic or reductive in nature. Here we report that abundant human gut bacteria from the phylum Bacteroidetes perform conjugative modifications by selectively sulfonating steroidal metabolites. While sulfonation is a ubiquitous biochemical modification, this activity has not yet been characterized in gut microbes. Using genetic and biochemical approaches, we identify a widespread biosynthetic gene cluster that encodes both a sulfotransferase (BtSULT, BT0416) and enzymes that synthesize the sulfonate donor adenosine 3'-phosphate-5'-phosphosulfate (PAPS), including an APS kinase (CysC, BT0413) and an ATP sulfurylase (CysD and CysN, BT0414-BT0415). BtSULT selectively sulfonates steroidal metabolites with a flat A/B ring fusion, including cholesterol. Germ-free mice monocolonized with Bacteroides thetaiotaomicron ΔBT0416 exhibited reduced gastrointestinal levels of cholesterol sulfate (Ch-S) compared with wild-type B. thetaiotaomicron-colonized mice. The presence of BtSULT and BtSULT homologues in bacteria inhibited leucocyte migration in vitro and in vivo, and abundances of cluster genes were significantly reduced in patients with inflammatory bowel disease. Together, these data provide a mechanism by which gut bacteria sulfonate steroidal metabolites and suggest that these compounds can modulate immune cell trafficking in the host.


Conflict of interest statement

Competing interests

A.S.D. is a consultant for Takeda Pharmaceuticals and Axial Therapeutics. J.R.H. is a consultant for CJ Research Center, LLC. C.H. is on the scientific advisory boards of Seres Therapeutics, Empress Therapeutics, and ZOE Nutrition. The remaining authors declare no competing interests.

Figures

Extended Data Fig. 1 |
Extended Data Fig. 1 |. Overview of the assimilatory and dissimilatory sulfur metabolism pathways in bacteria
Depiction of the assimilatory (blue) and dissimilatory (red) pathways for sulfur metabolism in bacteria showing the key molecules and enzymes involved. While the assimilatory pathway activates sulfur for subsequent incorporation in amino acids, cofactors, and other metabolites, the dissimilatory pathway utilizes sulfur as an electron sink in order to turn over cofactors, rid the cell of excess electrons, and produce hydrogen sulfide. All enzymes are listed by their common name.,,,
Extended Data Fig. 2 |
Extended Data Fig. 2 |. Generation of mutant strains, growth, and gene profiles in B. theta and P. merdae strains.
a, PCR verification of counter-selected deletion and complemented clones of the BT0416 gene in B. theta VPI-5482 Δtdk (WT). Lane 1: B. theta Δtdk (WT), lane 2: B. theta ΔtdkΔsult_sult+ (complemented strain), lane 3: B. theta ΔtdkΔsult (KO), and lane 4: NEB 1 kb DNA ladder. PCR primers, BT0416_F/ BT0416_R. Data presented represent individual PCR reactions. b, Growth profiles of B. theta cultured in BHI+ media displayed no difference between B. theta WT, KO, and Δsult_sult+. Culture turbidity was measured as optical density at 600 nm (OD600). Values are mean ± SEM, n=3 biological replicates. c, Growth profiles of B. theta VPI-5482 Δtdk and VPI-5482 Δsult show no difference when incubated with either Ch (30 μM) or Ch-S (30 μM) in BHI+ media. Culture turbidity was measured as optical density at 600 nm (OD600). Values are mean ± SEM, n=3 biological replicates. d, PCR of counter-selected colonies for the deletion of BT0412 in B. theta VPI-5482 Δtdk. Lane L: NEB 1kb DNA ladder, Lanes 1–4,5: negative cultures, Lane 4: B. theta ΔBT0412 (KO). Lane 6: Wild type culture amplification. PCR primers: BT0412_UF2, BT0412_DR2. Data presented represent individual PCR reactions. e, Growth curves plotting OD600 of B. theta WT, ΔBT0412, and ΔBT0413–5 cultures in BHI+ media with 30 μM Ch, data shown are mean ± SEM, n = 3 biological replicates. f-h, OD600 measures of WT, ΔBT0412, and ΔBT0413–5 cultures at i) 4h, j), 8h, and k) 24h, showing significant defects in the growth of both knockout strains. Data are shown as mean ± SEM with one-way ANOVA multiple comparisons to WT with Dunnett’s correction, n = 3 biological replicates. I, Representative extracted ion chromatogram (EIC) UPLC-MS traces (left) and quantified production (right) show that B. theta and B. theta ΔBT0412 produces Ch-S when incubated with Ch (100 μM) over 72 hours while B. theta ΔBT0413–5 does not produce Ch-S under the same conditions. Data are presented as mean ± SEM, n=3 biological replicates. j, PCR of counter-selected colonies for the deletion of BT0413–5 in B. theta VPI-5482 Δtdk. Lane L: NEB 1kb DNA ladder, Lanes 1: Wild type culture amplification, Lanes 2–12,14,16: negative cultures, Lanes 13,15: B. theta ΔBT0413–5 (KO). PCR primers: BT0413–5_UF2, BT0413–5_DR2. Data presented represent individual PCR reactions. k, B. theta ΔBT0413–5 culture lysate produced Ch-S when chemically complemented with PAPS (100 μM). No Ch-S production was detected in the absence of PAPS. Data are shown as mean ± SEM, n = 3 replicates. l, End-point overlapping PCR of genes in BtSULT cluster with gDNA (lanes 2, 4, 6, 8, 10, and 12) and paired cDNA (lanes 3, 5, 7, 9, 11, and 13) derived from extracted mRNA. Representative samples (n=3) run on 0.8% agarose gel with NEB 1kb ladder (L). m, As measured by RT-qPCR, the expression of BT0416 in B. thetaiotaomicron was not affected by the addition of cholesterol at 1, 6, and 8 hours post Ch addition (n = 3 biological replicates per group, data are normalized to 16S rRNA and shown as mean ± SEM with Welch’s t-test with 2-tailed p-value). n-o, Cultures of B. theta in BHI+ media with Ch (30 μM) were harvested at 48 and 168 hours and Ch-S levels were assessed in whole culture, media supernatant, and washed pellet. The data are reported as percentage of Ch-S in pellet and supernatant compared to paired whole cell culture. n = 3 biological replicates, mean ± SEM with Welch’s t-test with two-tailed correction. p, PCR verification of counter-selected clones for deletion of the PARMER_01922 gene in P. merdae ATCC 43184 (WT). Lane 1: P. merdae (WT), lane 2: P. merdae Δsult (KO), and lane 4: NEB 1 kb DNA ladder. PCR primers, PARMER01922_F/ PARMER01922_R. q, Growth profiles of P. merdae cultured in BHI+ media displayed no difference between P. merdae WT and Δsult. Culture turbidity was measured as optical density at 600 nm (OD600). Values are mean ± SEM, n=3 biological replicates. Data presented represent individual PCR reactions.
Extended Data Fig. 3 |
Extended Data Fig. 3 |. Metagenomic prevalence of BT0413-BT0416
a, Metagenomic prevalence of genes across the collections available in the curatedMetagenomicData program. Each row of the heat map represents a different collection, with each column representing an individual gene. The full cluster annotation is the percent of samples in each collection that possess all 4 genes (BT0413-BT0416). b, IsoalloLCA-3-sulfate was produced by species from the Bacteroidetes phylum containing a homolog for BtSULT (black text) and was not produced by Bacteroides species (Alistipes indistinctus DSM 22520, Butyricimonas synergistica DSM 23225) and other bacteria (E. coli Nissle 1917, C. scindens VPI 12708, and E. lenta 14A) that lack a BT0416 homolog (blue text) (n=3 biological replicates per group, data are mean ± SEM).
Extended Data Fig. 4 |
Extended Data Fig. 4 |. Sulfonation of isoalloLCA alters its biochemical properties.
a, Flow cytometry analysis and quantification of native CD4+ T-cells cultured under TH0 conditions (anit-CD3, anti-CD28, and IL-2) conditions in the presence of DMSO, isoalloLCA, or isoalloLCA 3-sulfate for 72 hours are shown. Cells were stained with FOXP3 as a marker for Treg cells (n = 3 biological replicates per group, data are shown as the mean ± SEM, one-way ANOVA followed by Tukey’s multiple comparison test). b, Previously elucidated biosynthetic pathway in Bacteroidetes species for the conversion of isoLCA (1) to isoalloLCA (5). The site of biotransformation is highlighted in red for each step. c, Extracted ion chromatograms (EICs) showing that B. theta Δtdk (WT) cultures incubated with isoLCA produced isoalloLCA (5) as well as the intermediates 3-oxoLCA (2), 3-oxo-Δ4-LCA (3), and 3-oxoalloLCA (4), supporting the hypothesis that subsequent actions of a 3β-hydroxysteroid dehydrogenase (HSDH), 5β-reductase, a 5α-reductase, and a 3β-HSDH are responsible for the conversion of isoLCA to isoalloLCA by B. theta. d, The composition of bile acid metabolites was determined for cultures of P. merdae ATCC 43184, P. merdae Δsult, and P. merdae ΔPARMER_04016–18 incubated for 48 hours with isoLCA (100 μM). We observed a complete loss of the sulfonated compound in P. merdae Δsult culture, while the P. merdae ΔPARMER_04016–18 culture exhibited a loss of isoLCA-derived intermediates and a marked decrease in production of sulfonated compound compared to the WT culture. The composition of LCA derived molecules was determined by UPLC-MS (n = 3 biological replicates). e, β-sitosterol-3-sulfate levels in the cecal contents of mice monocolonized with B. theta WT were elevated when compared to levels in B. theta KO colonized mice (B. theta WT n = 8, B. theta KO n = 9, results pooled from three separate experiments, data are presented as mean ± SEM).
Extended Data Fig. 5 |
Extended Data Fig. 5 |. Comparison of cholesterol metabolite and gene expression levels between GF and SPF mice
a-c, Cholesterol sulfate levels were quantified in the a) ceca, b) feces, and c) plasma of GF (n=5) and SPF (n=5) and found to be higher in GF mice across these tissues. Data are shown as mean ± SEM with Welch’s two-tailed t-test. d-f, Cholesterol levels were quantified in the d) ceca, e) feces, and f) plasma of the same mice by GCMS and found to not be significantly different. Data are shown as mean ± SEM with Welch’s two-tailed t-test. g-i, Expression of host Sult2B1b was measured by quantitative PCR in the g) liver, h) ileum, and i) colon of GF mice (n=5) compared to SPF mice (n=5) and found to have significant differences in both the liver and colon, data are normalized to L32 and shown as mean ± SEM with Welch’s two-tailed t-test. j-l, Expression of host steroid sulfatase (sts) was measured by quantitative PCR in the j) liver, k) ileum, and l) colon of GF mice (n=5) compared to SPF mice (n=5) and found to be significantly different in the ileum, data are normalized to L32 and shown as mean ± SEM with Welch’s two-tailed t-test..
Extended Data Fig. 6 |
Extended Data Fig. 6 |. Cholesterol availability in vitro and in vivo
a, B. thetaiotaomicron WT cultured in different types of media (BHI+, defined media, and “Enhanced” defined media) with and without lecithin (10 mg/L) exhibited lower levels of Ch-S production compared to BHI+ media. Data are shown as mean ± SEM with one-way ANOVA with Dunnett’s correction, comparing to BHI+ production, n = 3 biological replicates. b, The OD600 of cultures from a) was taken after 48 hour of incubation. No significant differences in growth levels were observed between pairs of cultures. Data are shown as mean ± SEM with Welch’s two tailed t-test comparing between pairs of cultures, n = 3 biological replicates. c, Levels of Ch quantified by GCMS in cecal contents of germ-free (n=5) and SPF (n=5) mice. Data are presented as mean ± SEM with Welch’s two-tailed t-test. d, Levels of Ch quantified by GCMS in fecal pellets of germ-free (n=5) and SPF (n=5) mice. Data are presented as mean ± SEM with Welch’s two-tailed t-test. e, Concentration of Ch found in human feces (n = 2 biological samples) in technical triplicate. Data are shown as mean ± SEM.
Extended Data Fig. 7 |
Extended Data Fig. 7 |. Sulfonation versus desulfation by gut bacteria
a, Ch-S levels were reduced when this metabolite was incubated with B. thetaiotaomicron lysate but not when incubated with whole cells. Data are shown as mean ± SEM with Welch’s t-test with two tails between each time point, n = 3 biological replicates. b, Proposed model of Ch-S production and release by B. thetaiotaomicron over cell lifecycle. During lag and exponential phase, Ch-S is produced within the cell and exists in equilibrium with Ch. This equilibrium is controlled by both BtSULT and bacterial SULF, with BtSULT favoring Ch-S production. During late stationary phase, cell death and lysis leads to the release of ChS into extracellular environment. c,d, Slurries of fecal samples from two healthy donors,I) Fe and (d) Fc, were independently cultured for 7 days following addition of Ch and Ch-S (15 μM each) to test the relative activity of SULT vs. SULF in an ex vivo microbiome. Levels of Ch-S were significantly increased in both cultures after 7 days. Data are shown as mean ± SEM with one-way ANOVA followed by Tukey’s multiple comparisons test, n = 3 replicate cultures per donor.
Extended Data Fig. 8|
Extended Data Fig. 8|. BtSULT suppressed T cell migration in vitro and in vivo
a, Ch-S treatment did not affect leukocyte viability (data correspond to Fig. 4d). Live cell percentage was measured by live/dead dye staining (right) (n=3 biological replicates per condition, data are presented as mean ± S.D, one-way ANOVA followed by Tukey’s multiple comparison test). b, Bacterial supernatant treatment did not affect leukocyte viability (data correspond to Fig. 4e). Cells were incubated with the following supernatants: BHI+Ch (BHI media + Ch), PmWT+Ch (P. merdae wild-type, cultured with Ch), PmKO+Ch (P. merdae KO cultured with Ch), and PmWT (P. merdae wild-type without Ch) (n=6 biological replicates per condition, data pooled from two independent experiments, data are presented as mean ± S.D., one-way ANOVA followed by Tukey’s multiple comparison test n.s = not significant). c, Ch-S produced by P. merdae suppressed T cell migration following treatment with CCL21 (200ng/mL). The migrated T cells were identified using CD45, CD90.2 and CD4 antibodies (n=6 biological replicates per condition, data pooled from two independent experiments, data are presented as mean ± S.D., one-way ANOVA followed by Tukey’s multiple comparison test, n.s = not significant). d, The migration of CCR7-deficient CD45.2+ T cells to MLNs is comparable regardless of recipient mice (data correspond to Fig. 4g). Cells isolated from spleen and MLNs of recipient mice post-24 hours. Results are presented as the normalized ratio of the migrated cells to MLNs divided by the migrated cells to spleens (GF, n=8; B. thetaiotaomicron WT, n=13; B. thetaiotaomicron sult KO, n=12; data pooled from three independent experiments, data are presented as mean ± S.D., one-way ANOVA followed by Tukey’s multiple comparison test). e, Comparable colonization of B. thetaiotaomicron strains. qPCR analyses for detecting the B. thetaiotaomicron 16S rRNA gene in fecal samples (GF, n=8; B. thetaiotaomicron WT, n=13; B. thetaiotaomicron Δsult, n=12; data pooled from three independent experiments, N.D=not detected).
Extended Data Fig. 9 |
Extended Data Fig. 9 |. Ch-S levels in mouse intestinal contents and blood
a, Ch-S levels in cecal contents of mice colonized with B. thetaiotaomicron WT were significantly higher than those in GF mice or B. thetaiotaomicron KO colonized mice (GF, n=6; B. theta WT, n=6; B. theta KO, n=6), data are presented as mean ± SEM, one-way ANOVA followed by Tukey’s multiple comparisons. b, Ch-S levels in fecal contents of mice colonized with B. thetaiotaomicron WT were significantly higher than those in GF mice or B. thetaiotaomicron KO colonized mice (GF, n=6; B. theta WT, n=6; B. theta KO, n=6, data are presented as mean ± SEM, one-way ANOVA followed by Tukey’s multiple comparisons). c, Ch-S levels in the plasma of mice colonized with B. thetaiotaomicron WT were not significantly higher than those in GF mice or B. thetaiotaomicron KO colonized mice (GF, n=6; B. theta WT, n=6; B. theta KO, n=6, data are presented as mean ± SEM, one-way ANOVA followed by Tukey’s multiple comparisons). d, No significant differences in the expression of the host gene sult2b1b were observed in the liver of B. theta WT or Δsult-colonized mice compared to GF mice as measured by quantitative PCR (n=6 mice per group), data are normalized to L32 and shown as mean ± SEM with one-way ANOVA followed by Tukey’s multiple comparisons, (n.s. = not significant). e, Expression of host gene sult2b1b was found to be significantly upregulated in the ileum of GF mice compared to mice colonized with B. theta WT or Δsult as measured by quantitative PCR (n=6 mice per group), data are normalized to L32 and shown as mean ± SEM with one-way ANOVA followed by Tukey’s multiple comparisons. f, No significant differences in the expression of the host gene sult2b1b were observed in the colon of B. theta WT or Δsult-colonized mice compared to GF mice as measured by quantitative PCR (n=6 mice per group), data are normalized to L32 and shown as mean ± SEM with one-way ANOVA followed by Tukey’s multiple comparisons, (n.s. = not significant). g-i, No significant differences in the expression of the host gene steryl sulfatase (sts) were observed in the g) liver, h) ileum, or i) colon of B. theta WT or Δsult-colonized mice compared to GF mice as measured by quantitative PCR (n=6 mice per group), data are normalized to L32 and shown as mean ± SEM with one-way ANOVA followed by Tukey’s multiple comparisons, (n.s. = not significant).
Extended Data Fig. 10 |
Extended Data Fig. 10 |. BT0413-BT0416 homologs show significant differential abundance after adjusting for variation in underlying taxonomic abundance
a, Accounting for underlying variation in the taxonomic abundance of SULT possessing bacteria (Bacteroidetes), with phyla abundances as additional covariates to normalize the abundance of genes. BT0413-BT0416 homologues were profiled from HMP2 metagenomes (n = 1,595 samples from 130 subjects; linear mixed-effects model coefficient for dysbiosis within diagnosis, FDR-adjusted p-values < 0.05). The percentage of zeros in each condition are added as x-axis tick labels. Boxplot ‘boxes’ indicate the first, second (median), and third quartiles of the data. Whiskers indicate the inner fences of the data. Statistical analysis was performed using a linear mixed-effect model and its coefficient and significance, FDR-adjusted p-values, are shown. b,c, Ch-S was not significantly depleted in patients with CD or UC either when patients were separated into dysbiotic and non-dysbiotic states (b) or patients were not separated based on dysbiotic state (c) relative to non-IBD control samples in the HMP2 cohort (n = 47, n = 169, n = 12, n = 110 and n = 122 for individuals with dysbiotic CD, with non-dysbiotic CD, with dysbiotic UC, with non-dysbiotic UC and without IBD, respectively). The percentage of zeros is shown on the x axis. For the box plots, the center line indicates the median (second quartile) and the box limits indicate first and third quartiles of the data. The points outside of box plot whiskers are outliers. Statistical analysis was performed using a linear mixed model and its coefficient and significance (FDR-adjusted P values) are shown (Supplementary Table 7). d, A significant, positive relationship was observed between the abundance of BtSULT homologs and Ch-S concentrations in fecal samples from the HMP2 cohort based on linear regression analysis (n=400 participants). Regression fit is shown as a solid line (red) with dashed lines (red) indicating the confidence intervals at 99%. Statistics are shown in Supplementary Table 8.
Fig. 1 |
Fig. 1 |. The human gut bacterium B. thetaiotaomicron VPI-5482 (B. theta) transforms cholesterol (Ch) to cholesterol sulfate (Ch-S) in monocolonized GF mice.
a, Sulfotransferase (SULT) enzymes utilize the cofactor 3’-phosphoadenosine-5’-phosphosulfate (PAPS) to catalyze the sulfonation of a substrate such as cholesterol (Ch), resulting in the formation of a sulfate ester product (cholesterol-sulfate, Ch-S). The sulfate group is highlighted with red text. SULTs have been characterized in mammals and certain environmental and pathogenic prokaryotes but have not yet been characterized in human-associated commensal bacteria. b, Design of monocolonization mouse experiment. GF B6 mice were either colonized with B. theta or were left in the GF state. Following confirmation of bacterial colonization, mice were fed a high-fat diet for 4 weeks. Ileum, liver, and cecal contents were then collected for UPLC-MS analysis and gene expression analyses. c, Levels of Ch-S in cecal contents were higher in B. theta-colonized mice than in GF mice (n=8 mice per group, two-tailed Welch’s t test). d, No significant differences in the expression of the host gene Sult2b1b were observed in the distal ileum or liver of B. theta-monocolonized mice compared to GF mice as measured by quantitative PCR (n=8 mice per group, two-tailed Welch’s t test, n.s. = not significant). e, B. theta converted Ch to Ch-S in culture. B. theta was incubated with Ch (100 μM) for 48 h and Ch-S production was quantified by UPLC-MS. (n=3 biological replicates). All data are presented as mean ± SEM.
Fig. 2 |
Fig. 2 |. A biosynthetic gene cluster in human gut bacteria converts Ch to Ch-S.
a, Biosynthetic gene cluster containing cys genes as well as a putative sulfotransferase in B. theta. After transport of sulfate into the bacterial cell, ATP sulfurylase (CysD&N) catalyzes the conversion of ATP and sulfate to APS. APS kinase (CysC) 3’-phosphorylates APS to generate PAPS. Finally, SULT (BT0416) catalyzes the transformation of Ch to Ch-S. b, Representative extracted ion chromatogram (EIC) traces (left) and quantified production of Ch-S (right) by B. theta WT, Δsult, and Δsult_sult+ show sult-dependent Ch-S production. Data are presented as mean ± S.E.M (n=6 from two pooled experiments). c, In vitro reconstruction of the BtSULT pathway using purified enzymes with precursor molecule production coupled to BtSULT activity. Conditions 1–5 demonstrate that BtSULT utilizes PAPS as a sulfonate source (1), can use APS under non-ideal conditions (2), and BtSULT, Ch, and a cofactor are required for sulfonation (3–5). Conditions 6–11 demonstrate that CysC catalyzes the conversion of APS and ATP to PAPS (6) and ATP, APS, and CysC are each necessary to catalyze PAPS formation (8, 9, and 10). Conditions 12–17 represent the complete biosynthetic pathway, showing that CysD&N, CysC, GTP, and ATP can form PAPS (12). Filled boxes indicate the presence BtSULT (red), CysC (blue), CysD (green), CysN (orange), pyrophosphatase (grey), and small molecules (black) in a given reaction. Data are presented as mean ± S.E.M (n=3 replicates per reaction). d, Illustration of 362 total putative SULTs (60% identity across sequenced bacterial genomes) retrieved from the NCBI database. The outer ring displays the relative distribution at the phylum level. The inner circle shows class level distribution. The number of bacteria for each genus has been indicated next to the genus name. e, Metagenomic prevalence of the BT0416 gene in representative samples from the 10 largest collections shows BT0416 presence at varying levels across collections, with greater than 50% occurrence in more than half the available collections. f, Representative EIC traces (left) and quantified Ch-S production (right) by P. merdae WT and Δsult show sult-dependent Ch-S production. Data are presented as mean ± S.E.M (n = 6 from two pooled experiments).
Fig. 3 |
Fig. 3 |. Characterization of selective SULT activity in human gut bacteria.
a, Library of substrates tested for conversion by BtSULT. Positive substrates (red) that were sulfonated include compounds with a flat 5α trans-fused steroidal ring system and compounds with a flat 5-ene A/B ring fusion. Negative substrates (blue) that were not sulfonated include compounds with bent, 5β cis-fused ring systems. b, In vitro incubation of substrates (30 μM) with either B. theta (48 hours) or purified BtSULT (0.5 hours and 4 hours) resulted in conversion of flat A/B ring substrates to their sulfonated forms (n=3 biological replicates). Normalized intensities are presented (area under the curve of the extracted ion chromatogram (EIC)) and normalized to the internal standard glycocholic acid (GCA). Data are presented as mean ± S.E.M. c, Three dimensional structural representations of the different A/B ring conformations tested against BtSULT. Substrate structures accepted include flat trans- and 5-ene compounds, while structures either not sulfonated or sulfonated less efficiently include bent cis-fused structures. Red text highlights favored substrate configuration. d, Three dimensional structural representations of the different LCA isomers, including bent (LCA and isoLCA) and flat (alloLCA and isoalloLCA) ring conformations, as well as the 5-ene flat structure of cholesterol. Red text highlights favored substrate configuration.
Fig. 4 |
Fig. 4 |. Ch-S is produced by BtSULT in vivo
a, Design of BtSULT monocolonization experiment. GF B6 mice were colonized with B. theta WT, Δsult, Δsult_sult+ or were left in the GF state and fed a normal chow diet for 7 days. Fecal samples were collected on day 2 for bacterial colonization check. Ch-S levels were analyzed from day 3 fecal materials and cecal samples upon sacrifice on day 7 using UPLC-MS. b, No significant differences in colonization efficiency were observed among B. theta strains (GF and B.theta WT groups, n=5, B.theta sult KO and B.theta sult KO complemented groups, n=6, results pooled from two separate experiments, data are presented as mean ± SEM, one-way ANOVA with Dunnett’s multiple comparison test. There were no detectable copy numbers from the GF group.). c, Left, Ch-S levels in fecal samples (day 3) from mice colonized with B. theta WT or B. theta Δsult_sult+ were significantly higher than Ch-S levels in GF mice or B. theta KO colonized mice (GF, n=9; B.theta WT, n=8, B.theta sult KO, n=9, B.theta sult KO complement, n=6, results pooled from three separate experiments, data are presented as mean ± SEM, one-way ANOVA followed by Dunnett’s multiple comparison test). Right, Ch-S levels in cecal contents of mice monocolonized with B. theta WT were significantly higher than Ch-S levels in GF or B. theta KO-colonized mice (GF, n=7, B.theta WT, n=5, B.theta sult KO and B.theta sult KO complemented groups, n=6, results pooled from three separate experiments, data are presented as mean ± SEM, one-way ANOVA followed by Tukey’s multiple comparisons).
Fig. 5 |
Fig. 5 |. BtSULT modulates immune cell trafficking and is negatively correlated with IBD in patients
a, Ch-S treatment reduced CCL21-induced leukocyte migration. Splenocytes were treated with vehicle, Ch, or Ch-S at indicated concentrations. The percentage of migrated leukocytes (CD90.2+) in the lower versus the upper chamber was evaluated after 6 hours. (n=3 biological replicates per condition, data are presented as mean ± S.D, one-way ANOVA followed by Tukey’s multiple comparison test, n.s.=not significant). b, Transwell chemotaxis assay was performed similarly to a) cells were incubated with the following supernatants; BHI+Ch (BHI media+Ch), PmWT+Ch (P. merdae wild-type, cultured with Ch), PmKO+Ch (P. merdae KO cultured with Ch), and PmWT (P. merdae wild-type without Ch) (n=6 biological replicates per condition, data pooled from two independent experiments, presented as mean ± S.D., one-way ANOVA followed by Tukey’s multiple comparison test, n.s=not significant). c, In the T cell transfer experiment, recipient mice were GF or monocolonized with B. theta WT or B. theta Δsult. CFSE-labeled naïve CD4 T-cells (CD45.1+ wild-type and CD45.2+ CCR7-deficient) were mixed and co-transferred into recipient mice. After 24h, cells were isolated from the spleens and MLNs of recipients, stained with antibodies against CD45, CD4, CD25, CD44, and CD62L. d, Migration of donor cell lymphocytes to MLNs, presented as the normalized ratio of migrated cells-to-MLN divided by spleen, was significantly impaired with B. theta WT (n=13) compared to GF (n=8) or B. thetaΔsult (n=12). Data pooled from three independent experiments, presented as mean ± S.D., with one-way ANOVA followed by Tukey’s multiple comparison test). e, The normalized abundances of APS kinase (BT0413), ATP sulfurylase (BT0414, BT0415), and sulfotransferase (BT0416) homologs were significantly depleted (FDR q-values < 0.05) in the dysbiotic states of both CD (50 patients) and UC (30 patients) subjects from the HMP2 cohort compared to their individual baselines (26 patients). The percentage of zeros is shown on the x axis. For the box plots, the center line indicates the median (second quartile) and the box limits indicate first and third quartiles of the data. The points outside of box plot whiskers are outliers. Statistical analysis was performed using a linear mixed model and its coefficient and significance (FDR-adjusted P values) are shown (Supplementary Table 6).

Comment in

References

    1. Liou CS et al. A Metabolic Pathway for Activation of Dietary Glucosinolates by a Human Gut Symbiont. Cell 180, 717–728.e19 (2020). - PMC - PubMed
    1. Ervin SM et al. Structural Insights into Endobiotic Reactivation by Human Gut Microbiome-Encoded Sulfatases. Biochemistry-us 59, 3939–3950 (2020). - PubMed
    1. Koppel N, Rekdal VM & Balskus EP Chemical transformation of xenobiotics by the human gut microbiota. Science 356, 2770 (2017). - PMC - PubMed
    1. Jancova P, Anzenbacher P & Anzenbacherova E PHASE II DRUG METABOLIZING ENZYMES. Biomed Pap 154, 103–116 (2010). - PubMed
    1. Lindsay J, Wang LL, Li Y & Zhou SF Structure, function and polymorphism of human cytosolic sulfotransferases. Curr Drug Metab 9, 99–105 (2008). - PubMed

Publication types

Substances

LinkOut - more resources