. 2022 Nov;292(5):816-828.
doi: 10.1111/joim.13549. Epub 2022 Aug 18.

Persistent T-cell exhaustion in relation to prolonged pulmonary pathology and death after severe COVID-19: Results from two Norwegian cohort studies

Affiliations

Persistent T-cell exhaustion in relation to prolonged pulmonary pathology and death after severe COVID-19: Results from two Norwegian cohort studies

Marius Trøseid et al. J Intern Med. 2022 Nov.

Abstract

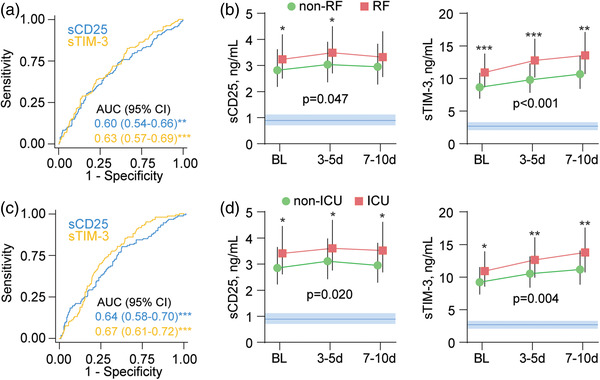
Background: T-cell activation is associated with an adverse outcome in COVID-19, but whether T-cell activation and exhaustion relate to persistent respiratory dysfunction and death is unknown.

Objectives: To investigate whether T-cell activation and exhaustion persist and are associated with prolonged respiratory dysfunction and death after hospitalization for COVID-19.

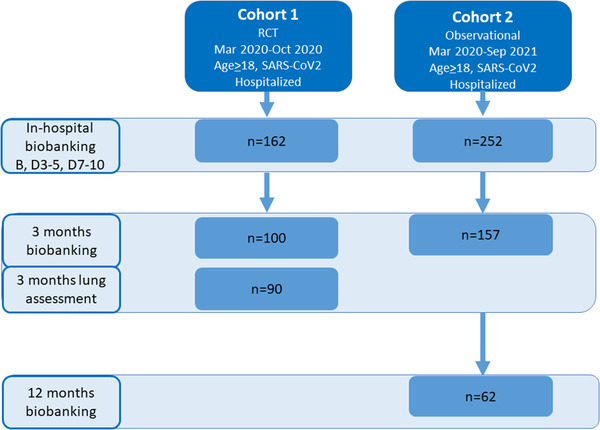
Methods: Plasma and serum from two Norwegian cohorts of hospitalized patients with COVID-19 (n = 414) were analyzed for soluble (s) markers of T-cell activation (sCD25) and exhaustion (sTim-3) during hospitalization and follow-up.

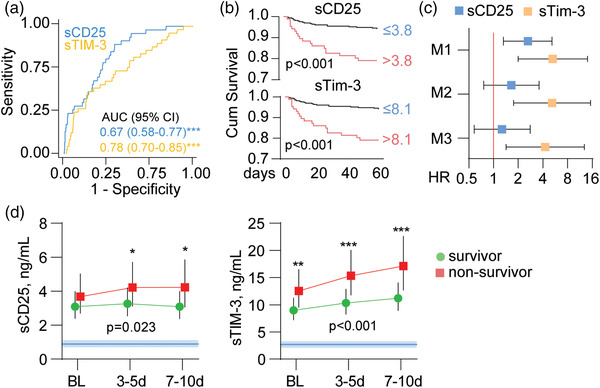
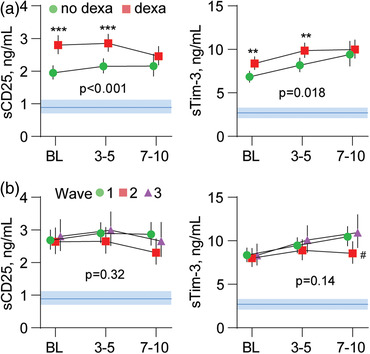
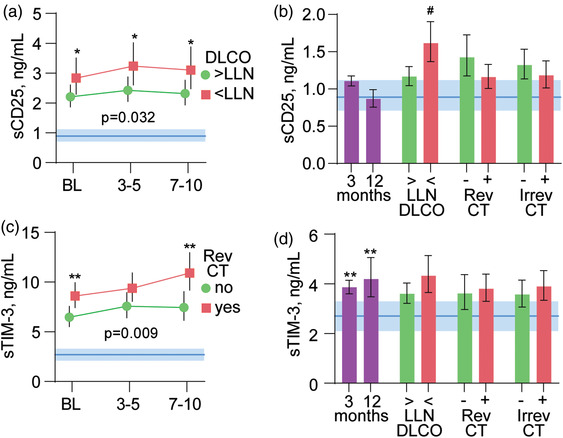
Results: Both markers were strongly associated with acute respiratory failure, but only sTim-3 was independently associated with 60-day mortality. Levels of sTim-3 remained elevated 3 and 12 months after hospitalization and were associated with pulmonary radiological pathology after 3 months.

Conclusion: Our findings suggest prolonged T-cell exhaustion is an important immunological sequela, potentially related to long-term outcomes after severe COVID-19.

Keywords: NOR-Solidarity; SARS-CoV-2; T-cell activation; T-cell exhaustion; pulmonary function.


Conflict of interest statement

The authors declare that there is no conflict of interest that could be perceived as prejudicing the impartiality of the research reported.

Figures

Fig. 1
Fig. 1
Flow chart showing the assessment of participants from the two cohorts during hospitalization, at 3‐month follow‐up, and at 12‐month follow‐up. Additionally, at 3‐month follow‐up, T cells from six participants in cohort 1 were included for transcriptomic analyses. B, baseline; D, day.
Fig. 2
Fig. 2
sCD25 and sTim‐3 in relation to respiratory failure (RF) and intensive care unit (ICU) admission. Receiver operating characteristic (ROC) analysis of admission levels of sCD25 and sTim‐3 in relation to (a) RF and (c) ICU admission. Temporal profile of sCD25 and sTim‐3 according to (b) RF or (d) ICU admission during the first 10 days after admission shown as estimated marginal means and 95% confidence intervals (CI), shown as red or green area. The p‐values reflect the group (outcome) effect from the linear mixed models adjusted for COVID wave, dexamethasone treatment, obesity, neutrophil count, and lymphocyte count. Blue areas reflect reference ranges from 21 healthy controls. *p < 0.05, **p < 0.01, ***p < 0.001 between groups.
Fig. 3
Fig. 3
sCD25 and sTim‐3 and 60‐day mortality in severe COVID‐19. (a) Receiver operating characteristic (ROC) analysis of admission levels of sCD25 and sTim‐3 in relation to 60‐day mortality, (b) Kaplan–Meier analysis of 60‐day mortality (n = 31) according to dichotomized admission levels of sCD25 (Youden's index cut off: 3.8 ng/ml) and sTim‐3 (Youden's index cut off: 8.1 ng/ml). (c) Cox regression of admission levels of sCD25 and sTim‐3 (dichotomized according to Youden's index as in b) in relation to 60‐day mortality with different levels of adjustment (M1: age, COVID wave, and dexamethasone treatment; M2: M1 + chronic cardiac and pulmonary disease, neutrophil count and lymphocyte count, and estimated glomerular filtration rate; M3: M2 + C‐reactive protein). (d) Temporal profile of sCD25 and sTim‐3 during the first 10 days after admission according to 60‐day mortality shown as estimated marginal means and 95% confidence intervals (CI) with adjustment for M2 from c. The p‐values reflect the group (outcome) effect from the linear mixed models. Blue areas reflect reference ranges from 21 healthy controls. **p < 0.01, ***p < 0.001 between groups.
Fig. 4
Fig. 4
Temporal profile of sCD25 and sTim‐3 according to (a) dexamethasone treatment and (b) COVID‐19 wave, shown. The p‐values reflect the group (outcome) effect from the linear mixed models. Data are presented as estimated marginal means and 95% confidence intervals (CI) in age‐ and sex‐adjusted analysis. Blue areas reflect reference ranges from 21 healthy controls. **p < 0.01, ***p < 0.001 between groups; #p < 0.05 versus waves 1 and 3.
Fig. 5
Fig. 5
sCD25 and sTim‐3 at follow‐up and in relation to pulmonary pathology. Temporal profile of (a) sCD25 and (c) sTim‐3 during the first 10 days after admission according to impaired diffusing capacity of the lungs for carbon monoxide (DLCO, above or below the lower limit of normal [LLN]) or reversible (Rev) or irreversible (Irrev) computed tomography (CT) changes at 3‐month follow‐up. The p‐values reflect the group (outcome) effect from the linear mixed models adjusting for randomized treatment, age, sex, and neutrophil counts. Blue areas in panels a and c reflect the reference value range. *p < 0.05, **p < 0.01 between groups. Panels b and d (left part) show levels of sCD25 (b) and sTim‐3 (d) at 3 and 12 months (n = 257) compared with healthy controls (n = 21). The right parts of panels b and d show levels of sCD25 (b) and sTim‐3 (d) at 3 months in relation to DLCO below or above LLN and reversible and irreversible CT changes at 3 months. #p < 0.01 versus DLCO < LLN.

References

    1. Giamarellos‐Bourboulis EJ, Netea MG, Rovina N, Akinosoglou K, Antoniadou A, Antonakos N, et al. Complex immune dysregulation in COVID‐19 patients with severe respiratory failure. Cell Host Microbe. 2020;27:992–1000.e3. - PMC - PubMed
    1. Del Valle DM, Kim‐Schulze S, Huang H‐H, Beckmann ND, Nirenberg S, Wang B, et al. An inflammatory cytokine signature predicts COVID‐19 severity and survival. Nat Med. 2020;26:1636–43. - PMC - PubMed
    1. Huang I, Pranata R. Lymphopenia in severe coronavirus disease‐2019 (COVID‐19): systematic review and meta‐analysis. J Intensive Care. 2020;8:36. - PMC - PubMed
    1. Diao B, Wang C, Tan Y, Chen X, Liu Y, Ning L, et al. Reduction and functional exhaustion of T cells in patients with coronavirus disease 2019 (COVID‐19). Front Immunol. 2020;11:827. - PMC - PubMed
    1. Klenerman P, Hill A. T cells and viral persistence: lessons from diverse infections. Nat Immunol. 2005;6:873–9. - PubMed

Publication types