[Preprint]. 2022 Aug 10:2022.08.05.22278483.
doi: 10.1101/2022.08.05.22278483.

Antibody feedback regulation of memory B cell development in SARS-CoV-2 mRNA vaccination

Affiliations

Antibody feedback regulation of memory B cell development in SARS-CoV-2 mRNA vaccination

Dennis Schaefer-Babajew et al. medRxiv. .

Update in

  • Antibody feedback regulates immune memory after SARS-CoV-2 mRNA vaccination.
    Schaefer-Babajew D, Wang Z, Muecksch F, Cho A, Loewe M, Cipolla M, Raspe R, Johnson B, Canis M, DaSilva J, Ramos V, Turroja M, Millard KG, Schmidt F, Witte L, Dizon J, Shimeliovich I, Yao KH, Oliveira TY, Gazumyan A, Gaebler C, Bieniasz PD, Hatziioannou T, Caskey M, Nussenzweig MC. Schaefer-Babajew D, et al. Nature. 2023 Jan;613(7945):735-742. doi: 10.1038/s41586-022-05609-w. Epub 2022 Dec 6. Nature. 2023. PMID: 36473496 Free PMC article.

Abstract

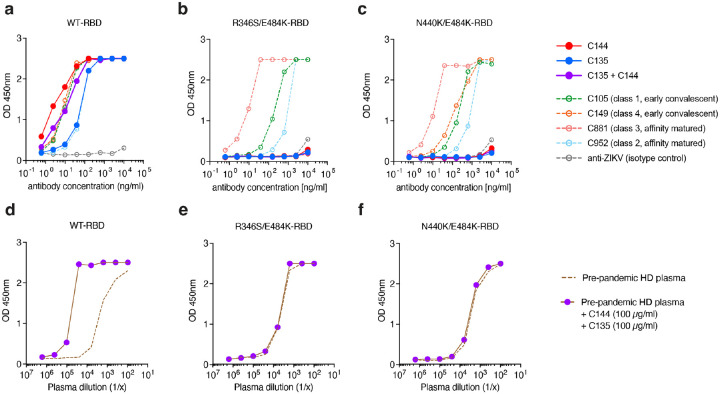
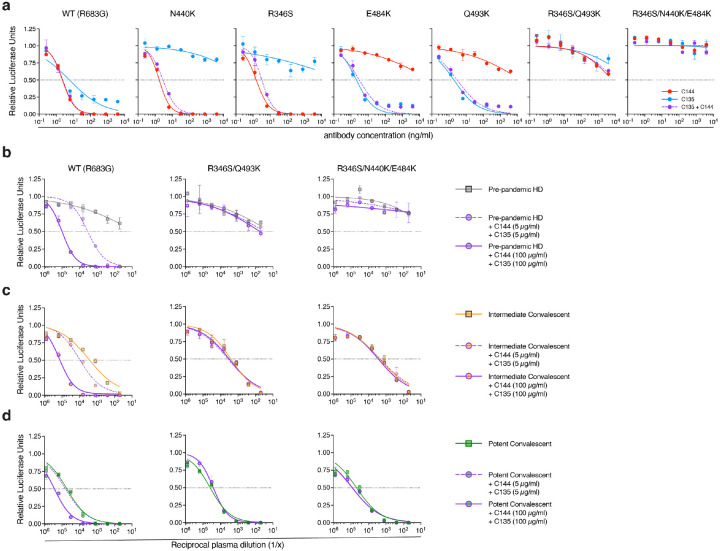
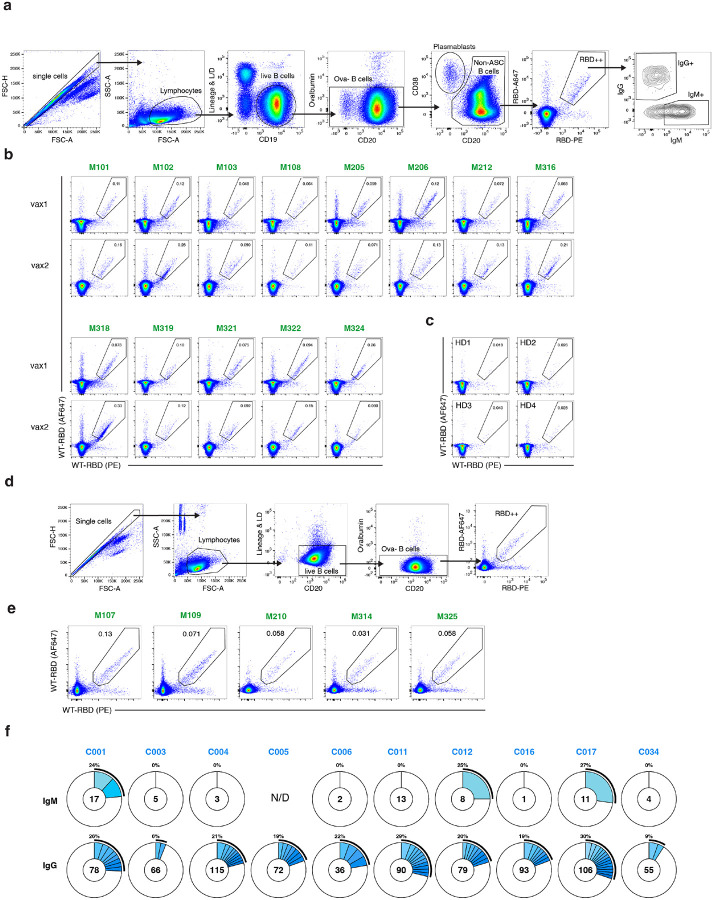
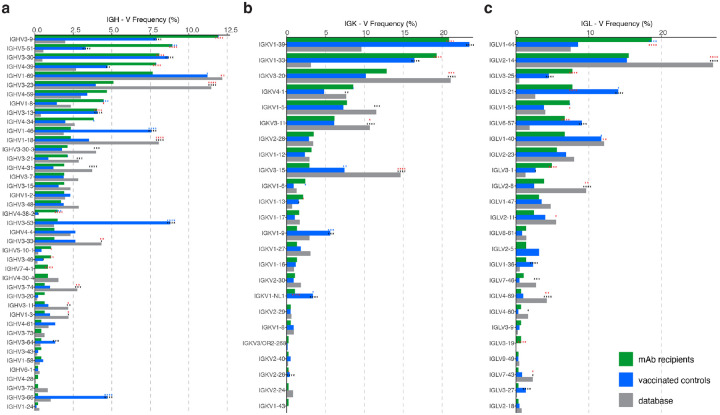
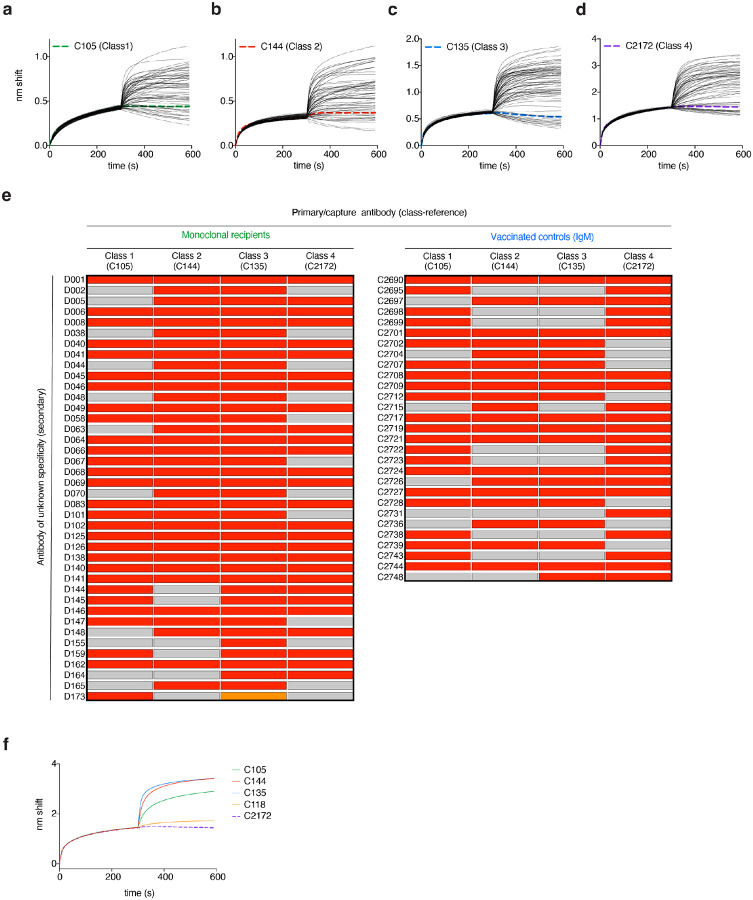
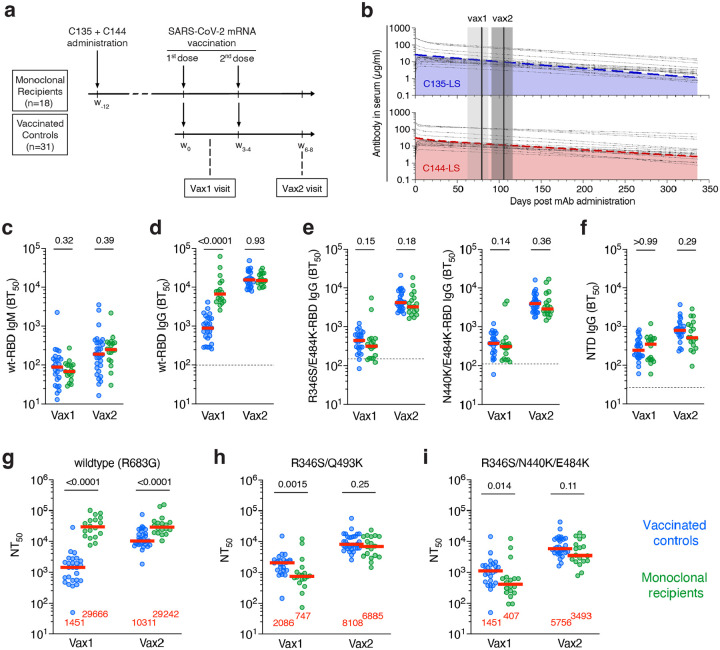
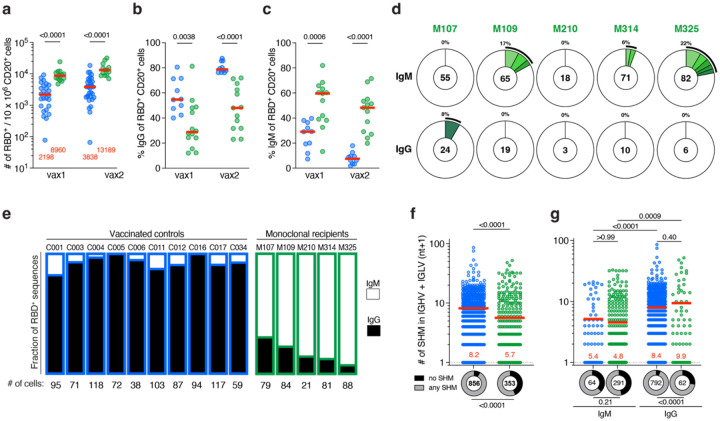
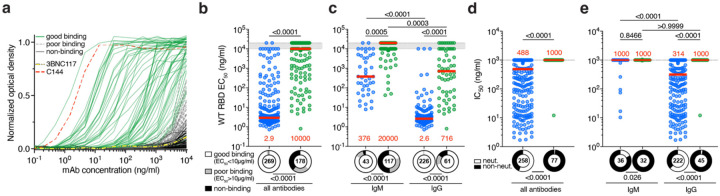
Feedback inhibition of humoral immunity by antibodies was initially documented in guinea pigs by Theobald Smith in 1909, who showed that passive administration of excess anti-Diphtheria toxin inhibited immune responses1. Subsequent work documented that antibodies can enhance or inhibit immune responses depending on antibody isotype, affinity, the physical nature of the antigen, and engagement of immunoglobulin (Fc) and complement (C') receptors2,3. However, little is known about how pre-existing antibodies might influence the subsequent development of memory B cells. Here we examined the memory B cell response in individuals who received two high-affinity IgG1 anti-SARS-CoV-2 receptor binding domain (RBD)-specific monoclonal antibodies, C144-LS and C135-LS, and subsequently two doses of a SARS-CoV-2 mRNA vaccine. The two antibodies target Class 2 and 3 epitopes that dominate the initial immune response to SARS-CoV-2 infection and mRNA vaccination4-8. Antibody responses to the vaccine in C144-LS and C135-LS recipients produced plasma antigen binding and neutralizing titers that were fractionally lower but not statistically different to controls. In contrast, memory B cells enumerated by flow cytometry after the second vaccine dose were present in higher numbers than in controls. However, the memory B cells that developed in antibody recipients differed from controls in that they were not enriched in VH3-53, VH1-46 and VH3-66 genes and predominantly expressed low-affinity IgM antibodies that carried small numbers of somatic mutations. These antibodies showed altered RBD target specificity consistent with epitope masking, and only 1 out of 77 anti-RBD memory antibodies tested neutralized the virus. The results indicate that pre-existing high-affinity antibodies bias memory B cell selection and have a profound effect on the development of immunological memory in humans that may in part explain the shifting target profile of memory antibodies elicited by the 3rd mRNA vaccine dose.


Figures

Extended Data Fig. 1:
Extended Data Fig. 1:. Mutant RBDs selectively abrogate binding by C135 and C144.
Monoclonal antibody binding to mutant forms of RBD. a-c, Graphs show concentration-dependent antibody binding to (a) WT, (b) R436S/E484K, and (c) N440K/E484K RBDs by C144, C135, and Class 1 (C105), Class 2 (C952), Class 3 (C881), and Class 4 (C149),,,. d-f, Graphs show concentration dependent pre-pandemic healthy donor plasma binding to (d) WT, (e) R436S/E484K, and (e) N440K/E484K RBDs in the presence (purple) or absence (dotted lines) of 100μg/ml of C135 and C144. Addition of C144 and C135 to plasma increases the binding activity of plasma against the WT but not the 2 mutant RBDs.
Extended Data Fig. 2:
Extended Data Fig. 2:. SARS-CoV-2 R346S/Q493K and R346S/N440K/E484K pseudotype virus neutralization by C135-LS and C144-LS.
a, Graphs show concentration-dependent neutralization curves for SARS-CoV-2 pseudoviruses by monoclonal antibodies. C144 (red), C135 (blue), and their equimolar combination (purple). b, Pre-pandemic plasma (squares) neutralization of WT or R346S/Q493K or R346S/N440K/E484K pseudoviruses in the absence or presence of 5 (purple dashed circles) or 100μg/ml (purple solid circles) of C135 and C144. c-d, As in (b) but for convalescent plasma with intermediate (c, COV157) or strong (d, COV31) neutralizing activity. The horizontal lines in all panels indicate half-maximal neutralization.
Extended Data Fig. 3:
Extended Data Fig. 3:. Flow cytometry, single-cell sorting and BCR sequencing
a, Gating strategy for flow-cytometry phenotyping. Gating was on single lymphocytes that were CD19+ and CD20+, and CD3 CD8 CD16 Ova without uptake of live-dead dye (L/D). Antigen-specific cells were those with dual binding to Wuhan-Hu1 RBD-PE and RBD-AF647. Anti-IgG, -IgM were used to phenotype dual RBD-labelled B cells. b,c, Representative flow cytometry plots of Wuhan Hu-1 RBD-binding memory B cells from 13 mAb recipients after one and two doses of vaccination (b) and pre-pandemic health donors (c) serving as negative controls. Numbers in RBD-gate denote percentage of RBD dual-labelled cells of parent gate (see a). Corresponding flow-cytometry plots and gating strategy for vaccinated controls can be found in d, Gating strategy for single-cell sorting of RBD-specific memory B cells. Dual-labelled (RBD-PE+/−AF647+) CD20+ CD3 CD8 CD16 Ova cells were sorted. e, Representative flow cytometry plots show RBD-binding cells that were sorted from 5 mAb recipients (Fig. 2g). f, Pie charts show the distribution of antibody sequences derived from cells isolated from 10 vaccinated control individual after vax2 (Fig 2h). The upper panel shows IgM, and the lower panel depicts IgG sequences,. The number in the inner circle indicates the number of sequences analyzed for the individual denoted above the circle. Slices colored in shades of blue indicate cells that are clonally expanded (same IGHV and IGLV genes, with highly similar CDR3s). Pie slice size is proportional to the number of clonally related sequences. The black outline and % value indicate the frequency of clonally expanded sequences detected within an individual. White pie areas indicate the proportion of sequences isolated only once. For C005, there were no IgM transcripts amplified at the timepoint assayed.
Extended Data Fig. 4:
Extended Data Fig. 4:. Frequency distribution of human V genes
a-c, Comparison of the frequency distribution of V gene usage for the IgH and IgL among antibodies isolated from mRNA-vaccinated mAb recipients (this study) and controls,, after vax2, and from database of shared clonotypes of human antibodies from Soto et al. Graphs show relative abundance of human IGHV (a), IGKV (b), and IGLV (c) genes within the human V gene database (in grey, Sequence Read Archive accession SRP010970), antibodies isolated from mAb recipients (in green) or vaccinated controls (in blue). Colors of stars indicate levels of statistical significance for the following frequency comparisons: black – vaccinated controls vs. database; red – mAb recipients vs. database; blue – mAb recipients vs. vaccinated controls.
Extended Data Fig. 5:
Extended Data Fig. 5:. Competition BLI
a-d, BLI traces of antibodies assayed for competition with class-reference antibodies. Traces show initial association curve (antigen capture phase of the primary antibody) and subsequent addition of secondary antibodies of unknown class. Thin solid black lines represent antibodies isolated from mAb recipients or vaccinated controls. Thick dashed lines are self-competition traces of C105 (green in a), C144 (red in b), C135 (blue in c) and C2172 (purple in d) for classes 1–4, respectively. e, Heat-map of relative inhibition of secondary antibody binding to the preformed capture antibody-RBD complexes (grey=no binding, red=unimpaired binding, orange=indeterminate). The left panel shows antibodies from mAb recipients, while the right panel shows IgM antibodies from vaccinated controls isolated in this study (both after vax2). Details on IgG antibodies isolated from vaccinated controls can be found in,. f, BLI traces defining C2172 as Class 4. C2172 is the primary/capture antibody (in dashed purple). The addition of known class-defining antibodies C105 (in green, Class 18), C144 (in red, Class 28), C135 (in blue, Class 38), and C118 (in orange, Class 1/424) establish C2172 as a bona fide Class 4 antibody.
Fig. 1:
Fig. 1:. Study design and plasma antibody activity.
a, Schematic overview of the study design with markers (w) denoting weeks relative to the time of the first vaccine dose. b, Serum levels of C135-LS (upper panel, in blue) and C144-LS (lower panel, in red) over time are shown. The thick colored dashed lines indicate the median serum concentrations among mAb recipients (n=18), while the thin dotted black lines represent individual participants. The two solid vertical lines indicate the median and the grey shaded areas the range of time from mAb administration. c-f, Half-maximal plasma binding titers (BT50) to RBD after one (vax1) and two doses (vax2) mRNA vaccinations for monoclonal antibody recipients (n=18, in green) and controls (n=26, in blue). Each dot represents one individual. Dashed horizontal lines represent the median binding activity of healthy pre-pandemic plasma samples, which served as negative controls. c,d, IgM (c) and IgG (d) binding titers to WT RBD. e, IgG binding to R346S/E484K (left panel) and N440K/E484K RBDs, see also Ext. Data Fig 1. f, IgG binding to the NTD. g-i, Plasma half-maximal neutralizing titers (NT50s) against HIV-1 pseudotyped with g, SARS-CoV-2 WT S. h, R346S/Q493K mutant S. (i) R346S/N440K/E484K mutant S (see also Ext. Data Fig 2). The S protein in the pseudoviruses in g-i contained an R683G substitution. Red horizontal bars in c-i and red numbers in g-i represent median values. Statistical significance in c-i was determined using the two-tailed Mann-Whitney test comparing differences between monoclonal recipients and controls for each time point independently. All experiments were performed at least in duplicate.
Fig. 2:
Fig. 2:. Anti-SARS-CoV-2 RBD memory B cells from vaccinated monoclonal recipients.
a-c, Flow-cytometric enumeration and surface immunoglobulin expression of SARS-CoV-2 RBD-specific memory B cells after vax1 and vax2. mAb recipients (green, n=18 in panel a, n=13 in panels b and c) and controls, (blue, n=26 for vax1 and n=31 for vax2 in panel a, and n=10 in panels b,c). Each dot represents one individual and red horizontal bars (and numbers in panel a) depict median values. a, Number of WT RBD-specific memory B cells per 10 million CD20+ B cells (see also Ext. Data Fig 3a and b). b,c, Percentage of cells among WT RBD-binding CD20+ B cells that express cell surface IgG (b) or IgM (c). d, Pie charts show the distribution of antibody sequences derived from cells isolated from 5 vaccinated monoclonal recipients after vax2 (see also Ext. Data Fig 3d and e). The upper panel shows IgM, and the lower panel depicts IgG. The number in the inner circle indicates the number of sequences analyzed for the individual denoted above the circle. Slices colored in shades of green indicate cells that are clonally expanded (same IGHV and IGLV genes, with highly similar CDR3s) within an individual. Pie slice size is proportional to the number of clonally related sequences. The black outline and % value indicate the frequency of clonally expanded sequences detected within an individual. White pie areas indicate the proportion of sequences isolated only once. e, Fraction of cells harboring IgG (black) vs IgM (white) transcripts from the indicated individuals (mAb recipients outlined in green, and controls in blue). See also Ext Data Fig. 3f and,). f,g, Somatic hypermutation (SHM) shown as combined heavy- and light-chain variable region nucleotide substitutions plus one (IGVH+IGVL+1), with each dot representing one sequence from mAb recipients (green) or controls (blue). Ring plots below each column show the fraction of sequences with no (IGVH+IGVL+1 = 1) vs. any (IGVH+IGVL+1 > 1) SHM, and the number in the circle indicates the number of sequences analyzed, (f) for all cells irrespective of isotype, (g) IgM and IgG analyzed independently. Red horizontal bars and numbers in f and g indicate mean values. Statistical significance was determined using the two-tailed Mann-Whitney test comparing differences between monoclonal recipients and controls for a-c and f, the Kruskal-Wallis test with subsequent Dunn’s correction for multiple comparisons was used for g, and Fisher’s exact test was used to compare fractions in f and g.
Fig. 3:
Fig. 3:. Functional characterization of anti-SARS-CoV-2 RBD memory antibodies from vaccinated mAb recipients.
a-c, Monoclonal antibody binding to WT RBD. a, Graph shows ELISA binding monoclonal antibodies derived from mAb recipients after serial dilution. Each curve represents one antibody. Green curves show EC50s <10 μg/ml, grey dashed lines EC50s >10 μg/ml, solid black lines are antibodies that were below or equal to a negative control anti-HIV1 antibody 3BNC117 (thick, white-dashed line). C144 (thick, red-dashed line) is positive control. b Summary of EC50s derived from (a) mAb recipients in green, and controls in blue for all antibodies irrespective of isotype. c, as in (b) but IgM and IgG analyzed independently. Grey shaded area between horizontal dotted lines indicates antibodies with EC50s >10 μg/ml (poor binding) and non-binding antibodies arbitrarily grouped at 10 and 20 μg/ml, respectively. Ring plots summarize the fraction of all antibodies tested for the respective groups (encircled number). d, Plots show IC50s for all monoclonal antibodies isolated from vaccinated mAb recipients (green) or controls (blue). Ring plots illustrate the fraction of non-neutralizing (IC50 > 1000 ng/ml) antibodies (black slices) among all antibodies tested for the respective group (encircled number). e, as in (d) but IgM and IgG antibodies analyzed independently. For panels b-e, red horizontal bars and numbers represent median values. Statistical significance was determined using the two-tailed Mann-Whitney test for b and d, whereas the Kruskal-Wallis test with subsequent Dunn’s correction for multiple comparisons was used for c and e. To compare fractions from ring plots, the Chi-squared contingency statistic was used in b and c, and Fisher’s exact test for d and e. All experiments were performed at least in duplicate.
Fig. 4:
Fig. 4:. Affinities and epitope distribution of anti-SARS-CoV-2 RBD memory antibodies from vaccinated mAb recipients.
a-g, Monoclonal antibody binding to monomeric and multimerized antigen by BLI. a, Schematic representation for monomeric binding measurements where IgG is immobilized on the biosensor chip and subsequently exposed to monomeric RBD (upper panel), and multimeric binding using 6P-stabilized WT SARS-CoV-2 S protein trimers that had been tetramerized using streptavidin (lower panel). b, Graphs show BLI traces obtained under monovalent conditions. Each curve represents one antibody. Colored solid lines denote binding above background represented by polyreactive antibody ED38 (dotted black line) and anti-HIV-1 antibody 3BNC117 (dashed black line). Grey lines show non-binding antibodies. C144 (thick, red-dashed line) is a positive control. Colored and grey numbers in upper left of each panel indicate the number of binding and non-binding antibodies, respectively. c, As in (b) for antibodies that showed no measurable binding in (b) and were subsequently tested for binding under polyvalent conditions. d, Bar charts show the percentage of binding antibodies under monovalent conditions for all antibodies and by isotype. Values below bars indicate the number of antibodies tested. e, as in (d) for antibodies shown in (c). f, Graphs show affinity constants (Kd) derived under monomeric binding conditions (b) for mAb recipients (green) and controls (blue) irrespective of isotype. Ring plots illustrate the fraction of antibodies tested for the respective group (encircled number) that measurably bound to monomeric RBD (“binding”, in white) and those for which a Kd value could not be established (“no Kd”, black). Red horizontal bars and numbers represent median values (N/D, not determined). g, as in (f) analyzed independently for IgM and IgG. h, Schematic representation of BLI competition experiment in which a capture antibody of known epitope-specificity (class-reference antibody) is bound to the biosensor chip and exposed to antigen. In a second step, the antibody of interested is added to the chip. i, Pie charts show the distribution of epitopes targeted. The number in the center is the number of antibodies tested. Slices colored in shades of red and blue represent Class 1, 2 and 3 or combined epitopes, shades of grey represent Class 4-containing epitopes or epitopes that could not be classified by this method. Statistical significance was determined using the two-tailed Mann-Whitney test for f, and the Kruskal-Wallis test with subsequent Dunn’s correction for multiple comparisons for g. To compare categories and distributions from ring plots, Fisher’s exact test was used for f and g, and the Chi-squared contingency statistic was used for panel i.

References

    1. Smith T. ACTIVE IMMUNITY PRODUCED BY SO CALLED BALANCED OR NEUTRAL MIXTURES OF DIPHTHERIA TOXIN AND ANTITOXIN. J Exp Medicine 11, 241–256, doi:10.1084/jem.11.2.241 (1909). - DOI - PMC - PubMed
    1. Heyman B. Regulation of Antibody Responses via Antibodies, Complement, and Fc Receptors. Annu Rev Immunol 18, 709–737, doi:10.1146/annurev.immunol.18.1.709 (2000). - DOI - PubMed
    1. Bournazos S. & Ravetch J. V. Fcgamma Receptor Function and the Design of Vaccination Strategies. Immunity 47, 224–233, doi:10.1016/j.immuni.2017.07.009 (2017). - DOI - PMC - PubMed
    1. Brouwer P. J. M. et al. Potent neutralizing antibodies from COVID-19 patients define multiple targets of vulnerability. Science 369, 643–650, doi:10.1126/science.abc5902 (2020). - DOI - PMC - PubMed
    1. Robbiani D. F. et al. Convergent antibody responses to SARS-CoV-2 in convalescent individuals. Nature 584, 437–442, doi:10.1038/s41586-020-2456-9 (2020). - DOI - PMC - PubMed

Publication types