. 2022 Jul 21;25(8):104813.
doi: 10.1016/j.isci.2022.104813. eCollection 2022 Aug 19.

A microengineered Brain-Chip to model neuroinflammation in humans

Affiliations

A microengineered Brain-Chip to model neuroinflammation in humans

Iosif Pediaditakis et al. iScience. .

Abstract

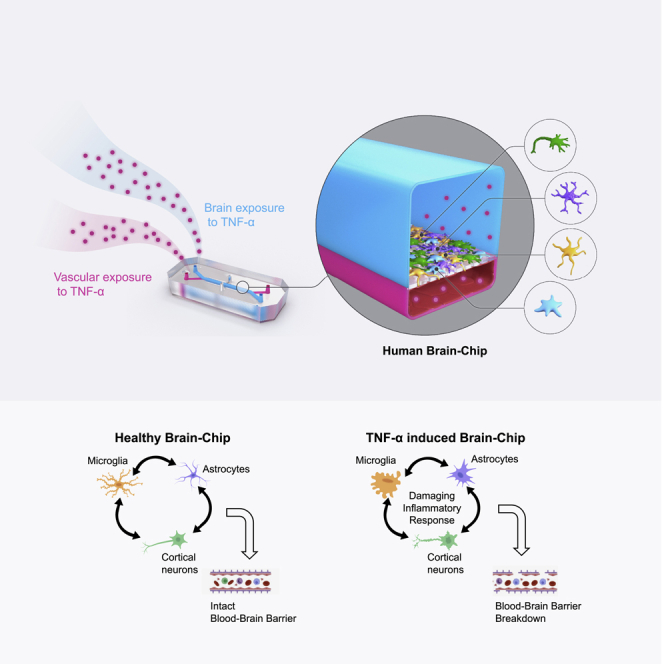
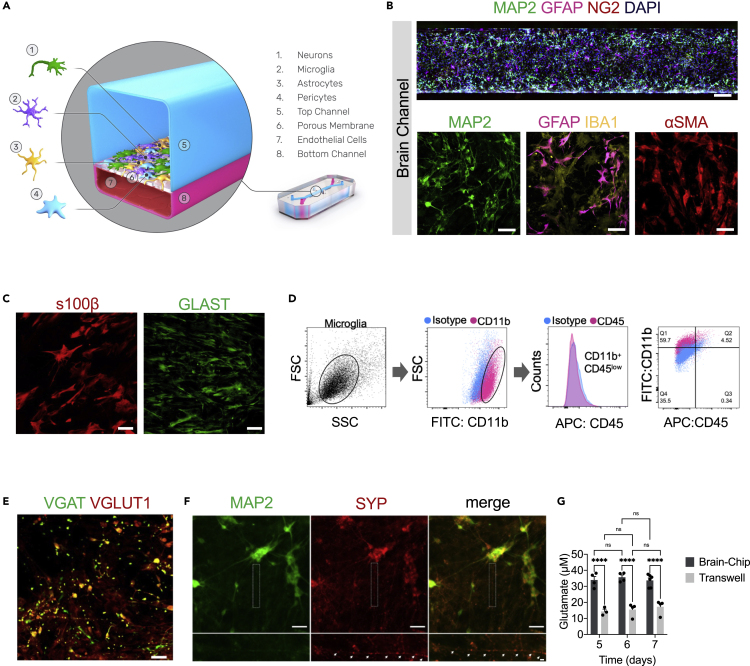
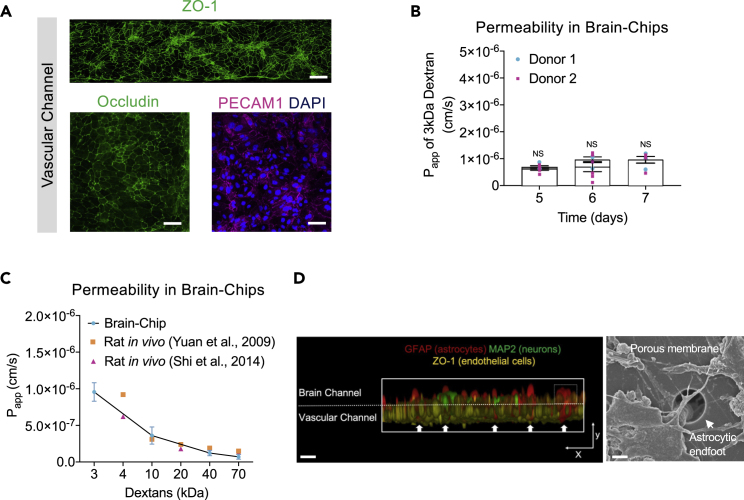
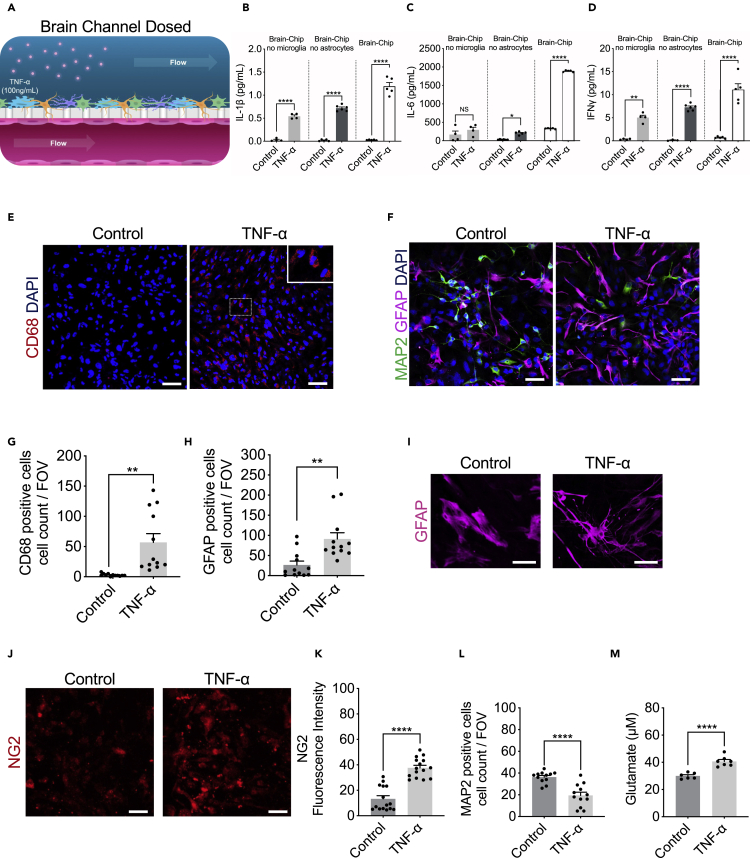
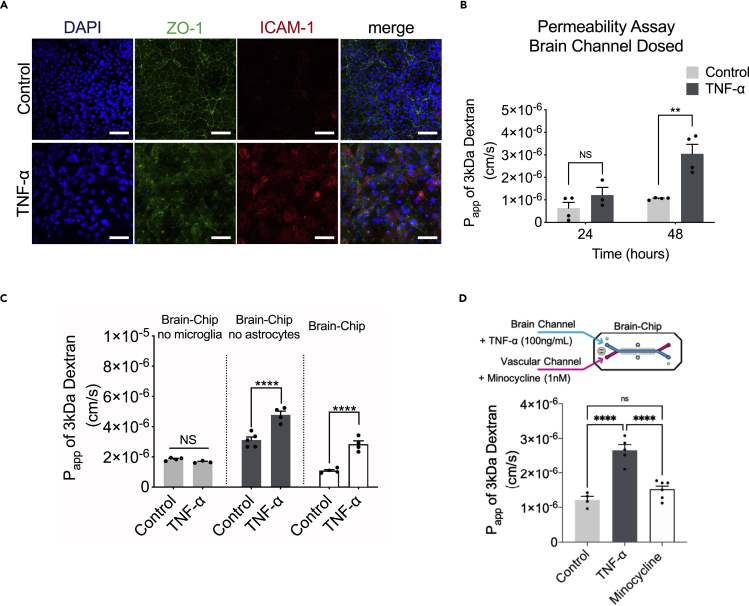
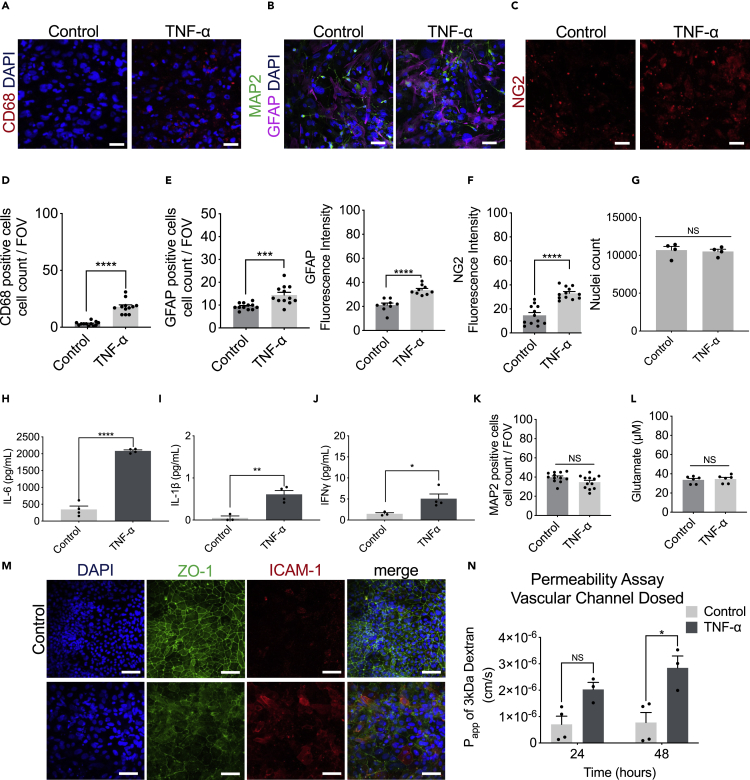
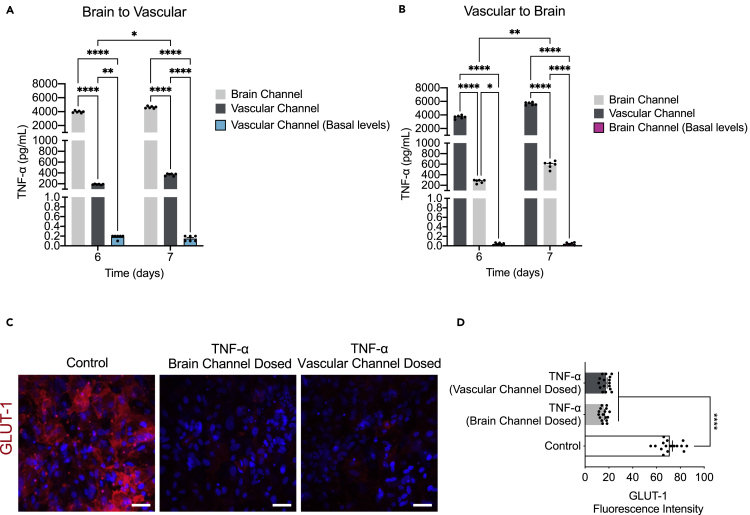
Species differences in brain and blood-brain barrier (BBB) biology hamper the translation of findings from animal models to humans, impeding the development of therapeutics for brain diseases. Here, we present a human organotypic microphysiological system (MPS) that includes endothelial-like cells, pericytes, glia, and cortical neurons and maintains BBB permeability at in vivo relevant levels. This human Brain-Chip engineered to recapitulate critical aspects of the complex interactions that mediate neuroinflammation and demonstrates significant improvements in clinical mimicry compared to previously reported similar MPS. In comparison to Transwell culture, the transcriptomic profiling of the Brain-Chip displayed significantly advanced similarity to the human adult cortex and enrichment in key neurobiological pathways. Exposure to TNF-α recreated the anticipated inflammatory environment shown by glia activation, increased release of proinflammatory cytokines, and compromised barrier permeability. We report the development of a robust brain MPS for mechanistic understanding of cell-cell interactions and BBB function during neuroinflammation.

Keywords: Biomedical engineering; Cellular neuroscience; Molecular neuroscience.


Conflict of interest statement

Patents covering all the main aspects of the use of human Brain-Chip as a model to study neuroinflammation have been filed by Emulate, Inc. (application numbers: US16/712,439 and PCT/US2020/056,245). The applications are currently pending. I.P., K.R.K., D.V.M., C.Y.L., S.B., A.S., L.E., C.D.H., and K.K. are current or former employees of Emulate, Inc and may hold equity interests in Emulate, Inc. All other authors declare no competing interests.

Figures

None
Graphical abstract
Figure 1
Figure 1
Reconstruction of the neurovascular unit in the Brain-Chip (A) Schematic illustration of the Brain-Chip, a two-channel microengineered chip including iPSC-derived brain endothelial-like cells cultured on all surfaces of the bottom channel, and iPSC-derived Glutamatergic and GABAergic neurons, primary human brain astrocytes, pericytes, and microglia on the surface of the top channel. (B) Confocal images of the cell coverage in the brain channel on day 7 of culture. Top image: Immunofluorescence staining of the brain channel including MAP2 (green), GFAP (magenta), NG2 (red), and DAPI (blue). Bottom images: Representative merged confocal image of the brain channel on culture day 7, stained for neurons (MAP2, green), astrocytes (GFAP, magenta, IBA1, yellow), and pericytes (αSMA, red) (bar, 50 μm). (C) Representative immunofluorescent staining for s100β (red) and GLAST (green) (bar,100 μm). (D) FACS analysis of cell-specific markers of microglia: Total population of microglia within the brain channel (gray), CD11b-positive population (magenta), CD45-positive population (magenta), quantification of CD11b:CD45-positive cells. (E) Representative merged confocal image of the brain channel co-stained with VGAT (green) for GABAergic neurons and VGlut1 (red) for Glutamatergic neurons (bar, 100 μm). (F) Immunofluorescence staining of the brain channel including MAP2 (green) and SYP (red) (bar, 100 μm). (G) Levels of secreted glutamate in the brain channel on culture days 5, 6, and 7 (n = four to six independent chips, ∗∗∗∗p < 0.0001, NS: not significant compared to the transwells group n = 3-4). Data are represented as mean ± SEM, statistical analysis by two-way ANOVA with Tukey’s multiple comparisons test.
Figure 2
Figure 2
Characterization of the barrier in the Brain-Chip (A) Top Image: Immunofluorescence staining of the vascular channel stained for the tight junction marker ZO-1 (green) (bar, 1 mm). Bottom Images: Immunofluorescence micrographs of the human brain endothelium cultured on-chip for 7 days labeled with occludin (green), PECAM1 (magenta), and DAPI (blue) (bar, 100 μm). (B) Quantitative barrier function analysis by the apparent permeability to 3kDa fluorescent dextran, in two independent iPSC donor lines on culture days 5, 6, and 7 (n = four to six independent chips). NS: not significant. Data are represented as mean ± SEM, statistical analysis by Student’s t-test. (C) The apparent permeability of different size dextran molecules (3-70 kDa) across Brain-Chips correlated with previously reported in vivo rodent brain uptake data. (n = three to five independent chips). Data are represented as mean ± SEM). (D) Left: Exploded view of the chip. Interaction of primary human astrocyte end-feet-like processes (GFAP, red) with endothelial-like cells (ZO-1, yellow), MAP2 (green) (bar, 200um). Right: Representative scanning electron microscopy (SEM) image showing astrocytic endfoot passing through 7 μm pores into the vascular channel (bar, 30um). White arrows show the astrocytic endfoot.
Figure 3
Figure 3
Comparative analyses of the transcriptomic profiles of the Brain-Chip, adult cortex tissue, and transwell culture (A) Principal component analysis (PCA) of RNAseq data from the brain channel of the Brain-Chip and the transwell brain cells culture on culture days 5 and 7 (n = 4 independent Brain-Chips (donor 1) per condition). The first two PCs explain the 47.47% of the total variance. (B) DGE analysis identified up (cyan)- and down (magenta)regulated genes (dots) in the Brain-Chip as compared to transwells on culture day 7. (C and D) Biological processes in Brain-Chip and transwells, as identified by Gene Ontology (GO) enrichment analysis based on the DE genes. (E) Boxplots summarizing the distributions of the corresponding pairwise TSD distances. In each pair, one sample belongs to the reference tissue (Human Brain-Cortex) and the other either to the reference tissue or to one of our culture models, i.e., Brain-Chip or transwell, from culture days 5 and 7. The Brain-Chip and transwell cultures were run in parallel. n = 4 independent Brain-Chips (donor 1); data are represented as mean ± SEM NS: Not Significant, ∗∗p < 0.01, ∗∗∗p < 0.001; statistical analysis with two-sample t-test using a null hypothesis that the data from human tissue and the data from chips or transwells comes from independent random samples from normal distributions with equal means and equal but unknown variances. On each box the red line indicates the median and the bottom and top edges correspond to the 25th and 75th percentiles, respectively. The whiskers extend to the most extreme but not considered outliers values.
Figure 4
Figure 4
Response of the Brain-Chip to neuroinflammation (A) Schematic illustration of the induction of neuroinflammation by perfusion of TNF-α through the brain channel. (B–D) Secreted levels of IL-1β, IL-6, and IFNγ in control or TNF-α-treated Brain-Chips including, or not, microglia and/or astrocytes. n = four to five independent chips; data are represented as mean ± SEM NS: Not Significant, ∗p < 0.05, ∗∗p < 0.01, ∗∗∗∗p < 0.0001; statistical analysis with Student’s t-test. (E and F) Representative immunofluorescent staining for microglia (CD68, red), neurons (MAP2, green), astrocytes (GFAP, magenta), and nuclei (DAPI, blue) in TNF-α-treated or control chips (bar, 100 nm). (G) Quantification of the CD68-positive events/field of view in four randomly selected different areas/chip, n = 3 Brain-Chips; data are represented as mean ± SEM, ∗∗p < 0.01 compared to the untreated control group, statistical analysis by Student’s t-test. (H) Quantification of the number of GFAP-positive and MAP2 events/field of view in n = 4 randomly selected different areas/chip, n = 3 Brain-Chips; data are represented as mean ± SEM, ∗∗p < 0.01, compared to the untreated control group; statistical analysis with Student’s t-test. (I) Immunofluorescence images show an example of the two types of astrocyte morphology in cultures (polygonal shape toward more elongated shape), after immunostaining with an antibody against GFAP (bar, 100 nm). (J) Representative immunofluorescent staining for pericytes (NG2, red) in TNF-α-treated or control chips (bar, 100 nm). (K) Quantification of NG2 fluorescent intensity in n = 5 randomly selected different areas/chip, n = 3 Brain-Chips; data are represented as mean ± SEM, ∗∗∗∗p < 0.0001 compared to the untreated control group; statistical analysis with Student’s t-test. (L) Quantification of the number of MAP2 events/field of view in n = 4 randomly selected different areas/chip, n = 3 Brain-Chips; data are represented as mean ± SEM, ∗∗∗∗p < 0.0001, compared to the untreated control group; statistical analysis with Student’s t-test. (M) Levels of secreted glutamate in the brain channel on culture day 7 (n = six to seven independent chips. ∗∗∗∗p < 0.0001, compared to the untreated group. Data are represented as mean ± SEM, statistical analysis by Student’s t-test.
Figure 5
Figure 5
Barrier changes during neuroinflammation (A) Representative merged image of immunofluorescent staining of intercellular adhesion molecule 1 (ICAM-1, red), tight junction protein 1 (ZO-1, green), and cell nuclei (DAPI, blue), (bar, 100 nm). (B) Quantification of barrier permeability to 3 kDa fluorescent dextran, upon 24 and 48 h of treatment with TNF-α; n = three to four independent chips. Data are expressed as mean ± SEM, NS: Not Significant, ∗∗p < 0.01, control compared to TNF-α-treated group; statistical analysis by two-way ANOVA followed by Tukey’s multiple comparisons test. (C) Assessment of the permeability of the Brain-Chip on culture day 7, in the absence or presence of microglia, astrocytes, or neurons; n = four to eight independent chips; data are represented as mean ± SEM, ∗∗∗∗p < 0.0001, NS: Not Significant compared to full model (Brain-Chip), statistical analysis by one-way ANOVA with Sidak’s multiple comparisons test. (D) Quantification of barrier apparent permeability to 3 kDa fluorescent dextran, upon 48 h of TNF-α-treated Brain-Chips including minocycline, or not (control); n = three to five independent chips. Data are represented as mean ± SEM, ∗∗∗∗p < 0.0001, NS: Not Significant compared to TNF-α-treated group or minocycline group; statistical analysis by Student’s t-test.
Figure 6
Figure 6
Brain-Chip response to TNF-α perfused through the vascular channel (A–C) Representative immunofluorescent staining for microglia (CD68, red), neurons (MAP2, green), astrocytes (GFAP, magenta), nuclei (DAPI, blue), and pericytes (NG2, red) in TNF-α-treated of control chips (bar, 100 nm). (D) Quantification of the CD68-positive events/field of view in n = 4 randomly selected different areas/chip, n = 3 Brain-Chips; data are represented as mean ± SEM, ∗∗∗∗p < 0.0001 compared to the untreated control group, statistical analysis by Student’s t-test. (E) (Left) Quantification of the number of GFAP-positive events/field of view in n = 4 randomly selected different areas/chip, n = 3 Brain-Chips; data are represented as mean ± SEM, ∗∗∗p < 0.001 compared to the untreated control group; statistical analysis with Student’s t-test. (Right) Quantification of GFAP fluorescent intensity in n = 3 randomly selected different areas/chip, n = 3 Brain-Chips, ∗∗∗∗p < 0.0001 compared to the untreated control group, statistical analysis with Student’s t-test. (F) Quantification of fluorescent intensity of NG2 in, n = 4, randomly selected different areas/chip, n = 3 Brain-Chips; data are represented as mean ± SEM, ∗∗∗∗p < 0.0001 compared to the untreated control group; statistical analysis with Student’s t-test. (G) The nuclei counts based on DAPI staining were similar between the control and treated groups (n = 4 Brain-Chips, data are represented as mean ± SEM, NS: Not Significant compared to the untreated control group). Statistical analysis with Student’s t-test. (H–J) Secreted levels of the proinflammatory cytokines IL-6, IL-1β, and IFNγ, in the brain channel of control or TNF-α-treated Brain-Chips. n = three to four independent chips, data are represented as mean ± SEM, p < 0.05, P∗∗<0.01, ∗∗∗∗p < 0.0001, statistical analysis with Student’s t-test. (K) Quantification of the number of MAP2 events/field of view in n = 4 randomly selected different areas/chip, n = 3 Brain-Chips, data are expressed as mean ± SEM, NS: Not Significant compared to the untreated control group, statistical analysis with Student’s t-test. (L) Levels of secreted glutamate in the brain channel on culture day 7 (n = 6 independent chips; data are represented as mean ± SEM, NS: Not Significant compared to the untreated control group). Statistical analysis with Student’s t-test. (M) Immunofluorescent staining of cell nuclei (DAPI, blue), intercellular adhesion molecule 1 (ICAM-1, red), tight junction protein 1 (ZO-1, green), and a merged image of all three markers (bar, 100 nm). (N) Quantitative barrier function analysis via apparent permeability to 3kDa fluorescent dextran, upon 48 h of exposure to TNF-α via the vascular channel. n = 3–4 independent chips, NS = Not Significant, ∗p < 0.05, control group compared to TNF-α-treated group after 24 and 48 h of treatment; data are represented as mean ± SEM, statistical analysis by two-way ANOVA with Tukey’s multiple comparisons test.
Figure 7
Figure 7
Impact of inflammation on barrier transport systems (A and B) The transport of TNF-α from the brain to vascular or vice versa was shown by assessment of the levels of TNF-α secreted in the vascular or brain channel of control (basal levels) or TNF-α dosed chips either through the brain (brain to vascular) or the vascular channel (vascular to brain), n = 6 independent chips, data are represented as mean ± SEM, P∗<0.05, P∗∗<0.01, ∗∗∗∗p < 0.0001, statistical analysis by two-way ANOVA with Tukey’s multiple comparisons test. (C) Representative immunofluorescence images of GLUT-1 transporter (red) expression and DAPI (blue), in the endothelial cells of the vascular channel of the Brain-Chip upon challenge with TNF-α through the brain or the vascular channels. Vehicle-treated chips serve as control (bar, 100 nm). (D) Quantification of the GLUT-1-fluorescence intensity/field of view in four randomly selected different areas/chip, n = 4 Brain-Chips; data are represented as mean ± SEM, ∗∗∗∗p < 0.0001 compared to the untreated control group, statistical analysis by two-way ANOVA with Tukey’s multiple comparisons test.

References

    1. Abbott N.J., Rönnbäck L., Hansson E. Astrocyte-endothelial interactions at the blood-brain barrier. Nat. Rev. Neurosci. 2006;7:41–53. doi: 10.1038/nrn1824. - DOI - PubMed
    1. Ahn S.I., Sei Y.J., Park H.J., Kim J., Ryu Y., Choi J.J., Sung H.J., MacDonald T.J., Levey A.I., Kim Y. Microengineered human blood–brain barrier platform for understanding nanoparticle transport mechanisms. Nat. Commun. 2020;11:175. - PMC - PubMed
    1. Wang A.L., Yu A.C.H., Lau L.T., Lee C., Wu L.M., Zhu X., Tso M.O.M. Minocycline inhibits LPS-induced retinal microglia activation. Neurochem. Int. 2005;47:152–158. doi: 10.1016/j.neuint.2005.04.018. - DOI - PubMed
    1. Alvarez J.I., Katayama T., Prat A. Glial influence on the blood brain barrier. Glia. 2013;61:1939–1958. doi: 10.1002/glia.22575. - DOI - PMC - PubMed
    1. Ashburner M., Ball C.A., Blake J.A., Botstein D., Butler H., Cherry J.M., Davis A.P., Dolinski K., Dwight S.S., Eppig J.T., et al. Gene ontology: Tool for the unification of biology. Nat. Genet. 2000;25:25–29. - PMC - PubMed