. 2022 Aug 2:13:957361.
doi: 10.3389/fimmu.2022.957361. eCollection 2022.

Serological biomarkers in autoimmune GFAP astrocytopathy

Affiliations

Serological biomarkers in autoimmune GFAP astrocytopathy

Cong-Cong Fu et al. Front Immunol. .

Abstract

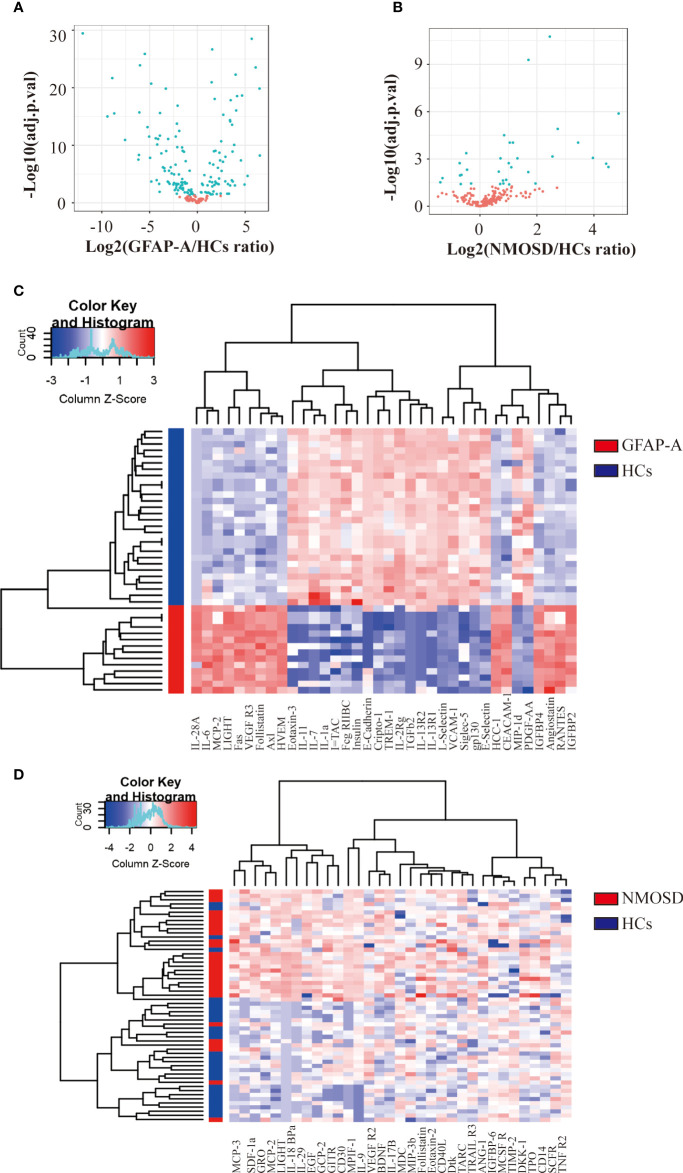
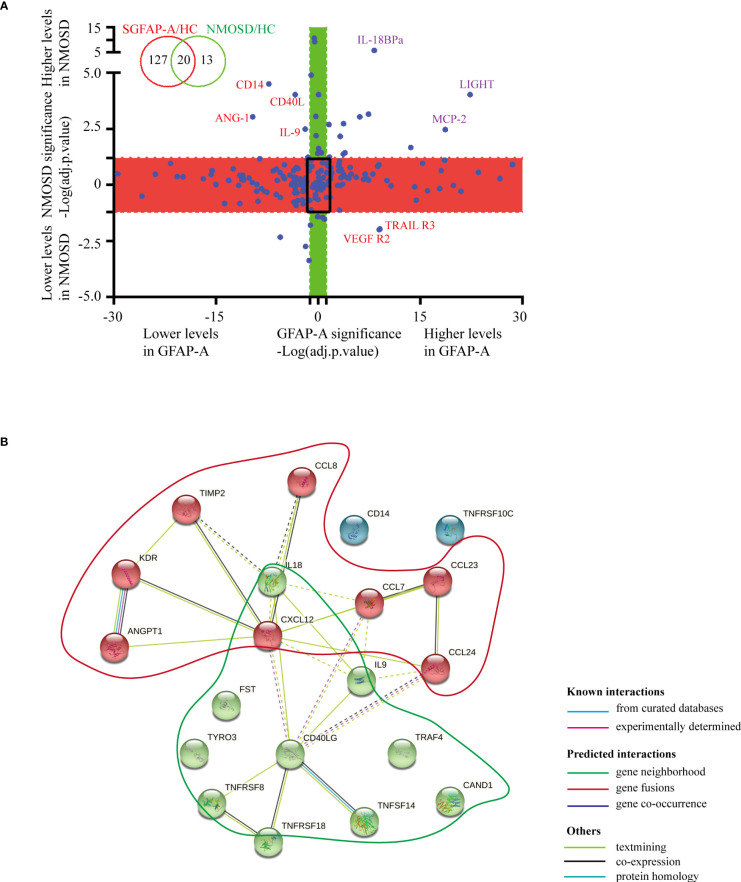
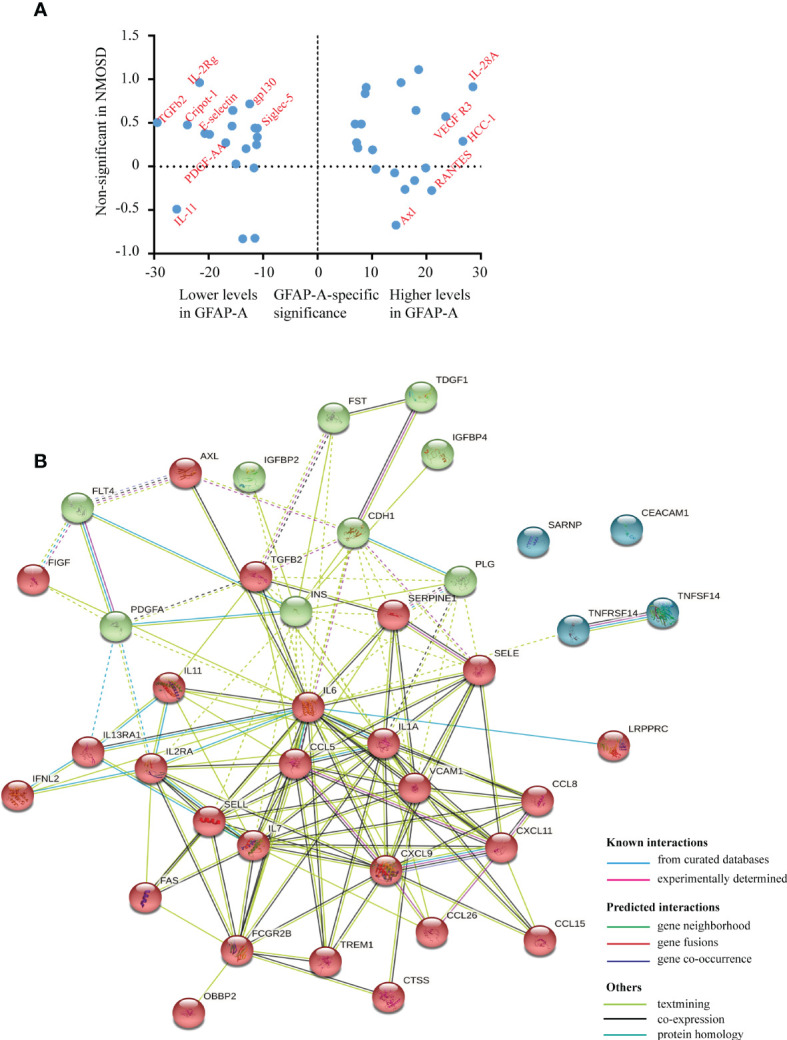
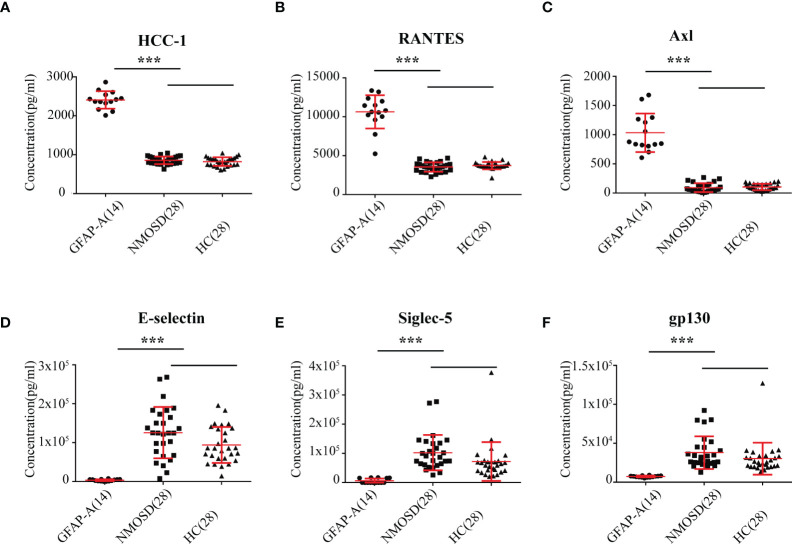
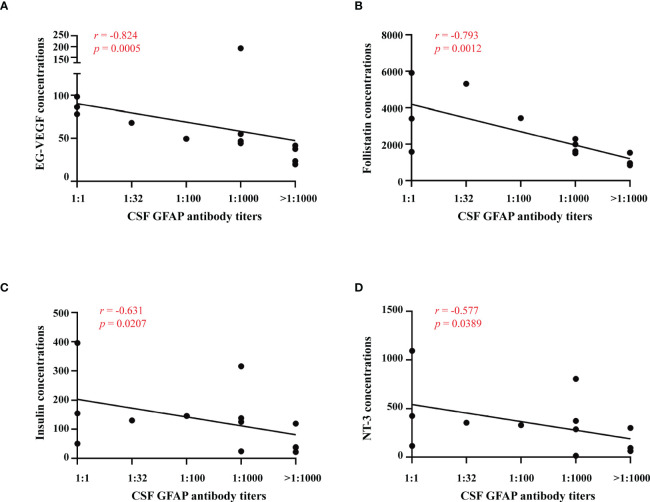
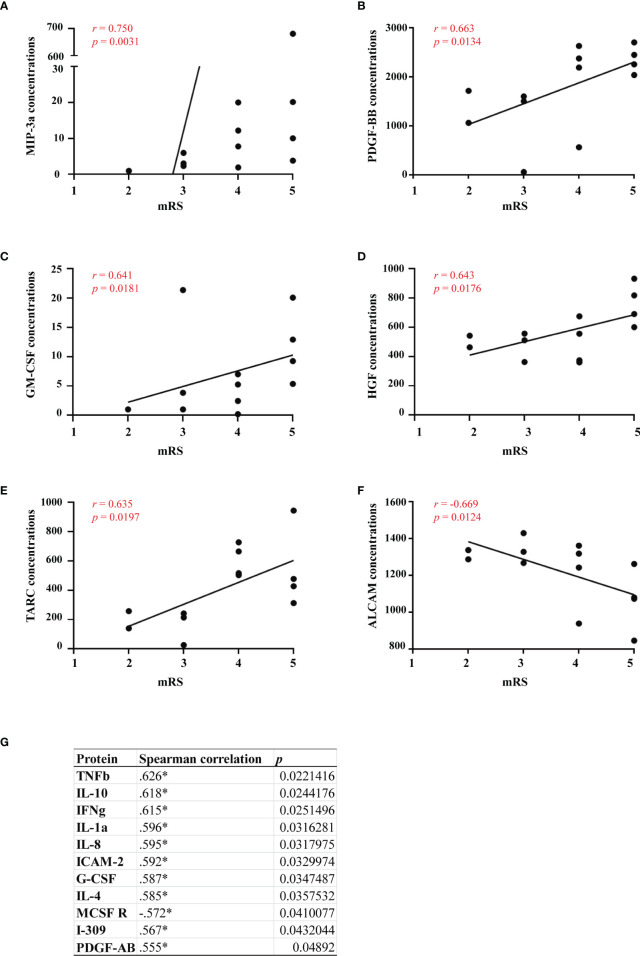
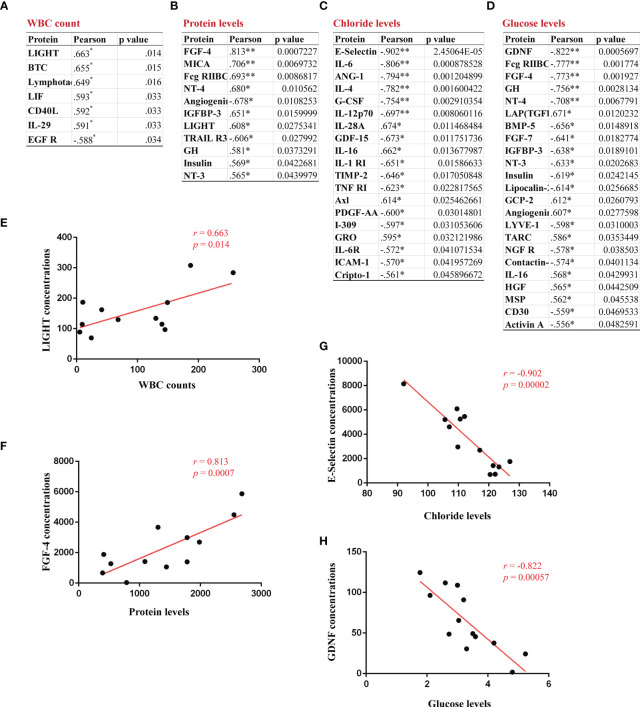
Autoimmune glial fibrillary acidic protein astrocytopathy (GFAP-A) is a newly defined meningoencephalomyelitis. The pathogenesis of GFAP-A is not well understood. The present study measured the expression levels of 200 serological cytokines in GFAP-A patients, NMOSD patients and healthy controls (HCs). The correlations between serum cytokine levels and clinical information in GFAP-A patients were analyzed. A total of 147 serological proteins were differentially expressed in GFAP-A patients compared to HCs, and 33 of these proteins were not observed in NMOSD patients. Serum levels of EG-VEGF negatively correlated with GFAP antibody titers, MIP-3 alpha positively correlated with clinical severity in GFAP-A patients, and LIGHT positively correlated with WBC counts and protein levels in the CSF of GFAP-A patients. These results suggest that GFAP and AQP4 astrocytopathy share some common pathology related to TNF signaling. Serum MIP 3 alpha may be a biomarker to assess clinical severity and a potential target for therapy of autoimmune GFAP astrocytopathy.

Keywords: CSF abnormalities; GFAP-A; MIP 3 alpha; autoantibody; autoimmune encephalitis.


Conflict of interest statement

The authors declare that the research was conducted in the absence of any commercial or financial relationships that could be construed as a potential conflict of interest.

Figures

Figure 1
Figure 1
Antibody array analysis shows DEPs between HCs and NMOSD patients. (A) Volcano plot presented the distribution of 200 serum protein expression levels between GFAP-A patients and HCs. (B) Volcano plot presented the distribution of 200 serum protein expression levels between NMOSD patients and HCs (adjusted p < 0.05 and absolute log2 FC > 0.263). adj.P.val = adjusted p value. (C) Clustering heatmap of the top 30 DEPs between GFAP-A patients (red) and HCs (blue). (D) Clustering heatmap of the 33 DEPs between NMOSD patients (red) and HCs (blue).
Figure 2
Figure 2
Serological protein profiles of GFAP and NMOSD patients reveal disease-common and disease-specific information. (A) Plot of the log10-transformed adjusted p value (adj.P.val) of GFAP-A and NMOSD data show preserved directionality, which resulted in the classification of four distinct groups: “Both changed” (adj.P.val GFAP-A < 0.05 and adj.P.val NMOSD < 0.05, same direction of changes in both diseases); “Changed in GFAP-A compared to NMOSD” (adj.P.val GFAP-A < 0.05, adj.P.val NMOSD>0.05, red box); “Changed in NMOSD compared to GFAP-A” (adj.P.val NMOSD < 0.05, adj.P.val GFAP-A > 0.05, green box); “Non-significant” (adj.P.val GFAP-A and adj.P.val NMOSD > 0.05, black frame). (B) STRING analysis of 20 DEPs in the GFAP-A and NMOSD patient groups compared to HCs. A total of three clusters were identified with known/predicted/other interactions. Cluster 1, represented with 9 red balls, and was centered in CD40LG. Cluster 2, represented with 8 green balls, was centered on CXCL12.
Figure 3
Figure 3
Serological protein profiles of GFAP-A patient disease-specific information. (A) Plot of the log10-transformed adjusted p value (adj.P.val) of the top 20 upregulated DEPs and top 20 downregulated DEPs unique to GFAP-A patients. The upregulated DEPS, such as VEGF R3, HCC-1, RANTES and Axl, are labeled on the right. The downregulated DEPs, such as E-selectin, gp130, Siglec-5 and PDGF-AA, are labeled on the left. (B) STRING analysis of the 40 DEPs (top 20 upregulated DEPs and top 20 downregulated DEPs). A total of three clusters were identified with known/predicted/other interactions. Cluster 1, represented with 26 red balls, and was centered on CXCL9. Cluster 2, represented with 9 green balls, was centered in INS.
Figure 4
Figure 4
Scatter plot of the top 6 DEPs unique to GFAP-A. Serological concentrations (pg/ml) of the top 3 upregulated proteins (HCC-1, RANTES and Axl) that unique to GFAP were scatter plotted in (A–C). Serological concentrations (pg/ml) of the top 3 downregulated proteins (E-selectin, Siglec-5 and gp130) that unique to GFAP-A patients were scatter plotted in (D–F). The results are the means ± SEM. The non-parametric test was used for statistical analyses, and a p value of 0.05 or less was considered significant. ***p < 0.001.
Figure 5
Figure 5
Relationships between serum cytokines and anti-GFAP antibody titers. Correlations between anti-GFAP antibody titer and serum levels of EG-VEGF, follistatin, insulin and NT-3 were analyzed by spearman’s rank analysis and were showed in (A–D).
Figure 6
Figure 6
Relationships between serum cytokines and clinical severity. Correlations between clinical severity and serum levels of MIP-3a, PDGF-BB, GM-CSF, HGF, TARC, ALCAM and other proteins were analyzed by spearman’s rank analysis and were showed in (A–G). *p<0.05.
Figure 7
Figure 7
Identification of correlations between CSF abnormalities and serum proteins in GFAP-A patients. The serum proteins with a significant correlation with CSF levels of WBC count, protein, chloride and glucose are shown in (A–D). (E) A positive correlation between CSF WBC count and the serum concentrations of LIGHT. (F) A positive correlation between CSF protein levels and the serum concentrations of FGF-4. (G) A negative correlation between CSF chloride levels and the serum concentrations of E-selectin. (H) A negative correlation between CSF glucose levels and the serum concentrations of GDNF. Pearson’s correlation analysis was used for statistical analyses, *p<0.05, and **p<0.01 or less was considered significant.

References

    1. Fang B, McKeon A, Hinson SR, Kryzer TJ, Pittock SJ, Aksamit AJ, et al. Autoimmune glial fibrillary acidic protein astrocytopathy: A novel meningoencephalomyelitis. JAMA Neurol (2016) 73(11):1297–307. doi: 10.1001/jamaneurol.2016.2549 - DOI - PubMed
    1. Iorio R, Damato V, Evoli A, Gessi M, Gaudino S, Di Lazzaro V, et al. Clinical and immunological characteristics of the spectrum of GFAP autoimmunity: a case series of 22 patients. J Neurol Neurosurge Psychiatry (2018) 89(2):138–46. doi: 10.1136/jnnp-2017-316583 - DOI - PubMed
    1. Yuan Z, Li H, Huang L, Fu C, Chen Y, Zhi C, et al. CD8(+) T-cell predominance in autoimmune glial fibrillary acidic protein astrocytopathy. Eur J Neurol (2021) 28(6):2121–5. doi: 10.1111/ene.14778 - DOI - PubMed
    1. Kimura A, Takemura M, Yamamoto Y, Hayashi Y, Saito K, Shimohata T. Cytokines and biological markers in autoimmune GFAP astrocytopathy: The potential role for pathogenesis and therapeutic implications. J Neuroimmunol (2019) 334:576999. doi: 10.1016/j.jneuroim.2019.576999 - DOI - PubMed
    1. Flanagan EP, Hinson SR, Lennon VA, Fang B, Aksamit AJ, Morris PP, et al. Glial fibrillary acidic protein immunoglobulin G as biomarker of autoimmune astrocytopathy: Analysis of 102 patients. Ann Neurol (2017) 81(2):298–309. doi: 10.1002/ana.24881 - DOI - PubMed

MeSH terms