Performance of quantitative measurements in [18F]fluorocholine positron emission tomography/computed tomography for parathyroid imaging (P2TH study)
- PMID: 35983092
- PMCID: PMC9380568
- DOI: 10.3389/fmed.2022.956580
Performance of quantitative measurements in [18F]fluorocholine positron emission tomography/computed tomography for parathyroid imaging (P2TH study)
Abstract
Objective: [18F]Fluorocholine positron emission tomography/computed tomography (PET/CT) is used frequently in addition to [99mTc]Tc-Sestamibi scintigraphy and ultrasonography for the location of hyperfunctioning parathyroid glands. The aim of this study is to evaluate the performance of quantitative criteria in [18F]fluorocholine PET/CT for localization of hyperfunctioning parathyroid glands. The secondary objective is to highlight a correlation between the detection rate of [18F]fluorocholine PET/CT and serum parathyroid hormone (PTH) level.
Materials and methods: In two academic centers, we retrospectively included patients with biological hyperparathyroidism (HPT) and who had [18F]fluorocholine PET/CT. After a visual analysis, to measure the overall performance of [18F]fluorocholine PET/CT, a blind reading was carried out with standardized measurements of maximum standardized uptake value (SUVmax), liver ratio, thyroid ratio, and size ratio. We analyzed the quantitative criteria of [18F]fluorocholine PET/CT compared to the histological results, in particular to identify differences between adenomas and hyperplasias. We compared the performance of each quantitative criterion to the overall sensitivity, specificity, positive predictive value (PPV), negative predictive value (NPV), and accuracy of [18F]fluorocholine PET/CT. The detection rate of hyperfunctioning parathyroid glands was calculated in subgroups of serum PTH level.
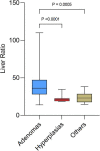
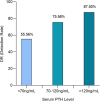
Results: The quantitative criteria in [18F]fluorocholine PET/CT were measured for 120 patients (135 lesions). The areas under the receiver operating characteristic (ROC) curve representing SUVmax and liver ratio were significantly increased. The optimal cut-off values represented by the maximum Youden index was >4.12 for SUVmax and >27.4 for liver ratio. Beyond certain threshold values of SUVmax (>4.12) or liver ratio (>38.1), all the lesions were histologically proven adenomas. SUVmax and liver ratio were significantly higher for adenomas than for hyperplasias and differential diagnosis (p = 0.0085 and p = 0.0002). The positivity of [18F]fluorocholine PET/CT was correlated with PTH level. Detection rates were 55.56, 75.56, and 87.5%, respectively, for serum PTH < 70, 70 to 120, and >120 ng/ml.
Conclusion: Semi-quantitative measurements (SUVmax and liver ratio) should be considered as additional tools in interpretation of [18F]fluorocholine PET/CT. These quantitative parameters have lower overall performance but higher specificity than overall visual analysis in identifying an adenoma. Above certain threshold values, all lesions are adenomas. [18F]fluorocholine PET/CT confirms excellent performance for the detection of hyperfunctional parathyroids. For serum PTH levels < 70 ng/ml, the detection rate of [18F]fluorocholine PET/CT is strongly decreased.
Keywords: PET/CT; PTH; SUV; [18F]fluorocholine; adenoma; hyperplasia; parathyroid; semi quantitative analysis.
Copyright © 2022 Jacquet-Francillon, Morelec, Germain, Prades, Habouzit, Mariat, Bonnefoy and Prevot.
Conflict of interest statement
The authors declare that the research was conducted in the absence of any commercial or financial relationships that could be construed as a potential conflict of interest.
Figures


References
LinkOut - more resources
Full Text Sources

