

Development of a composite diffusion tensor imaging score correlating with short-term neurological status in neonatal hypoxic-ischemic encephalopathy
- PMID: 35983227
- PMCID: PMC9379310
- DOI: 10.3389/fnins.2022.931360
Development of a composite diffusion tensor imaging score correlating with short-term neurological status in neonatal hypoxic-ischemic encephalopathy
Abstract
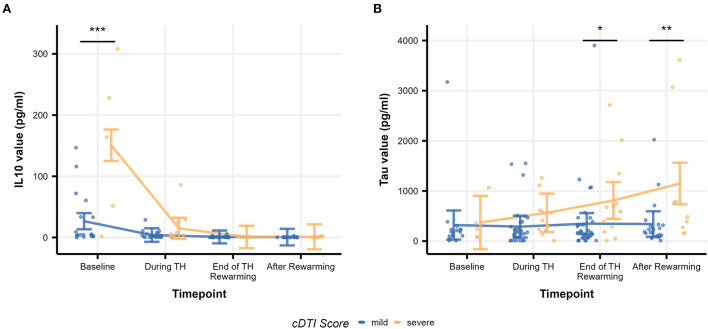
Hypoxic-ischemic encephalopathy (HIE) is the most common cause of neonatal acquired brain injury. Although conventional MRI may predict neurodevelopmental outcomes, accurate prognostication remains difficult. As diffusion tensor imaging (DTI) may provide an additional diagnostic and prognostic value over conventional MRI, we aimed to develop a composite DTI (cDTI) score to relate to short-term neurological function. Sixty prospective neonates treated with therapeutic hypothermia (TH) for HIE were evaluated with DTI, with a voxel size of 1 × 1 × 2 mm. Fractional anisotropy (FA) and mean diffusivity (MD) from 100 neuroanatomical regions (FA/MD *100 = 200 DTI parameters in total) were quantified using an atlas-based image parcellation technique. A least absolute shrinkage and selection operator (LASSO) regression was applied to the DTI parameters to generate the cDTI score. Time to full oral nutrition [short-term oral feeding (STO) score] was used as a measure of short-term neurological function and was correlated with extracted DTI features. Seventeen DTI parameters were selected with LASSO and built into the final unbiased regression model. The selected factors included FA or MD values of the limbic structures, the corticospinal tract, and the frontotemporal cortices. While the cDTI score strongly correlated with the STO score (rho = 0.83, p = 2.8 × 10⁻¹⁶), it only weakly correlated with the Sarnat score (rho = 0.27, p = 0.035) and moderately with the NICHD-NRN neuroimaging score (rho = 0.43, p = 6.6 × 10-04). In contrast to the cDTI score, the NICHD-NRN score only moderately correlated with the STO score (rho = 0.37, p = 0.0037). Using a mixed-model analysis, interleukin-10 at admission to the NICU (p = 1.5 × 10⁻¹³) and tau protein at the end of TH/rewarming (p = 0.036) and after rewarming (p = 0.0015) were significantly associated with higher cDTI scores, suggesting that high cDTI scores were related to the intensity of the early inflammatory response and the severity of neuronal impairment after TH. In conclusion, a data-driven unbiased approach was applied to identify anatomical structures associated with some aspects of neurological function of HIE neonates after cooling and to build a cDTI score, which was correlated with the severity of short-term neurological functions.
Keywords: diffusion tensor imaging; hypoxic-ischemic encephalopathy; least absolute shrinkage and selection operator; neonatal brain atlas; outcome prediction; serum biomarkers; short-term neurologic outcome.
Copyright © 2022 Onda, Catenaccio, Chotiyanonta, Chavez-Valdez, Meoded, Soares, Tekes, Spahic, Miller, Parker, Parkinson, Vaidya, Graham, Stafstrom, Everett, Northington and Oishi.
Conflict of interest statement
KOi is a consultant for “AnatomyWorks” and “Corporate-M.” This arrangement is being managed by the Johns Hopkins University in accordance with its conflict-of-interest policies. The remaining authors declare that the research was conducted in the absence of any commercial or financial relationships that could be construed as a potential conflict of interest.
Figures


References
-
- Akazawa K., Chang L., Yamakawa R., Hayama S., Buchthal S., Alicata D., et al. . (2016). Probabilistic maps of the white matter tracts with known associated functions on the neonatal brain atlas: application to evaluate longitudinal developmental trajectories in term-born and preterm-born infants. Neuroimage 128, 167–179. 10.1016/j.neuroimage.2015.12.026 - DOI - PMC - PubMed
-
- Annink K. V., de Vries L. S., Groenendaal F., Eijsermans R., Mocking M., van Schooneveld M. M. J., et al. . (2021). Mammillary body atrophy and other MRI correlates of school-age outcome following neonatal hypoxic-ischemic encephalopathy. Sci. Rep. 11, 5017. 10.1038/s41598-021-83982-8 - DOI - PMC - PubMed
Grants and funding
LinkOut - more resources
Full Text Sources
Research Materials