. 2022 Jul 29;5(8):652-667.
doi: 10.1021/acsptsci.2c00088. eCollection 2022 Aug 12.

Validating the Arrhythmogenic Potential of High-, Intermediate-, and Low-Risk Drugs in a Human-Induced Pluripotent Stem Cell-Derived Cardiac Microphysiological System

Affiliations

Validating the Arrhythmogenic Potential of High-, Intermediate-, and Low-Risk Drugs in a Human-Induced Pluripotent Stem Cell-Derived Cardiac Microphysiological System

Verena Charwat et al. ACS Pharmacol Transl Sci. .

Abstract

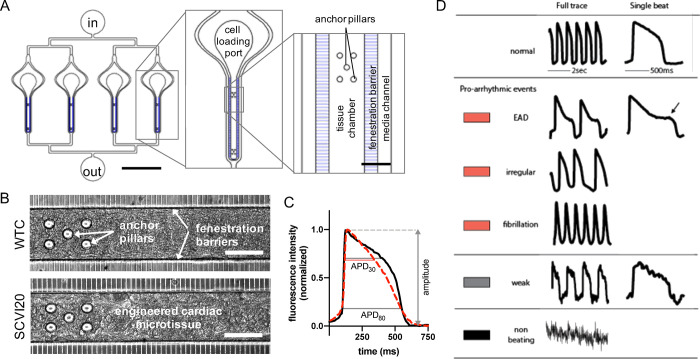
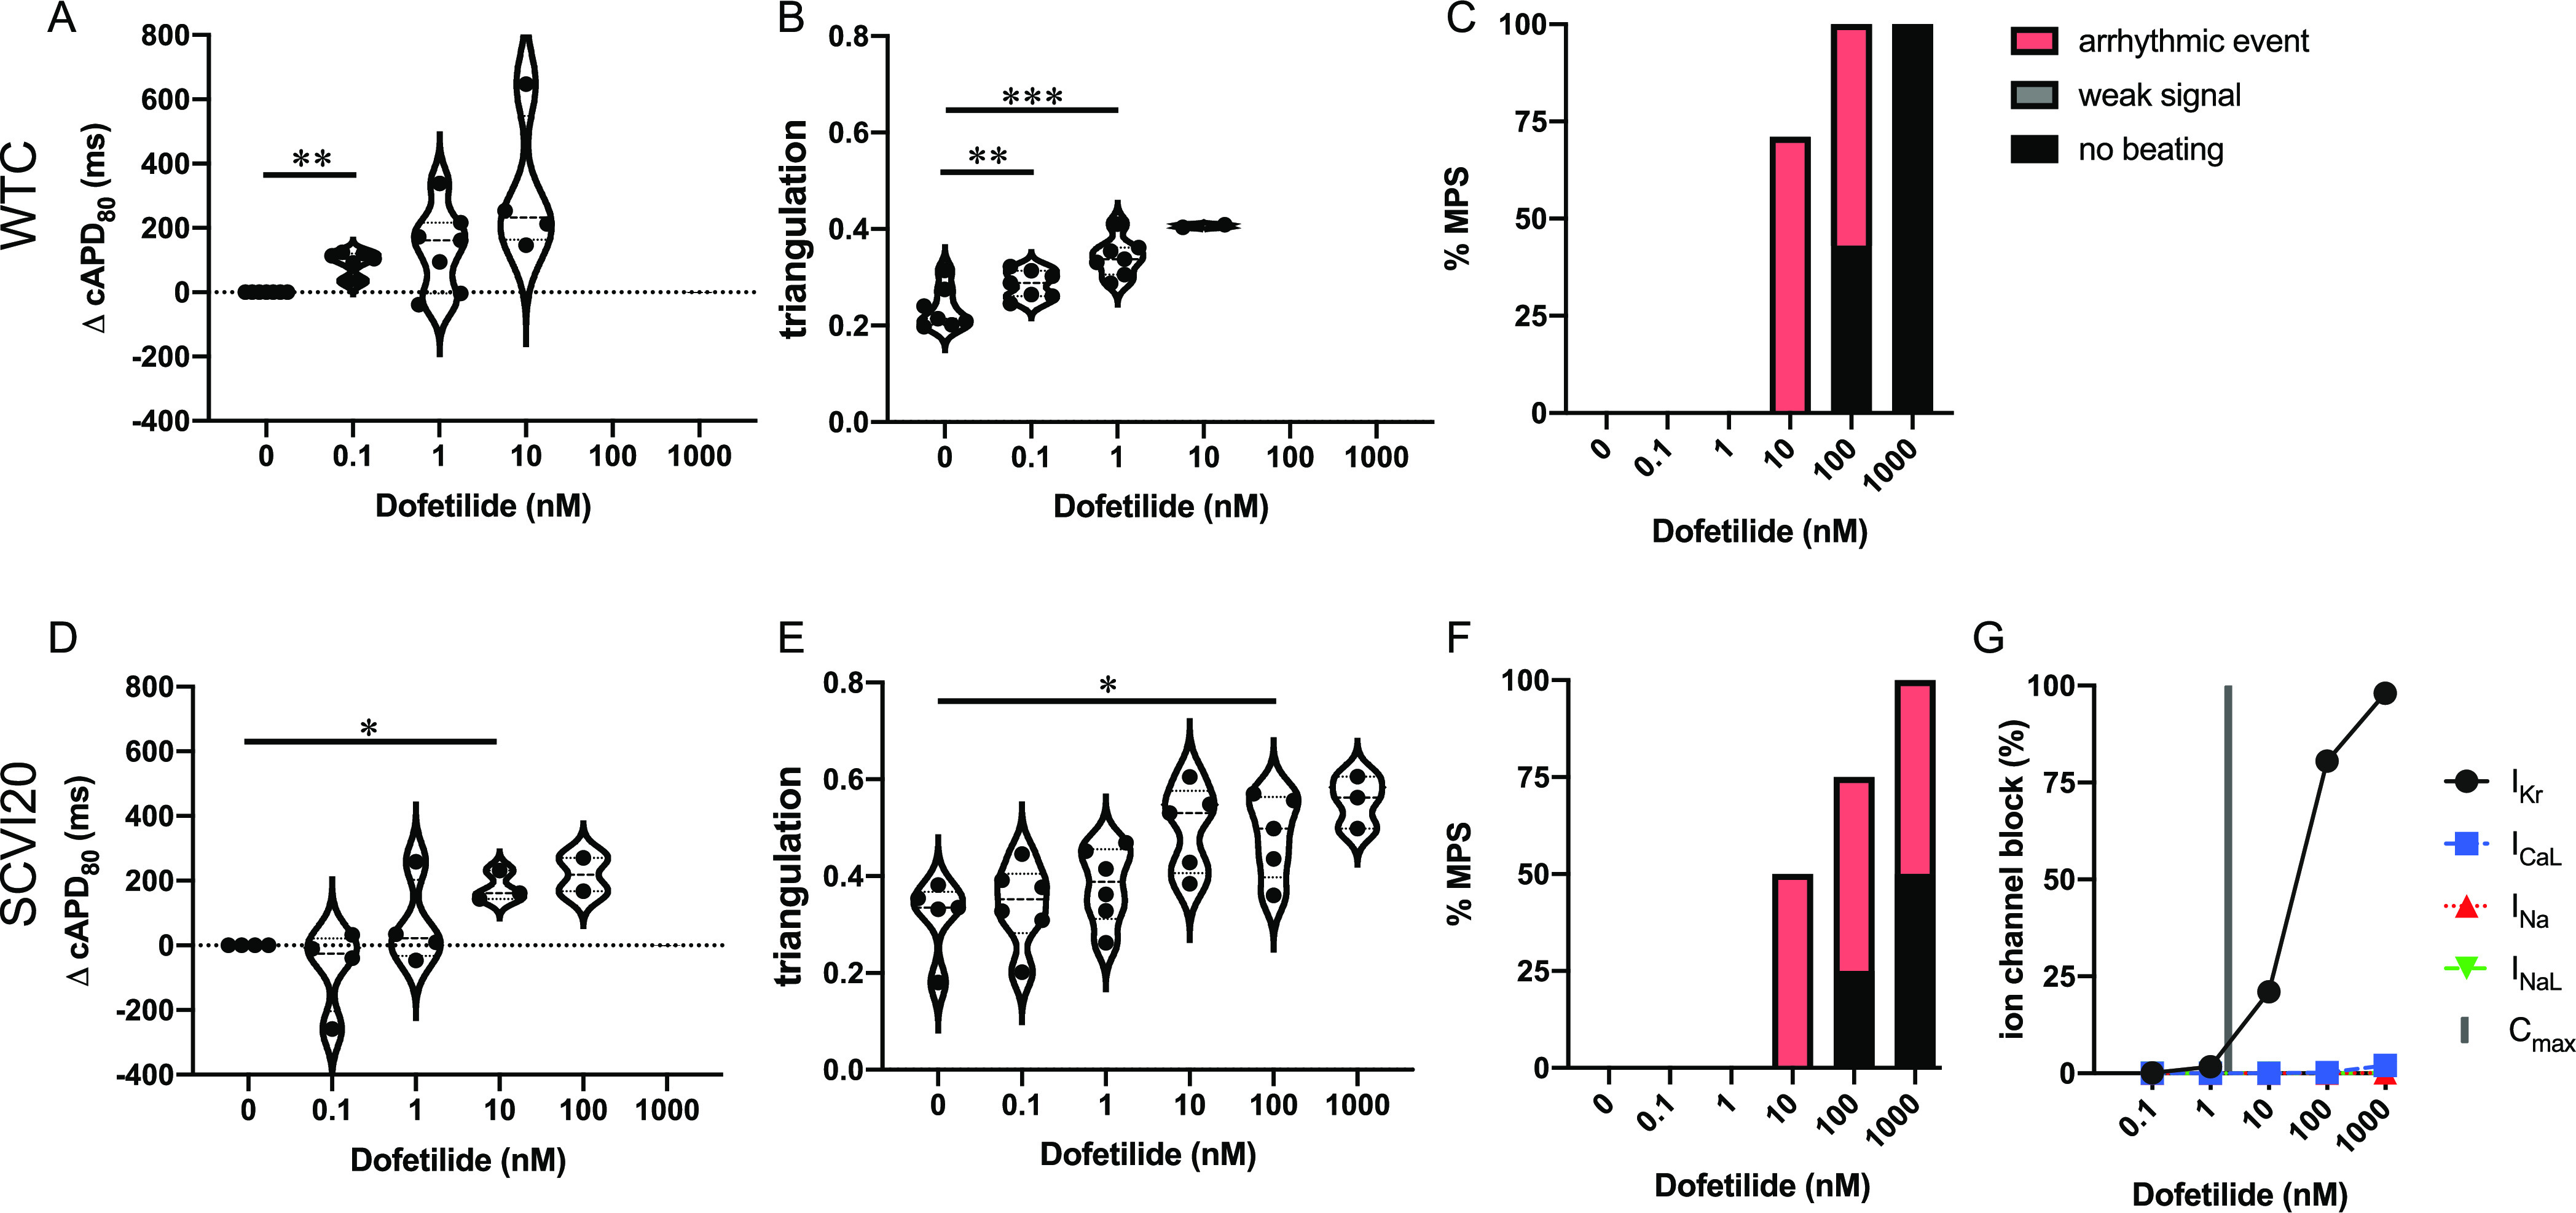
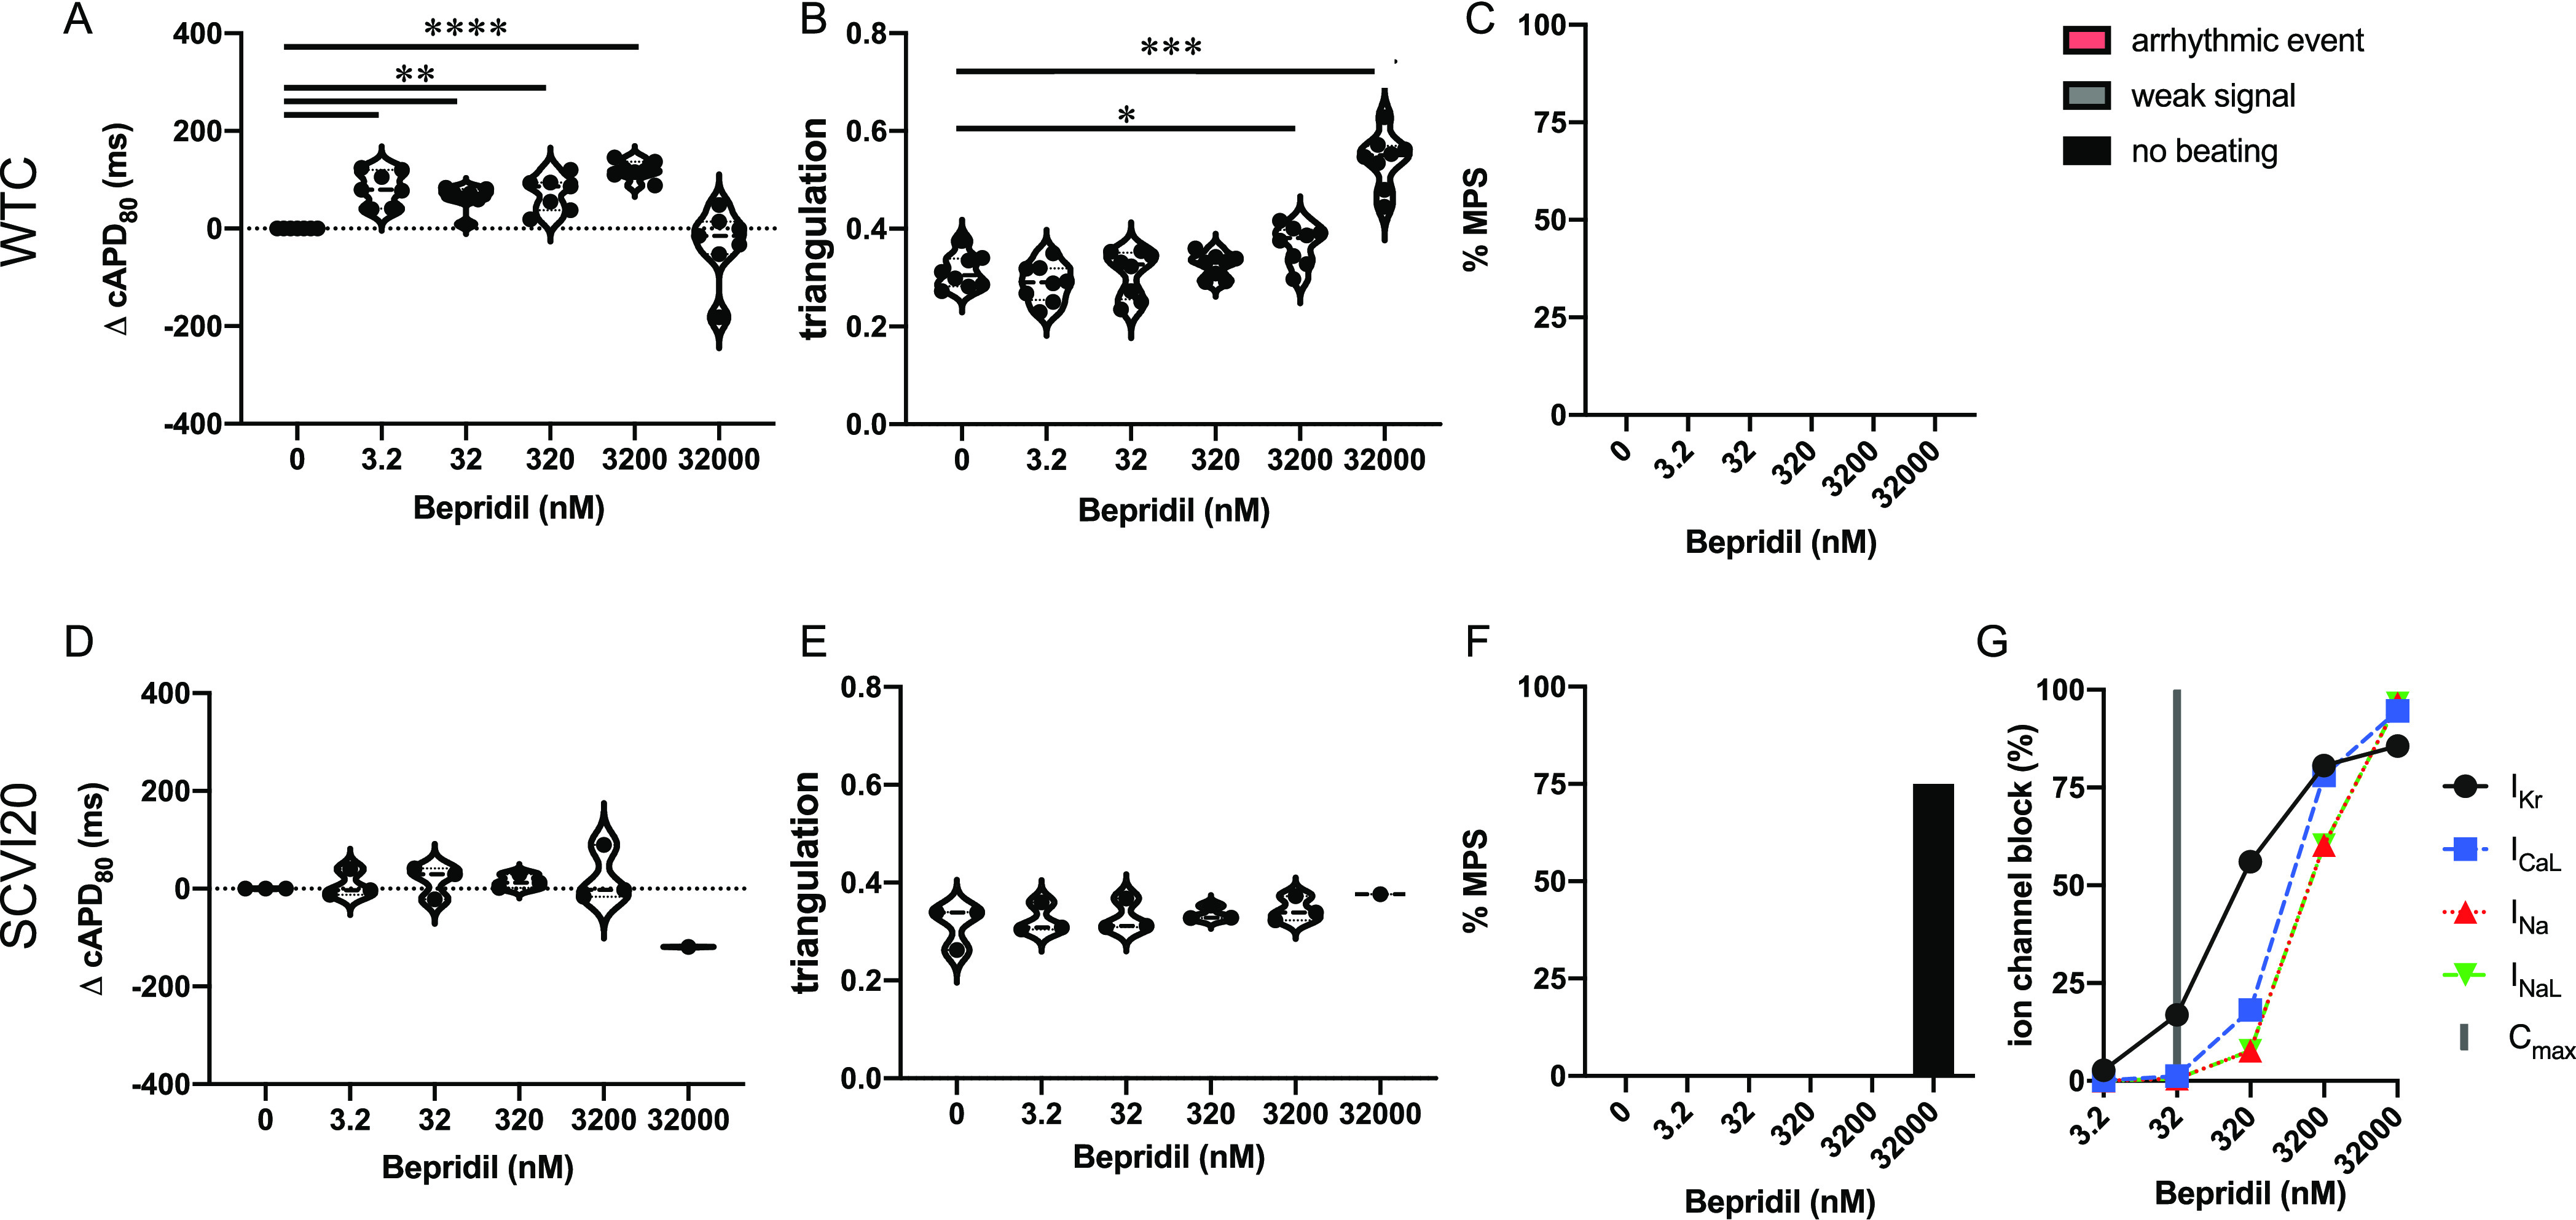
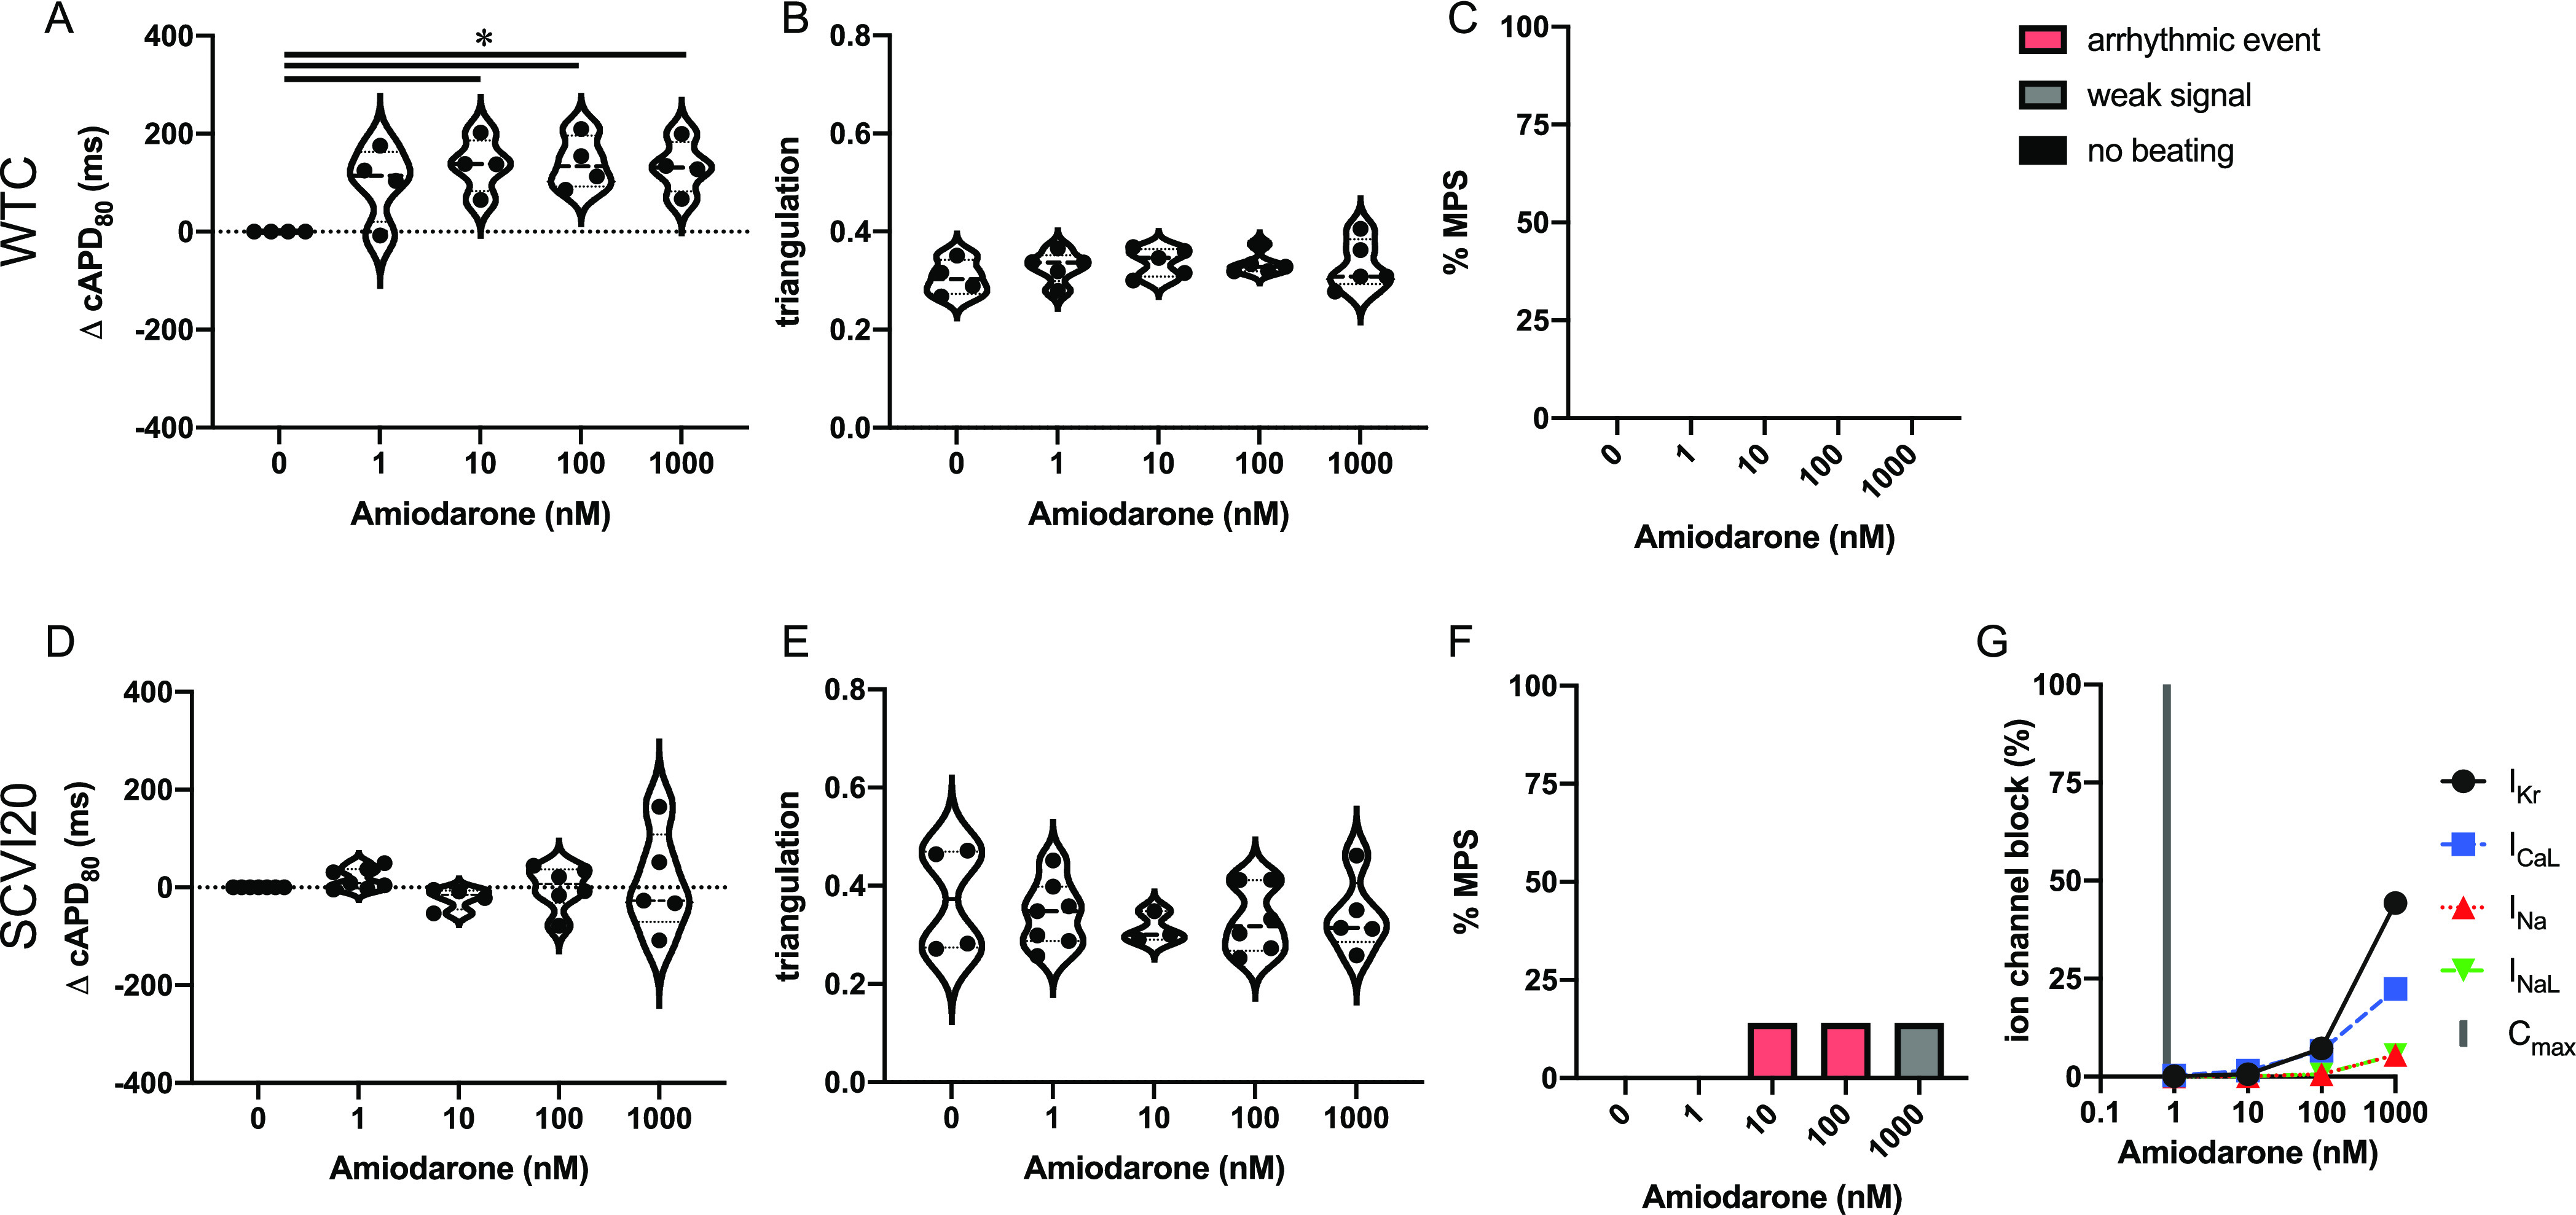
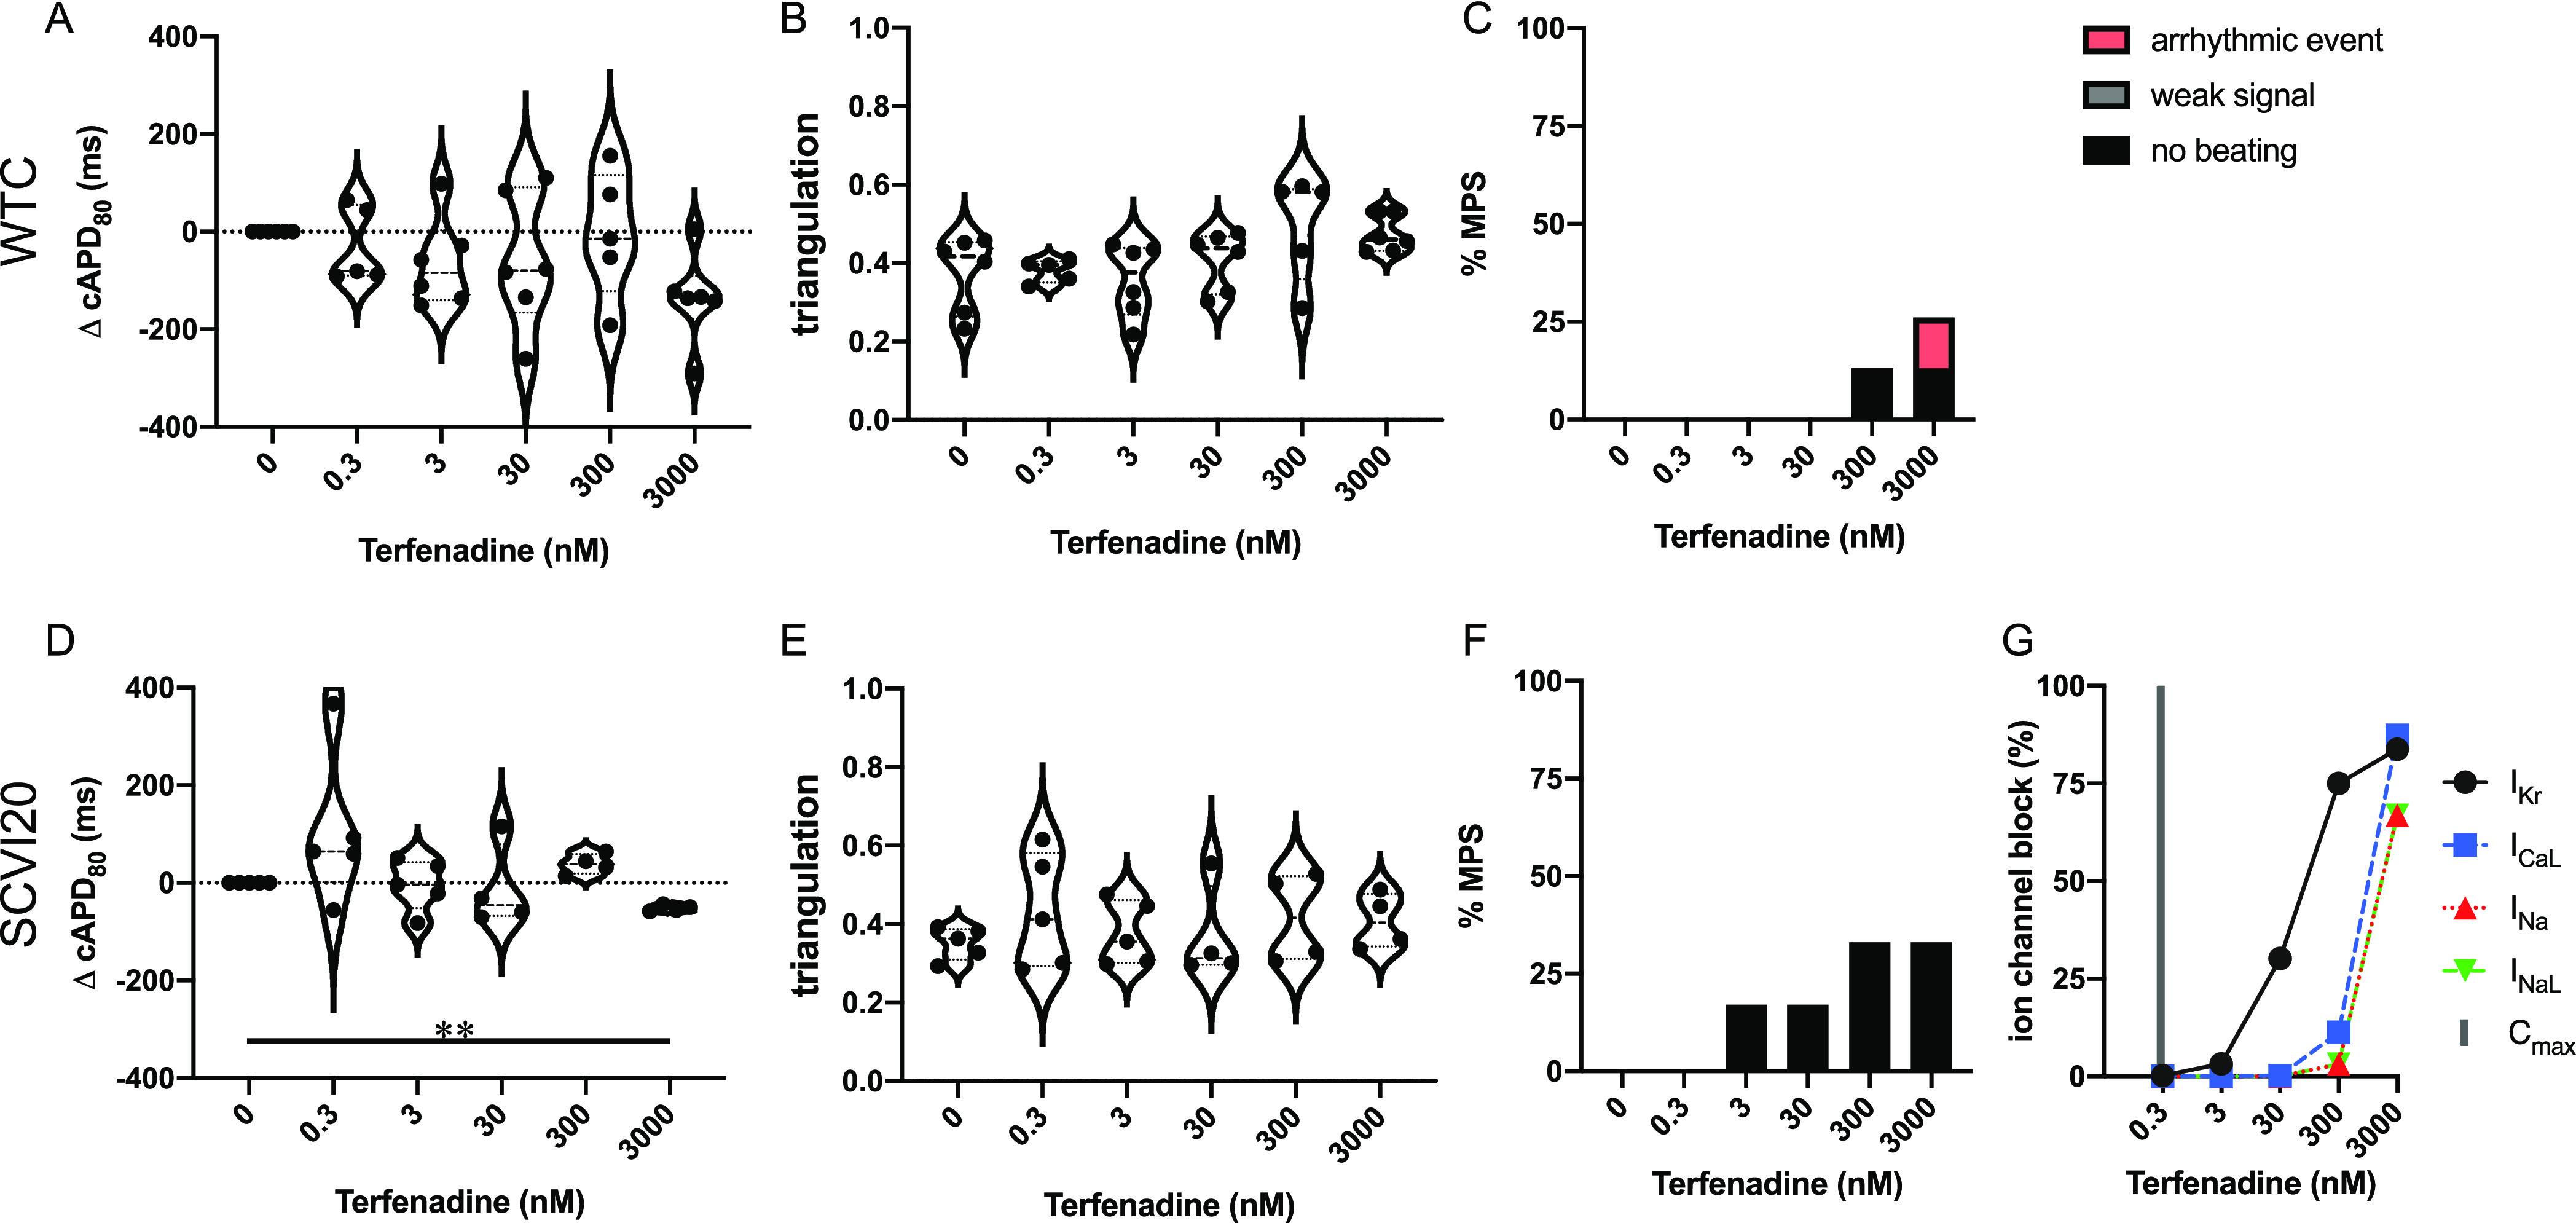
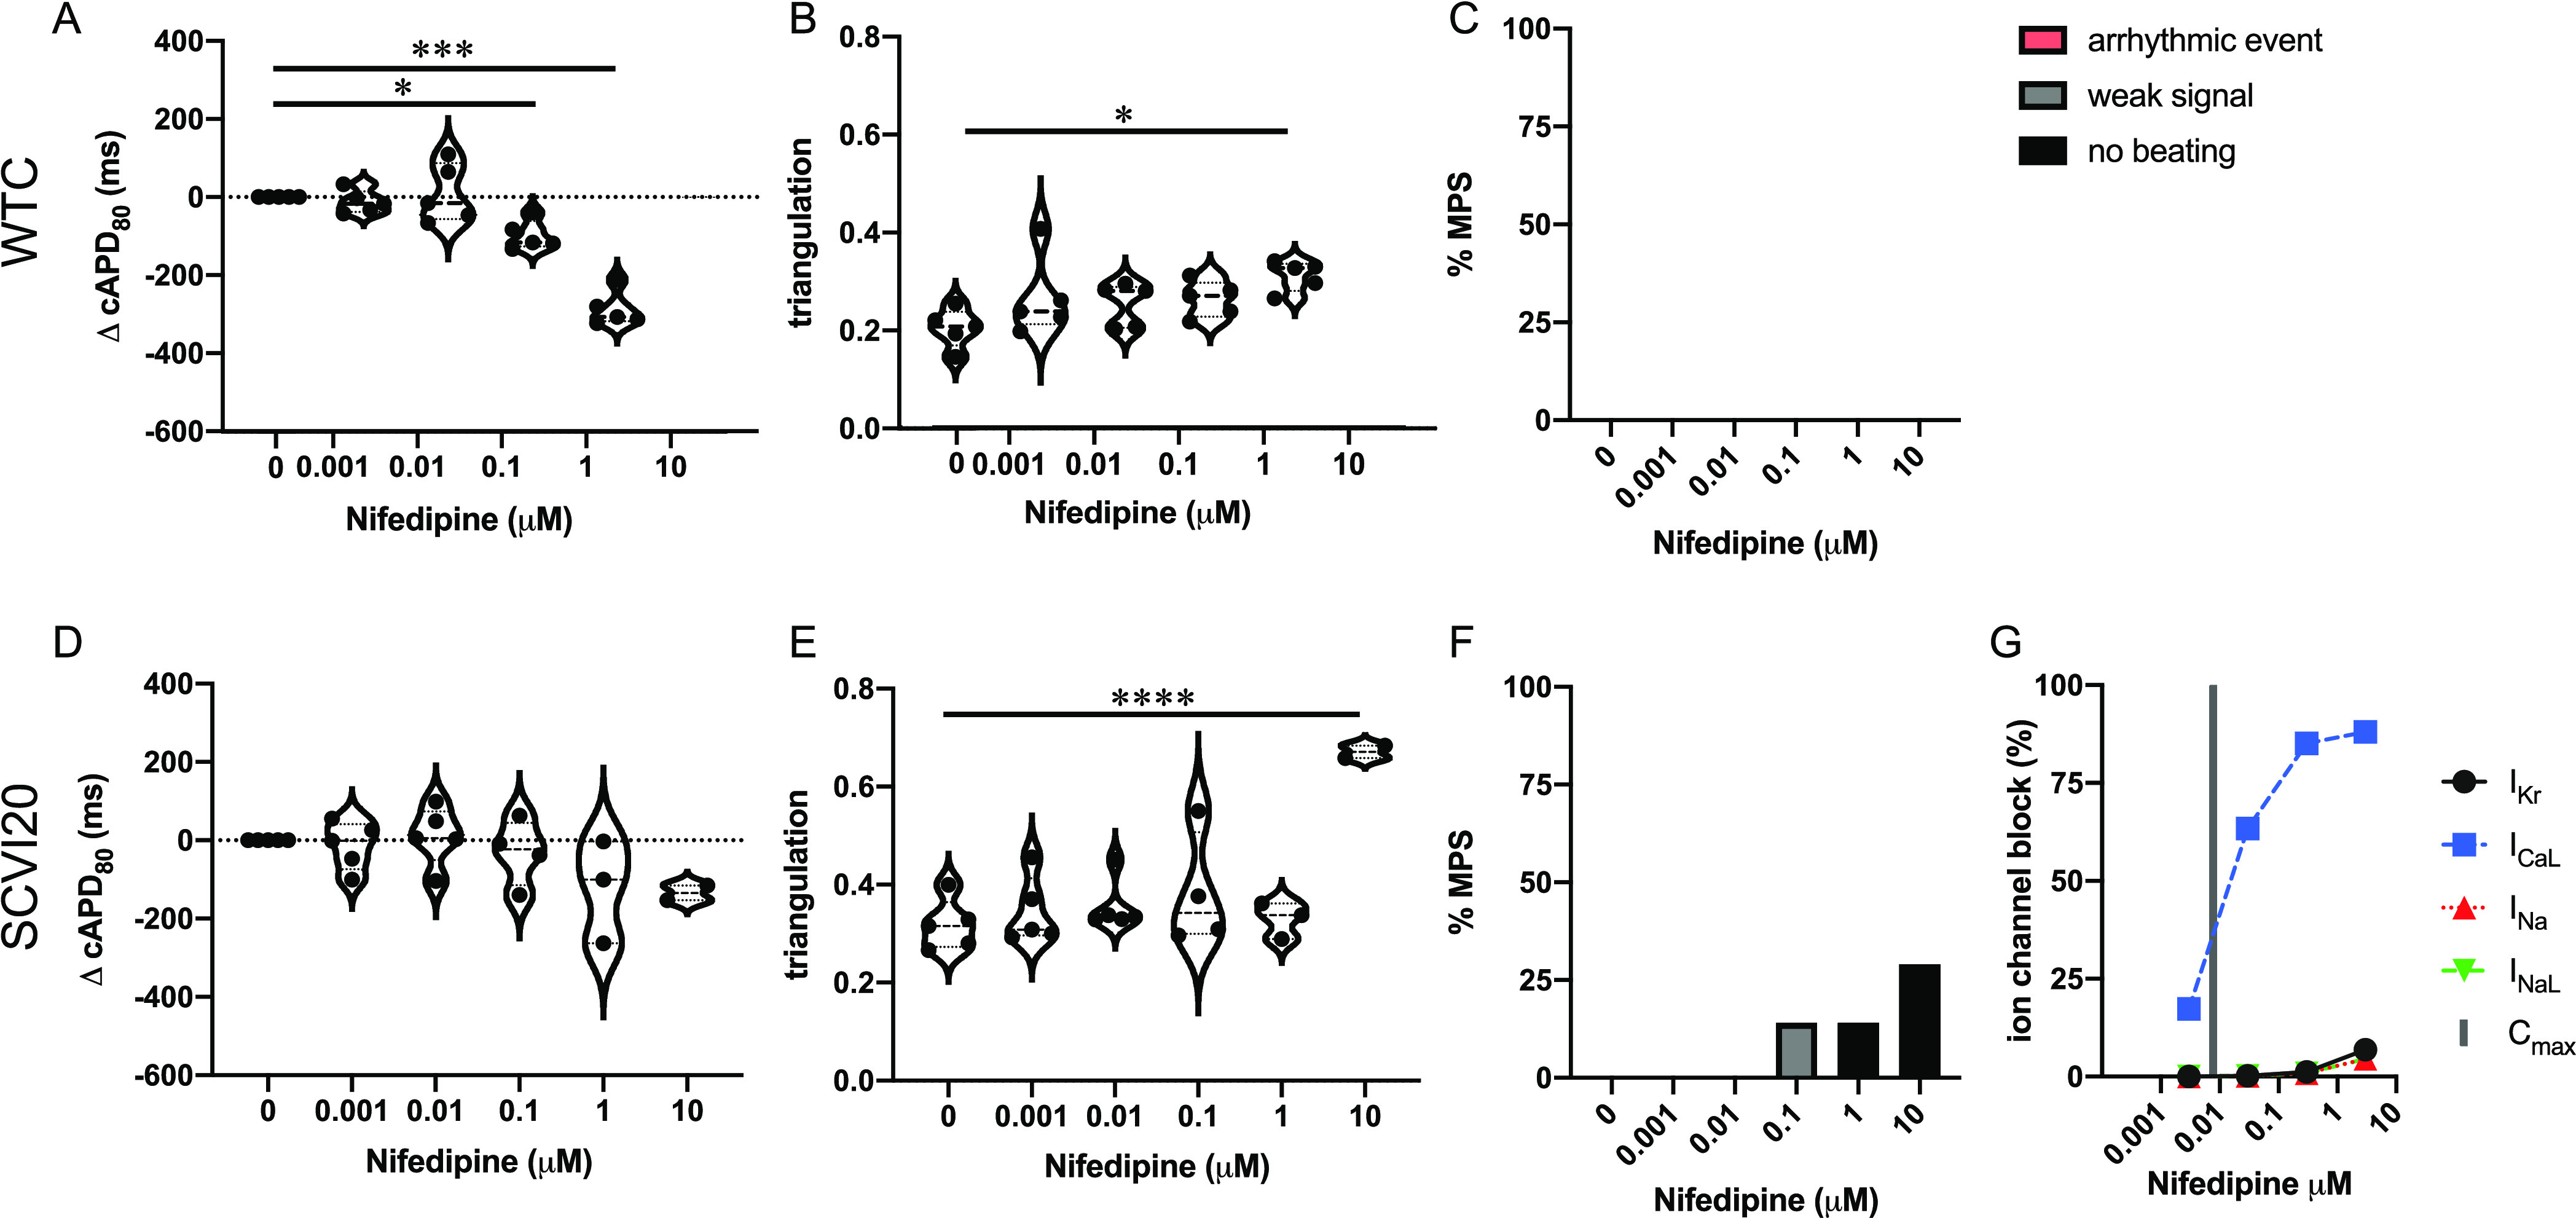
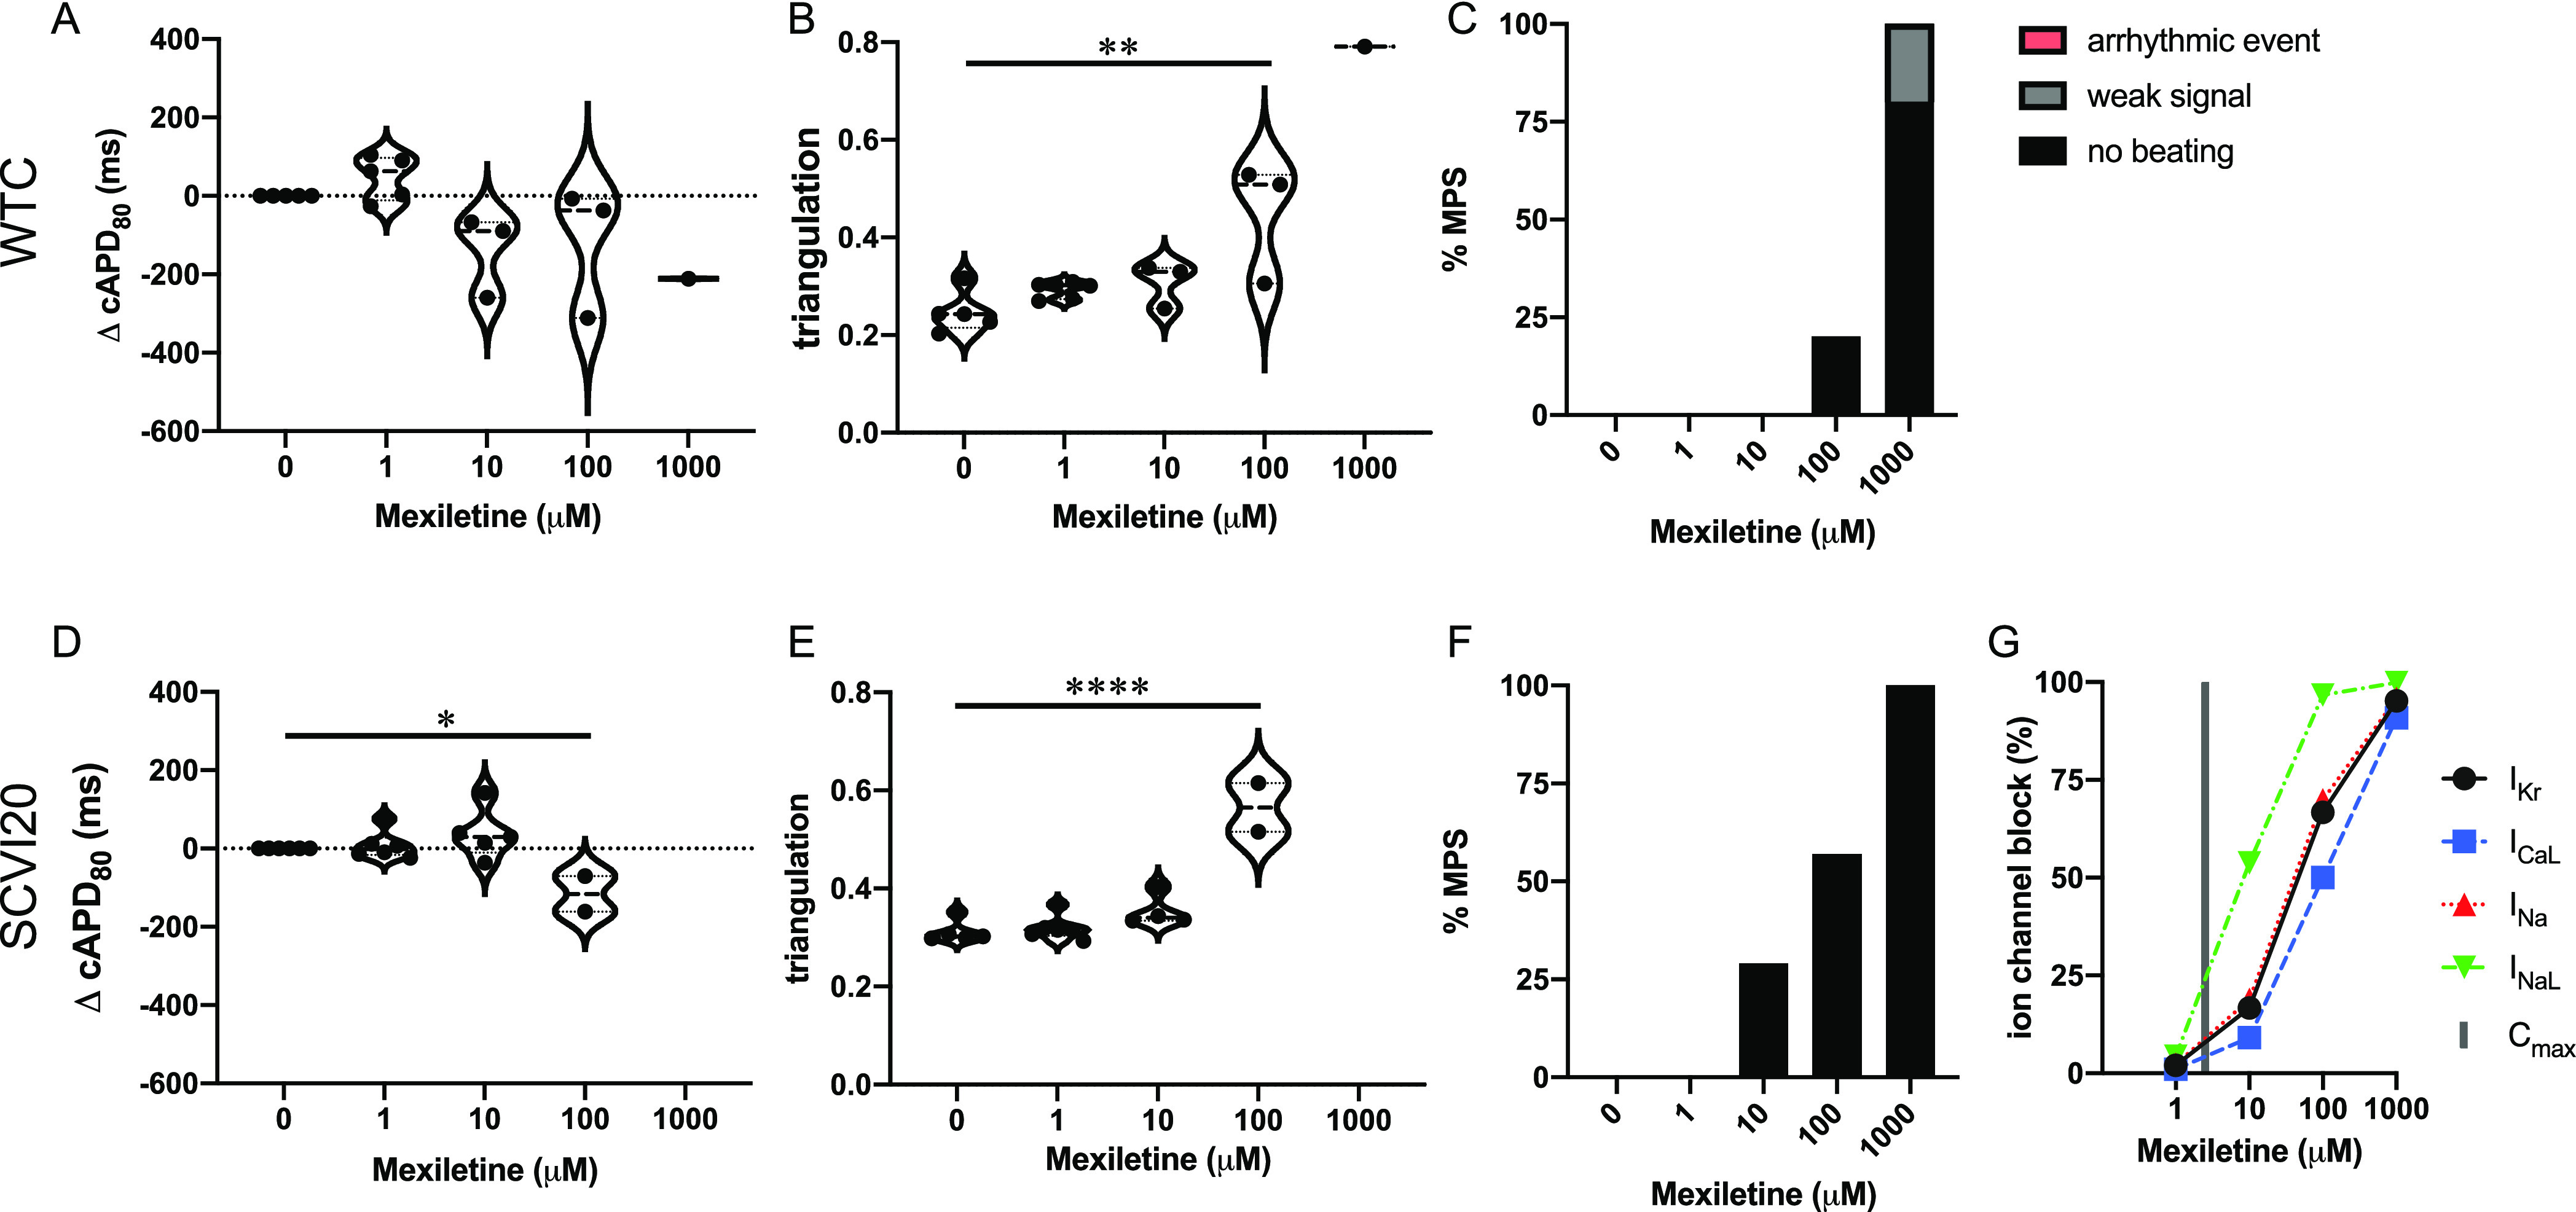
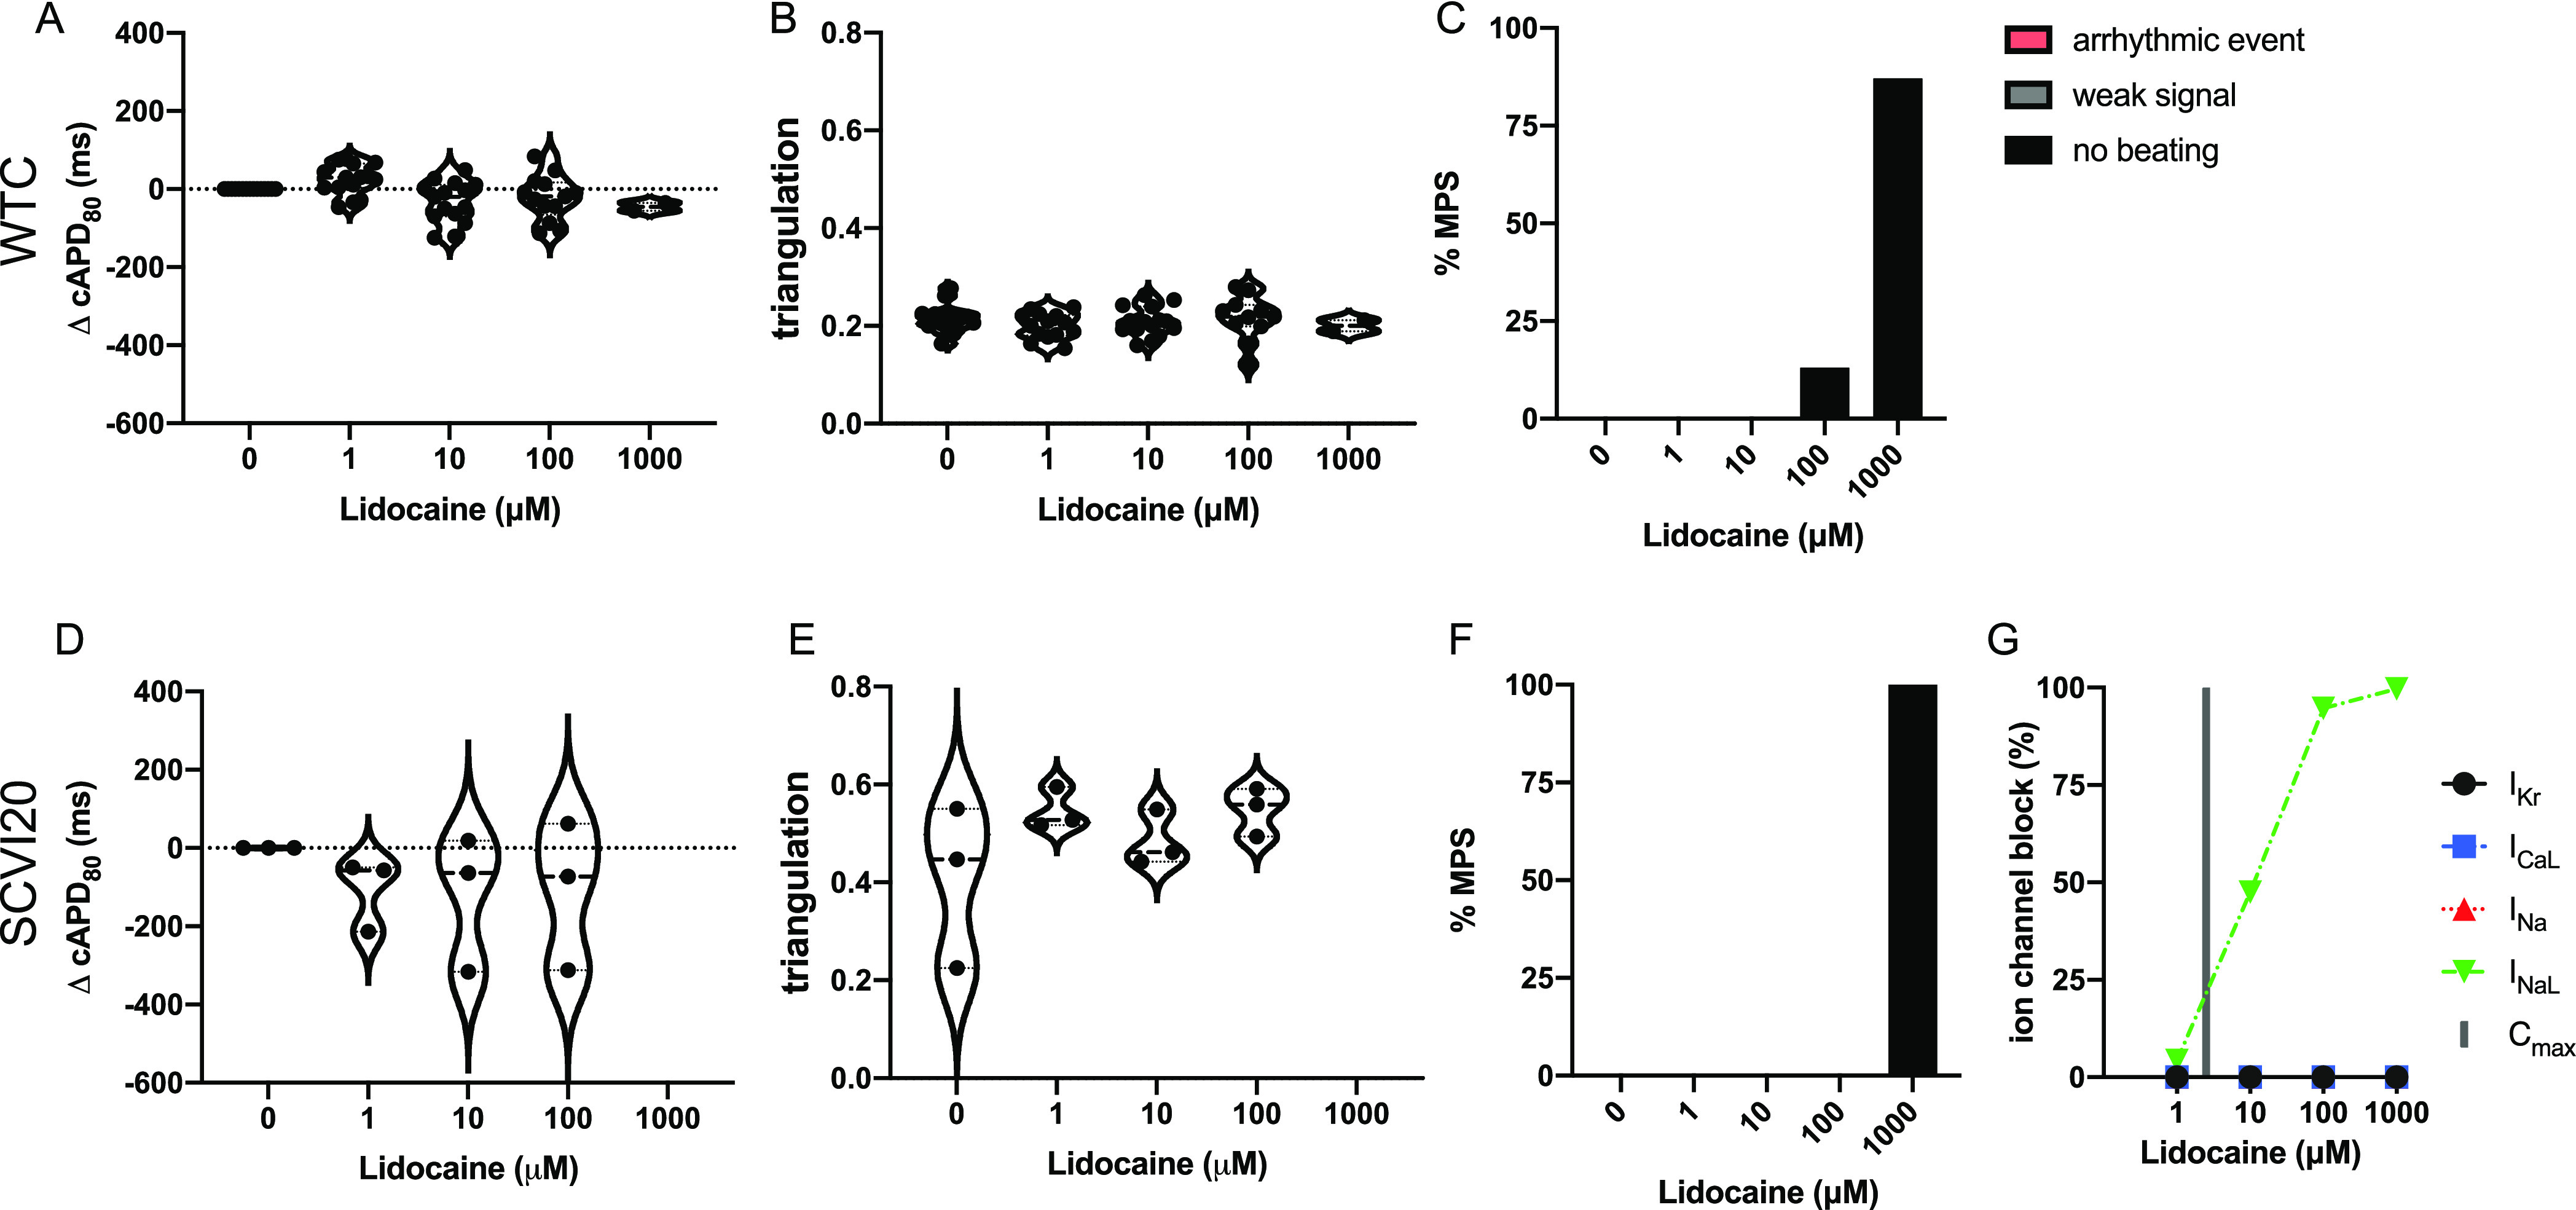
Evaluation of arrhythmogenic drugs is required by regulatory agencies before any new compound can obtain market approval. Despite rigorous review, cardiac disorders remain the second most common cause for safety-related market withdrawal. On the other hand, false-positive preclinical findings prohibit potentially beneficial candidates from moving forward in the development pipeline. Complex in vitro models using cardiomyocytes derived from human-induced pluripotent stem cells (hiPSC-CM) have been identified as a useful tool that allows for rapid and cost-efficient screening of proarrhythmic drug risk. Currently available hiPSC-CM models employ simple two-dimensional (2D) culture formats with limited structural and functional relevance to the human heart muscle. Here, we present the use of our 3D cardiac microphysiological system (MPS), composed of a hiPSC-derived heart micromuscle, as a platform for arrhythmia risk assessment. We employed two different hiPSC lines and tested seven drugs with known ion channel effects and known clinical risk: dofetilide and bepridil (high risk); amiodarone and terfenadine (intermediate risk); and nifedipine, mexiletine, and lidocaine (low risk). The cardiac MPS successfully predicted drug cardiotoxicity risks based on changes in action potential duration, beat waveform (i.e., shape), and occurrence of proarrhythmic events of healthy patient hiPSC lines in the absence of risk cofactors. We showcase examples where the cardiac MPS outperformed existing hiPSC-CM 2D models.


Conflict of interest statement

The authors declare the following competing financial interest(s): KEH, VC, BAS, HF, KHJ, AGE, NH, SW and AT have a financial relationship with Organos Inc., and they and the company may benefit from commercialization of the results of this research.

Figures

Figure 1
Figure 1
Design and function of the cardiac MPS. (A) Layout of a multiplexed cardiac MPS device comprising four parallel tissue chambers with individual cell loading ports and a common media inlet (in) and outlet (out). The media channels run parallel to each tissue chamber, and the fenestration barrier provides protection from fluid shear stress while allowing for exchange of media via diffusion. Anchor pillars located at both extremities of the tissue chamber provide attachment points to keep the cardiac muscle elongated and prevent collapsing. Scale bars represent 2000 μm in the full device (left panel) and 100 μm in the close up (right panel). (B) Phase contrast images of the MPS with cardiac tissues formed using WTC (top) and SCVI20 (bottom) cells. Scale bars represent 100 μm. (C) Fluorescent voltage traces (black and dashed red curves) are analyzed for action potential duration at 80 and 30% signal amplitude (APD80 and APD30, respectively). The beat shape metric triangulation is calculated as (APD80 – APD30)/APD80. A higher triangulation value (dashed red curve) is associated with increased arrhythmia risk. Importantly, normalizing to the APD80 decouples the triangulation value from other electrophysiological changes such as beat rate or peak width. (D) Classification of beat shape quality: representative voltage fluorescence traces of a normal beat shape, three types of arrhythmia-like events (early afterdepolarization (EAD); irregular beat pattern; fast spikes without discernable baseline), a weak and noisy trace for which the beat features could not be analyzed, and a trace of a non-beating tissue. The colored rectangles represent the color code used in the bar charts throughout the article.
Figure 2
Figure 2
Evaluation of pro-arrhythmic effects of the high-risk drug dofetilide. Results are shown for the MPS generated from the WTC cell line (A–C) and the SCVI20 cell line (D–F). Panels (A, D) show the dose-dependent change in action potential duration (corrected to 1 Hz beat rate). Panels (B, E) show the beat shape metric triangulation calculated as (APD80 – APD30)/APD80 for voltage traces. Panels (C, F) show the percentage of the MPS exhibiting arrhythmia-like event (red), weak signals (gray), or non-beating tissues (black), as defined in Figure 1. Spontaneous voltage and calcium traces were considered for this analysis. (G) Expected percent ion channel block determined from tested drug doses from the literature. Statistical analysis: mixed-effects analysis with the Geisser–Greenhouse correction followed by Dunnett’s multiple comparison test to dose 0. Replicates are from independent tissues. Reported significance levels are p < 0.05 (*), 0.01 (**), 0.001 (***), and 0.0001 (****).
Figure 3
Figure 3
Evaluation of pro-arrhythmic effects of the high-risk drug bepridil. Results are shown for the MPS generated from the WTC cell line (A–C) and the SCVI20 cell line (D–F). Panels (A, D) show the dose-dependent change in action potential duration (corrected to 1 Hz beat rate). Panels (B, E) show the beat shape metric triangulation calculated as (APD80 – APD30)/APD80 for voltage traces. Panels (C, F) show the percentage of the MPS exhibiting any sort of arrhythmia-like event (red), weak signals (gray), or non-beating tissues (black). Spontaneous voltage and calcium traces were considered for this analysis. (G) Expected percent ion channel block at tested drug doses based on literature values. Statistical analysis: mixed-effects analysis with the Geisser–Greenhouse correction followed by Dunnett’s multiple comparison test to dose 0. Replicates are from independent tissues. Reported significance levels are p < 0.05 (*), 0.01 (**), 0.001 (***), and 0.0001 (****).
Figure 4
Figure 4
Evaluation of pro-arrhythmic effects of the intermediate-risk drug amiodarone. Results are shown for the MPS generated from the WTC cell line (A–C) and the SCVI20 cell line (D–F). Panels (A, D) show the dose-dependent change in action potential duration (corrected to 1 Hz beat rate). Panels (B, E) show the beat shape metric triangulation calculated as (APD80 – APD30)/APD80 for voltage traces. Panels (C, F) show the percentage of the MPS exhibiting any sort of arrhythmia-like event (red), weak signals (gray), or non-beating tissues (black). Spontaneous voltage and calcium traces were considered for this analysis. (G) Expected percent ion channel block at tested drug doses based on literature values. Statistical analysis: mixed-effects analysis with the Geisser–Greenhouse correction followed by Dunnett’s multiple comparison test to dose 0. Replicates are from independent tissues. Reported significance levels are p < 0.05 (*), 0.01 (**), 0.001 (***), and 0.0001 (****).
Figure 5
Figure 5
Evaluation of pro-arrhythmic effects of the intermediate-risk drug terfenadine. Results are shown for the MPS generated from the WTC cell line (A–C) and the SCVI20 cell line (D–F). Panels (A, D) show the dose-dependent change in action potential duration (corrected to 1 Hz beat rate). Panels (B, E) show the beat shape metric triangulation calculated as (APD80 – APD30)/APD80 for voltage traces. Panels (C, F) show the percentage of the MPS exhibiting any sort of arrhythmia-like event (red), weak signals (gray), or non-beating tissues (black). Spontaneous voltage and calcium traces were considered for this analysis. (G) Expected percent ion channel block at tested drug doses based on literature values. Statistical analysis: mixed-effects analysis with the Geisser–Greenhouse correction followed by Dunnett’s multiple comparison test to dose 0. Replicates are from independent tissues. Reported significance levels are p < 0.05 (*), 0.01 (**), 0.001 (***), and 0.0001 (****).
Figure 6
Figure 6
Evaluation of pro-arrhythmic effects of the low-risk drug nifedipine. Results are shown for the MPS generated from the WTC cell line (A–C) and the SCVI20 cell line (D–F). Panels (A, D) show the dose-dependent change in action potential duration (corrected to 1 Hz beat rate). Panels (B, E) show the beat shape metric triangulation calculated as (APD80 – APD30)/APD80 for voltage traces. Panels (C, F) show the percentage of the MPS exhibiting any sort of arrhythmia-like event (red), weak signals (gray), or non-beating tissues (black). Spontaneous voltage and calcium traces were considered for this analysis. (G) Expected percent ion channel block at tested drug doses based on literature values. Statistical analysis: mixed-effects analysis with the Geisser–Greenhouse correction followed by Dunnett’s multiple comparison test to dose 0. Replicates are from independent tissues. Reported significance levels are p < 0.05 (*), 0.01 (**), 0.001 (***), and 0.0001 (****).
Figure 7
Figure 7
Evaluation of pro-arrhythmic effects of the low-risk drug mexiletine. Results are shown for the MPS generated from the WTC cell line (A–C) and the SCVI20 cell line (D–F). Panels (A, D) show the dose-dependent change in action potential duration (corrected to 1 Hz beat rate). Panels (B, E) show the beat shape metric triangulation calculated as (APD80 – APD30)/APD80 for voltage traces. Panels (C, F) show the percentage of the MPS exhibiting any sort of arrhythmia-like event (red), weak signals (gray), or non-beating tissues (black). Spontaneous voltage and calcium traces were considered for this analysis. (G) Expected percent ion channel block at tested drug doses based on literature values. Statistical analysis: mixed-effects analysis with the Geisser–Greenhouse correction followed by Dunnett’s multiple comparison test to dose 0. Replicates are from independent tissues. Reported significance levels are p < 0.05 (*), 0.01 (**), 0.001 (***), and 0.0001 (****).
Figure 8
Figure 8
Evaluation of pro-arrhythmic effects of the low-risk drug lidocaine. Results are shown for the MPS generated from the WTC cell line (A–C) and the SCVI20 cell line (D–F). Panels (A, D) show the dose-dependent change in action potential duration (corrected to 1 Hz beat rate). Panels (B, E) show the beat shape metric triangulation calculated as (APD80 – APD30)/APD80 for voltage traces. Panels (C, F) show the percentage of the MPS exhibiting any sort of arrhythmia-like event (red), weak signals (gray), or non-beating tissues (black). Spontaneous voltage and calcium traces were considered for this analysis. (G) Expected percent ion channel block at tested drug doses based on literature values. Statistical analysis: mixed-effects analysis with the Geisser–Greenhouse correction followed by Dunnett’s multiple comparison test to dose 0. Replicates are from independent tissues. Reported significance levels are p < 0.05 (*), 0.01 (**), 0.001 (***), and 0.0001 (****).

References

    1. Craveiro N. S.; Lopes B. S.; Tomás L.; Almeida S. F. Drug Withdrawal Due to Safety: A Review of the Data Supporting Withdrawal Decision. Curr. Drug Saf. 2020, 15, 4–12. 10.2174/1574886314666191004092520. - DOI - PubMed
    1. Stockbridge N.; Morganroth J.; Shah R. R.; Garnett C. Dealing with global safety issues : was the response to QT-liability of non-cardiac drugs well coordinated?. Drug. Saf. 2013, 36, 167–182. 10.1007/s40264-013-0016-z. - DOI - PubMed
    1. Ahmad K.; Dorian P. Drug-induced QT prolongation and proarrhythmia: an inevitable link?. Europace 2007, 9 Suppl 4, iv16-22. 10.1093/europace/eum167. - DOI - PubMed
    2. Antoniou C. K.; Dilaveris P.; Manolakou P.; Galanakos S.; Magkas N.; Gatzoulis K.; Tousoulis D. QT Prolongation and Malignant Arrhythmia: How Serious a Problem?. Eur Cardiol. 2017, 12, 112–120. 10.15420/ecr.2017:16:1. - DOI - PMC - PubMed
    1. Hondeghem L. M. QT prolongation is an unreliable predictor of ventricular arrhythmia. Heart Rhythm. 2008, 5, 1210–1212. 10.1016/j.hrthm.2008.05.006. - DOI - PubMed
    1. Blinova K.; Stohlman J.; Vicente J.; Chan D.; Johannesen L.; Hortigon-Vinagre M. P.; Zamora V.; Smith G.; Crumb W. J.; Pang L.; Lyn-Cook B.; Ross J.; Brock M.; Chvatal S.; Millard D.; Galeotti L.; Stockbridge N.; Strauss D. G. Comprehensive Translational Assessment of Human-Induced Pluripotent Stem Cell Derived Cardiomyocytes for Evaluating Drug-Induced Arrhythmias. Toxicol. Sci. 2017, 155, 234–247. 10.1093/toxsci/kfw200. - DOI - PMC - PubMed

LinkOut - more resources