

Data-Driven Investigation of Tellurium-Containing Semiconductors for CO2 Reduction: Trends in Adsorption and Scaling Relations
- PMID: 35983310
- PMCID: PMC9377373
- DOI: 10.1021/acs.jpcc.2c04810
Data-Driven Investigation of Tellurium-Containing Semiconductors for CO2 Reduction: Trends in Adsorption and Scaling Relations
Abstract
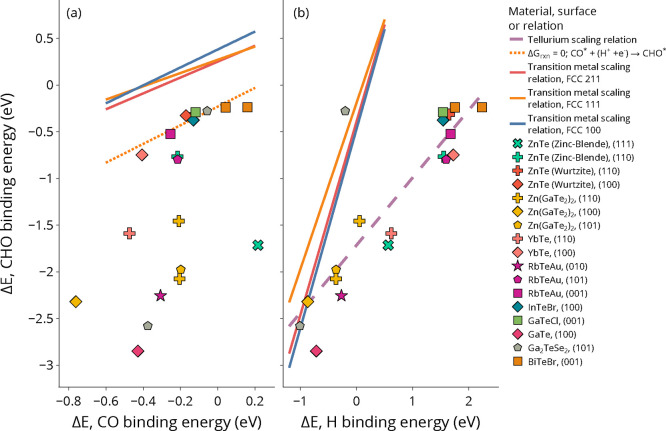
Light-assisted conversion of CO2 into liquid fuels is one of several possible approaches to combating the rise of carbon dioxide emissions. Unfortunately, there are currently no known materials that are efficient, selective, or active enough to facilitate the photocatalytic CO2 reduction reaction (CO2RR) at an industrial scale. In this work, we employ density functional theory to explore potential tellurium-containing photocathodes for the CO2RR by observing trends in adsorption properties arising from over 350 *H, 200 *CO, and 110 *CHO surface-adsorbate structures spanning 39 surfaces of 11 materials. Our results reveal a scaling relationship between *CHO and *H chemisorption energies and charge transfer values, while the scaling relation (typically found in transition metals) between *CO and *CHO adsorption energies is absent. We hypothesize the scaling relation between *H and *CHO to be related to the lone electron located on the bonding carbon atom, while the lack of scaling relation in *CO we attribute to the ability of the lone pair on the C atom to form multiple bonding modes. We compute two predominant orbital-level interactions in the *CO-surface bonds (either using s or p orbitals) in addition to bonding modes involving both σ and π interactions using the Crystal Orbital Hamiltonian Population analysis. We demonstrate that bonds involving the C s orbital are more chemisorptive than the C p orbitals of CO. In general, chemisorption trends demonstrate decreased *H competition with respect to *CO adsorption and enhanced *CHO stability. Finally, we uncover simple element-specific design rules with Te, Se, and Ga sites showing increased competition and Zn, Yb, Rb, Br, and Cl sites showing decreased competition for hydrogen adsorption. We anticipate that these trends will help further screen these materials for potential CO2RR performance.
© 2022 The Authors. Published by American Chemical Society.
Conflict of interest statement
The authors declare no competing financial interest.
Figures

 -px,
-px,  -py, and dxz-px interactions
and the σ interactions from any s orbital interaction as well
as
-py, and dxz-px interactions
and the σ interactions from any s orbital interaction as well
as  -pz, and pz-pz interactions.
In COHP, the area of the curves are proportional to the number of
electrons in the system. All the systems represented above consist
of the same number and types of atoms, and thus same number of electrons.
-pz, and pz-pz interactions.
In COHP, the area of the curves are proportional to the number of
electrons in the system. All the systems represented above consist
of the same number and types of atoms, and thus same number of electrons.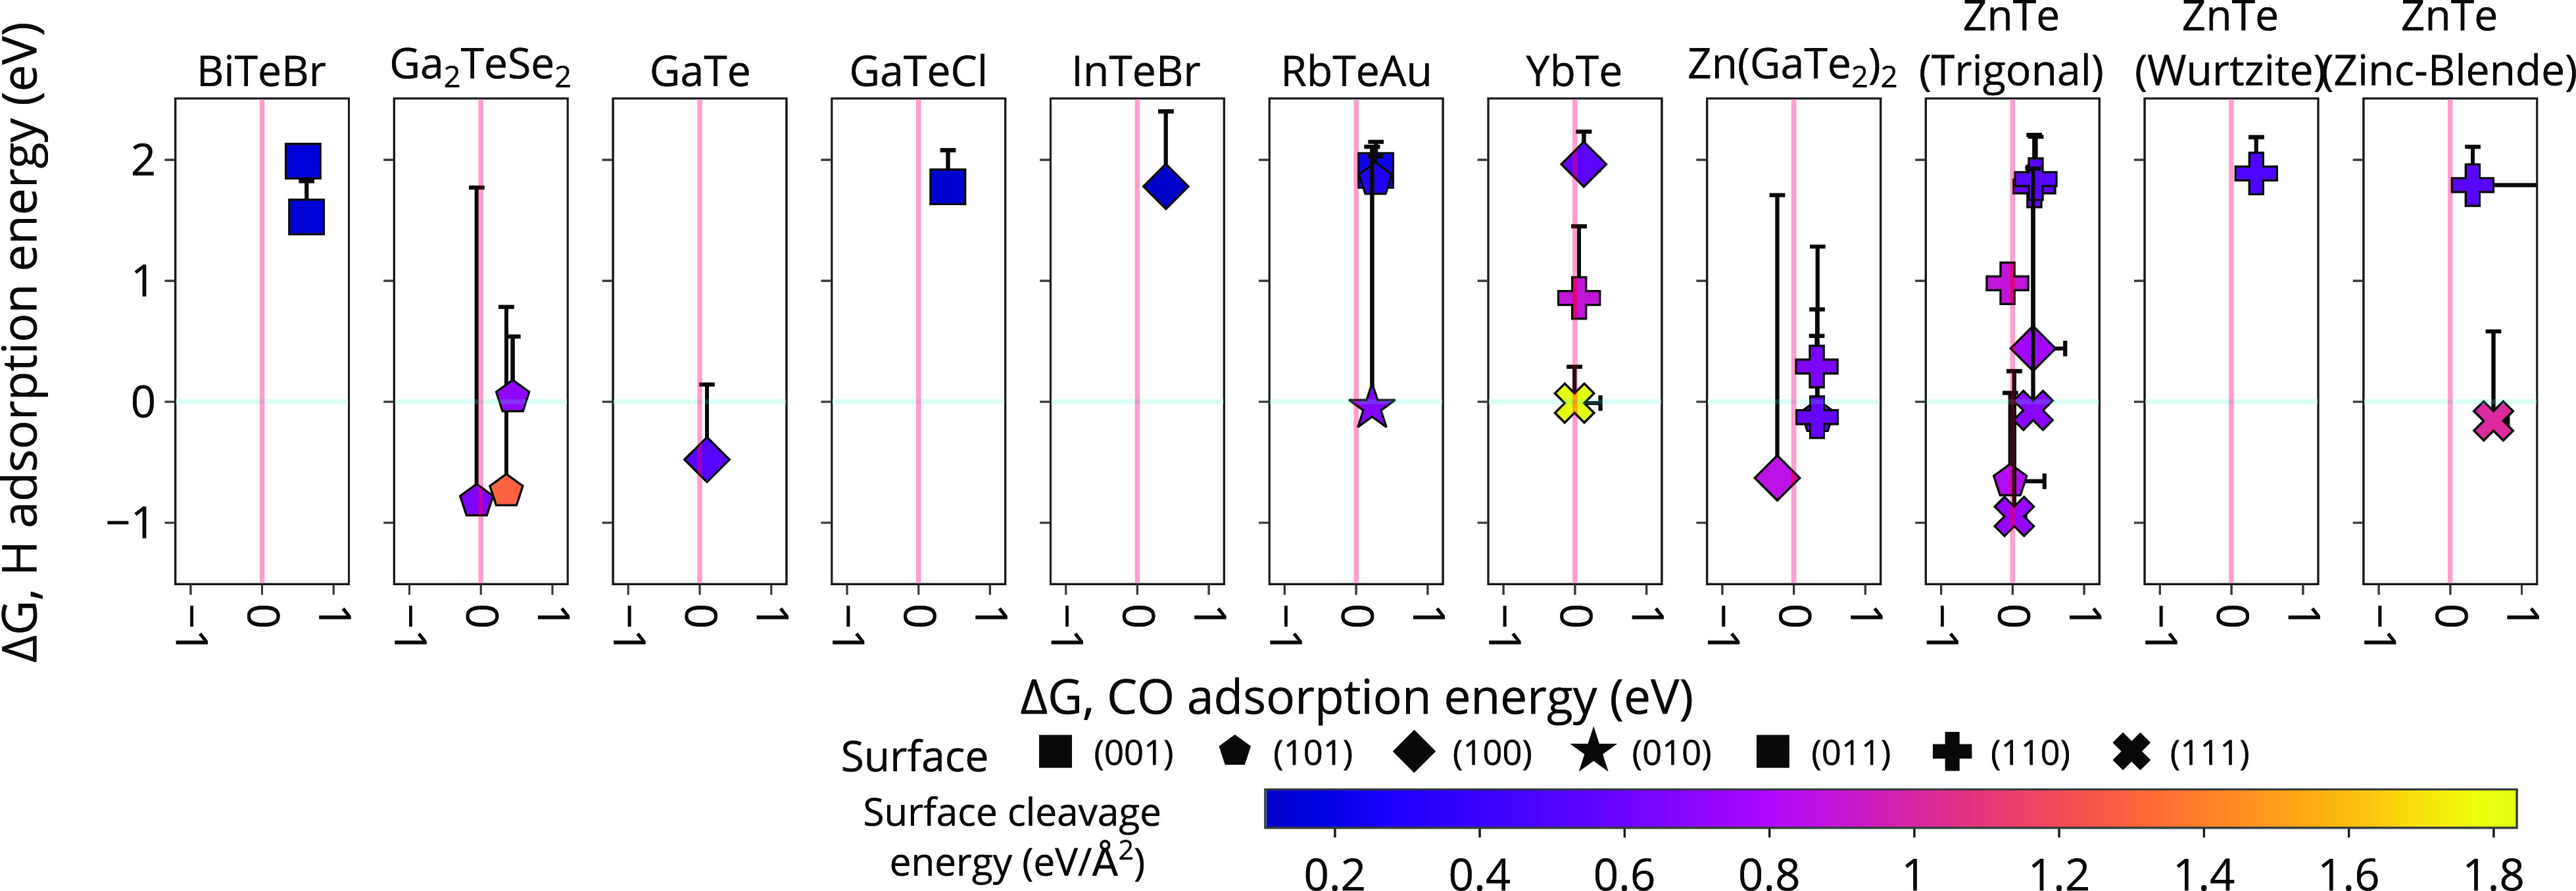


References
-
- Khatib H. IEA World Energy Outlook 2011—A comment. Energy Policy 2012, 48, 737–743. 10.1016/j.enpol.2012.06.007. - DOI
-
Special Section: Frontiers of Sustainability
-
- Fifth Assessment Report of the Intergovernmental Panel on Climate Change; Intergovernmental Panel on Climate Change (IPCC), United Nations, 2014.
-
- Hori Y. In Modern Aspects of Electrochemistry; Vayenas C. G., White R. E., Gamboa-Aldeco M. E., Eds.; Springer New York: New York, NY, 2008; pp 89–189.
-
- Ye W.; Guo X.; Ma T. A review on electrochemical synthesized copper-based catalysts for electrochemical reduction of CO2 to C2+ products. Chemical Engineering Journal 2021, 414, 128825. 10.1016/j.cej.2021.128825. - DOI
LinkOut - more resources
Full Text Sources
Research Materials
Miscellaneous