

Predicting preterm birth through vaginal microbiota, cervical length, and WBC using a machine learning model
- PMID: 35983325
- PMCID: PMC9378785
- DOI: 10.3389/fmicb.2022.912853
Predicting preterm birth through vaginal microbiota, cervical length, and WBC using a machine learning model
Abstract
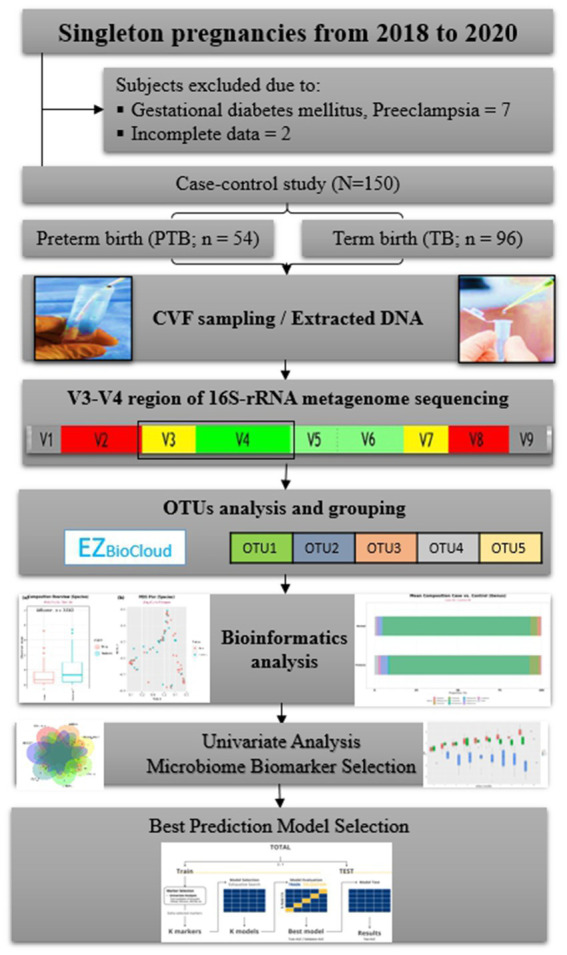
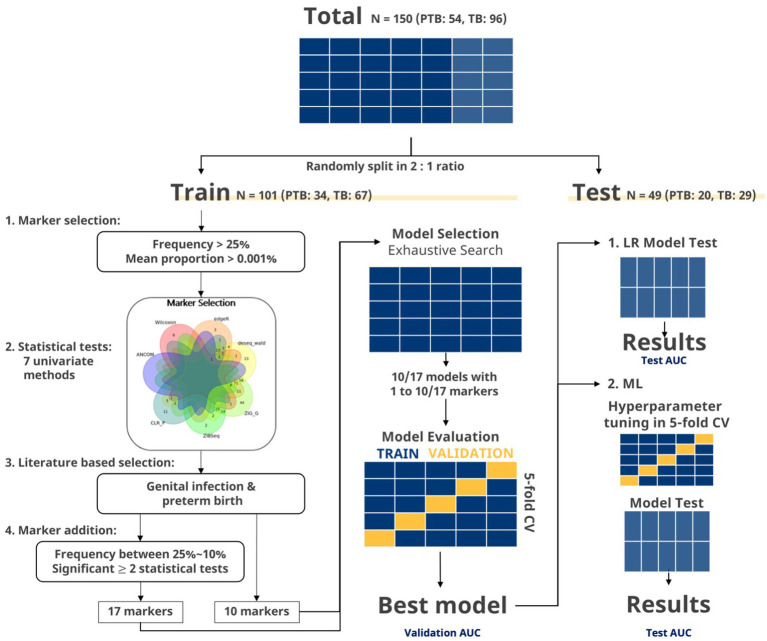
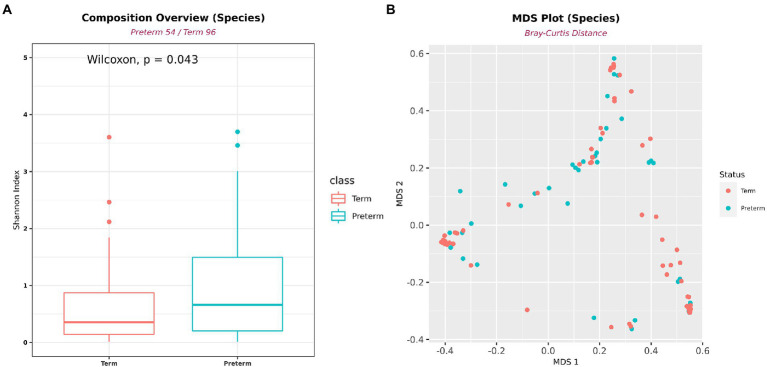
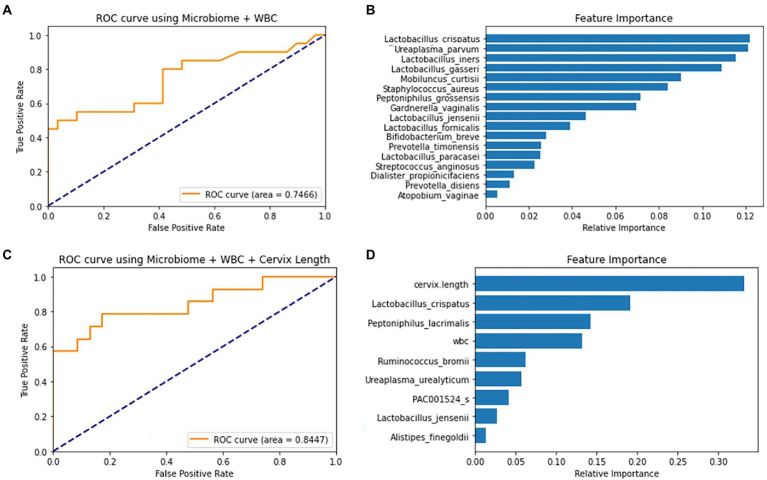
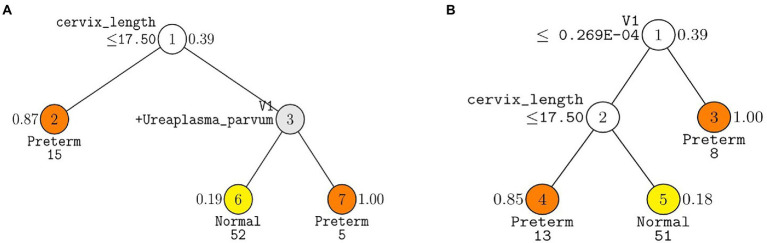
An association between the vaginal microbiome and preterm birth has been reported. However, in practice, it is difficult to predict premature birth using the microbiome because the vaginal microbial community varies highly among samples depending on the individual, and the prediction rate is very low. The purpose of this study was to select markers that improve predictive power through machine learning among various vaginal microbiota and develop a prediction algorithm with better predictive power that combines clinical information. As a multicenter case-control study with 150 Korean pregnant women with 54 preterm delivery group and 96 full-term delivery group, cervicovaginal fluid was collected from pregnant women during mid-pregnancy. Their demographic profiles (age, BMI, education level, and PTB history), white blood cell count, and cervical length were recorded, and the microbiome profiles of the cervicovaginal fluid were analyzed. The subjects were randomly divided into a training (n = 101) and a test set (n = 49) in a two-to-one ratio. When training ML models using selected markers, five-fold cross-validation was performed on the training set. A univariate analysis was performed to select markers using seven statistical tests, including the Wilcoxon rank-sum test. Using the selected markers, including Lactobacillus spp., Gardnerella vaginalis, Ureaplasma parvum, Atopobium vaginae, Prevotella timonensis, and Peptoniphilus grossensis, machine learning models (logistic regression, random forest, extreme gradient boosting, support vector machine, and GUIDE) were used to build prediction models. The test area under the curve of the logistic regression model was 0.72 when it was trained with the 17 selected markers. When analyzed by combining white blood cell count and cervical length with the seven vaginal microbiome markers, the random forest model showed the highest test area under the curve of 0.84. The GUIDE, the single tree model, provided a more reasonable biological interpretation, using the 10 selected markers (A. vaginae, G. vaginalis, Lactobacillus crispatus, Lactobacillus fornicalis, Lactobacillus gasseri, Lactobacillus iners, Lactobacillus jensenii, Peptoniphilus grossensis, P. timonensis, and U. parvum), and the covariates produced a tree with a test area under the curve of 0.77. It was confirmed that the association with preterm birth increased when P. timonensis and U. parvum increased (AUC = 0.77), which could also be explained by the fact that as the number of Peptoniphilus lacrimalis increased, the association with preterm birth was high (AUC = 0.77). Our study demonstrates that several candidate bacteria could be used as potential predictors for preterm birth, and that the predictive rate can be increased through a machine learning model employing a combination of cervical length and white blood cell count information.
Keywords: 16s ribosomal RNA metagenome sequencing; cervicovaginal fluid; machine learning; microbial-marker; pregnancy; preterm birth; vaginal microbiome.
Copyright © 2022 Park, Moon, Kang, Kim, You, Kwon, Ansari, Hur, Park and Kim.
Conflict of interest statement
The authors declare that the research was conducted in the absence of any commercial or financial relationships that could be construed as a potential conflict of interest.
Figures
Similar articles
-
A specific bacterial DNA signature in the vagina of Australian women in midpregnancy predicts high risk of spontaneous preterm birth (the Predict1000 study).Am J Obstet Gynecol. 2021 Feb;224(2):206.e1-206.e23. doi: 10.1016/j.ajog.2020.08.034. Epub 2020 Aug 27. Am J Obstet Gynecol. 2021. PMID: 32861687
-
Prediction of preterm birth based on machine learning using bacterial risk score in cervicovaginal fluid.Am J Reprod Immunol. 2021 Sep;86(3):e13435. doi: 10.1111/aji.13435. Epub 2021 May 10. Am J Reprod Immunol. 2021. PMID: 33905152
-
Vaginal microbiome in early pregnancy and subsequent risk of spontaneous preterm birth: a case-control study.BJOG. 2019 Feb;126(3):349-358. doi: 10.1111/1471-0528.15299. Epub 2018 Jun 27. BJOG. 2019. PMID: 29791775
-
Relationship of Lactobacillus Vaginal Microbiota Changes and the Risk of Preterm Birth: A Systematic Review and Meta-Analysis.J Womens Health (Larchmt). 2024 Feb;33(2):228-238. doi: 10.1089/jwh.2023.0393. Epub 2023 Dec 8. J Womens Health (Larchmt). 2024. PMID: 38064523
-
Vaginal Microbiome and Pregnancy Complications: A Review.J Clin Med. 2024 Jun 30;13(13):3875. doi: 10.3390/jcm13133875. J Clin Med. 2024. PMID: 38999442 Free PMC article. Review.
Cited by
-
Maternal and infant microbiome: next-generation indicators and targets for intergenerational health and nutrition care.Protein Cell. 2023 Nov 8;14(11):807-823. doi: 10.1093/procel/pwad029. Protein Cell. 2023. PMID: 37184065 Free PMC article. Review.
-
DeepMPTB: a vaginal microbiome-based deep neural network as artificial intelligence strategy for efficient preterm birth prediction.Biomark Res. 2024 Feb 14;12(1):25. doi: 10.1186/s40364-024-00557-1. Biomark Res. 2024. PMID: 38355595 Free PMC article.
-
Effect of Particulate Matter 2.5 on Fetal Growth in Male and Preterm Infants through Oxidative Stress.Antioxidants (Basel). 2023 Oct 26;12(11):1916. doi: 10.3390/antiox12111916. Antioxidants (Basel). 2023. PMID: 38001768 Free PMC article.
-
Strategies for Safeguarding High-Risk Pregnancies From Preterm Birth: A Narrative Review.Cureus. 2024 Mar 7;16(3):e55737. doi: 10.7759/cureus.55737. eCollection 2024 Mar. Cureus. 2024. PMID: 38586732 Free PMC article. Review.
-
Predicting Spontaneous Preterm Birth Using the Immunome.Clin Perinatol. 2024 Jun;51(2):441-459. doi: 10.1016/j.clp.2024.02.013. Epub 2024 Apr 4. Clin Perinatol. 2024. PMID: 38705651 Free PMC article. Review.
References
-
- Ananth C. V., Friedman A. M., Goldenberg R. L., Wright J. D., Vintzileos A. M. (2018). Association between temporal changes in neonatal mortality and spontaneous and clinician-initiated deliveries in the United States, 2006–2013. JAMA Pediatr. 172, 949–957. doi: 10.1001/jamapediatrics.2018.1792, PMID: - DOI - PMC - PubMed
-
- Bray J. R., Curtis J. T. (1957). An ordination of the upland forest communities of southern Wisconsin. Ecol. Monogr. 27, 325–349. doi: 10.2307/1942268 - DOI
LinkOut - more resources
Full Text Sources
Other Literature Sources
Research Materials
Miscellaneous