. 2022 Sep 20;146(12):934-954.
doi: 10.1161/CIRCULATIONAHA.121.058411. Epub 2022 Aug 19.

Proteasomal Degradation of TRAF2 Mediates Mitochondrial Dysfunction in Doxorubicin-Cardiomyopathy

Affiliations

Proteasomal Degradation of TRAF2 Mediates Mitochondrial Dysfunction in Doxorubicin-Cardiomyopathy

Rimpy Dhingra et al. Circulation. .

Erratum in

Abstract

Background: Cytokines such as tumor necrosis factor-α (TNFα) have been implicated in cardiac dysfunction and toxicity associated with doxorubicin (DOX). Although TNFα can elicit different cellular responses, including survival or death, the mechanisms underlying these divergent outcomes in the heart remain cryptic. The E3 ubiquitin ligase TRAF2 (TNF receptor associated factor 2) provides a critical signaling platform for K63-linked polyubiquitination of RIPK1 (receptor interacting protein 1), crucial for nuclear factor-κB (NF-κB) activation by TNFα and survival. Here, we investigate alterations in TNFα-TRAF2-NF-κB signaling in the pathogenesis of DOX cardiotoxicity.

Methods: Using a combination of in vivo (4 weekly injections of DOX 5 mg·kg-1·wk-1) in C57/BL6J mice and in vitro approaches (rat, mouse, and human inducible pluripotent stem cell-derived cardiac myocytes), we monitored TNFα levels, lactate dehydrogenase, cardiac ultrastructure and function, mitochondrial bioenergetics, and cardiac cell viability.

Results: In contrast to vehicle-treated mice, ultrastructural defects, including cytoplasmic swelling, mitochondrial perturbations, and elevated TNFα levels, were observed in the hearts of mice treated with DOX. While investigating the involvement of TNFα in DOX cardiotoxicity, we discovered that NF-κB was readily activated by TNFα. However, TNFα-mediated NF-κB activation was impaired in cardiac myocytes treated with DOX. This coincided with loss of K63- linked polyubiquitination of RIPK1 from the proteasomal degradation of TRAF2. Furthermore, TRAF2 protein abundance was markedly reduced in hearts of patients with cancer treated with DOX. We further established that the reciprocal actions of the ubiquitinating and deubiquitinating enzymes cellular inhibitors of apoptosis 1 and USP19 (ubiquitin-specific peptidase 19), respectively, regulated the proteasomal degradation of TRAF2 in DOX-treated cardiac myocytes. An E3-ligase mutant of cellular inhibitors of apoptosis 1 (H588A) or gain of function of USP19 prevented proteasomal degradation of TRAF2 and DOX-induced cell death. Furthermore, wild-type TRAF2, but not a RING finger mutant defective for K63-linked polyubiquitination of RIPK1, restored NF-κB signaling and suppressed DOX-induced cardiac cell death. Last, cardiomyocyte-restricted expression of TRAF2 (cardiac troponin T-adeno-associated virus 9-TRAF2) in vivo protected against mitochondrial defects and cardiac dysfunction induced by DOX.

Conclusions: Our findings reveal a novel signaling axis that functionally connects the cardiotoxic effects of DOX to proteasomal degradation of TRAF2. Disruption of the critical TRAF2 survival pathway by DOX sensitizes cardiac myocytes to TNFα-mediated necrotic cell death and DOX cardiotoxicity.

Keywords: TNF receptor-associated factor 2; doxorubicin; inhibitor of apoptosis proteins; mitochondria; myocytes, cardiac; proteasome endopeptidase complex; tumor necrosis factor-alpha.


Conflict of interest statement

Competing interests

No competing interests.

Figures
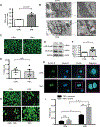
Figure 1.
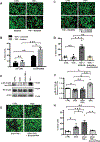
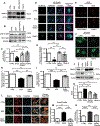
Figure 1.. Doxorubicin Treatment Increases TNFα and Cardiac Injury.
A, TNFα levels (ELISA) following treatment of cardiac myocytes with saline or DOX (10μM) for 18hr, analysed in the cell culture medium (18 hrs), values are normalized to control (CTRL). Data derived from (n=3) independent experiments, assessed in triplicates for each condition tested, expressed as Mean ± SEM, analyzed by one- sample t-test with control set to 1. Statistical difference from CTRL N.Sp=0.057. B, Representative electron micrographs (5800× magnification) of cardiac muscle derived from mouse hearts following treatment with saline or Doxorubicin (DOX), bar=2μm.Top left: Normal ultrastructure in saline treated mice, Top right: magnified inset. Bottom left: Defective ultrastructure in DOX treated mice, Bottom right: magnified inset; red arrows depict subcellular abnormalities C, Representative fluorescent images of vehicle (CTRL) and TNFα (10nM) treated cardiac myocytes stained with vital dyes Calcein-AM and Ethidium homodimer for cell viability assessment, live cells (green fluorescence) and dead cells (red fluorescence) respectively, bar=40μm. D, Histogram depicts quantitative data for Panel C, Data are expressed as Mean ± SEM from n=4 independent myocyte isolations counting > 200 cells for each condition tested, analyzed by student’s t-test, not statistically significant (N.S.) from CTRL N.S.p=0.768. E, Western Blot analysis for phosphorylated (serine 536) and total NF-κB p65; α-sarcomeric Actin served as loading control. F, Histogram depicts quantitative data for normalized phosphorylated NF-κB to total NF-κB protein ratio for panel E. Data are expressed as Mean ± SEM, n=5 independent experiments, analysed by one-sample t-test, CTRL vs TNFα *p=0.027 G, Acetylated NF-κB (Ac- NF-κB) shown by epifluorescence microscopy (green) in cardiac myocytes treated with vehicle or TNFα (10nM) and Hoechst 33528 dye for nuclear morphology (blue). Magnified insets are provided for dual stained images, bar=10μm. H, Cell viability of cardiac myocytes treated with vehicle and DOX (10μM) alone or in combination with TNFα (10nM), bar= 40μm. I, Histogram depicts quantitative data for panel H. Data are expressed as Mean ± SEM derived from n=6 independent myocyte isolations, counting > 200 cells for each condition tested, analysed by two-way ANOVA followed by SIDAK post-hoc test. Statistical significance between CTRL vs DOX *p=0.012; CTRL vs TNFα N.S.p>0.89; DOX vs DOX+ TNFα ***p=0.0009; TNFα vs DOX+ TNFα ***p<0.0001.
Figure 2.
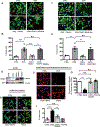
Figure 2.. TNFα Mediates Cell Death in Doxorubicin Treated Cardiac Myocytes that is Dependent upon Bnip3.
A, Cell viability of cardiac myocytes treated with TNFα(10nM) rendered defective for NF-κB activation with an adenovirus encoding kinase defective mutant of IKKβ (IKKβK-M). Ad CMV was used as a control to Ad IKKβK-M Cell viability was performed as detailed in Figure 1C, bar= 40μm. B, Histogram depicts quantitative data for panel A. Data are analysed by two-way ANOVA followed by Sidak post hoc test and are expressed as Mean ± SEM derived from n=4 independent cardiac myocyte isolations counting > 200 cells per each condition tested, CTRL vs TNFα N.S.p> 0.90 (not significant, N.S.); CTRL vs IKKβKM **p=0.002; TNFα vs TNFα+IKKβKM ***p<0.0001; IKKβKM vs TNFα+IKKβKM *p=0.01. C, Cell viability of cardiac myocytes treated with TNFα rendered defective for NF-κB activation either with a kinase defective mutant of IKKβ, (IKKβK-M) in the absence or presence of Bnip3 shRNA (adenovirus) to knock down Bnip3 (see methods for details). Cell viability was performed as detailed in Figure 1C, bar= 40μm. D, Histogram depicts quantitative data for panel C. Data are expressed as Mean ± SEM derived from n=3–5 independent cardiac myocyte isolations counting > 200 cells per each condition tested, analysed by one-way ANOVA followed by Bonferroni post hoc test. CTRL vs TNFα N.S.p> 0.9999 (not significant, N.S.); TNFα vs TNFα+IKKβKM ***p=<0.0001; TNFα vs TNFα+IKKβKM+ Bnip3shRNA N.S.p> 0.9999. E, Representative Western Blot analysis of cardiac cell lysate derived from control (CTRL) and Doxorubicin (DOX) treated cardiac myocytes in the absence and presence of TNFα. The filter was probed with antibodies directed against phosphorylated p65 NF-κB (serine 536) and total p65 NF-κB; α-sarcomeric Actin was used as a loading control. F, Histogram depicts quantitative data for phosphorylated p65NF-ΚB/total NF-κB protein ratio for panel E. Data are expressed as Mean ± SEM, n=5 independent experiments. Statistical significance was analysed by comparing the treatment groups to the control using one-sample t-test with control set to 1 followed by comparisons between treatment groups using series of paired t-tests. CTRL vs DOX *p=0.025; CTRL vs TNFα *p=0.023; CTRL vs DOX+ TNFα N.S.p= 0.22 and comparison between the treatment groups by two tailed paired t-tests: TNFα vs DOX+ TNFα ** p=0.0074; DOX vs TNF *p=0.017; DOX vs DOX+ TNFα N.S.p=0.55. G, Representative fluorescent images for cell viability of cardiac myocytes treated with DOX (10μM) alone or in combination with TNFα (10nM) in the absence and presence of Bnip3 shRNA, bar= 40μm. H, Histogram depicts quantitative data for panel G. Data are expressed as Mean ± SEM derived from n=4–6 independent myocyte isolations, counting > 200 cells for each condition tested, analysed by one-way ANOVA; CTRL vs DOX *p=0.03; DOX vs DOX+ TNFα *p=0.01; DOX+ TNFα vs DOX+ TNFα+Bnip3shRNA ***p=0.0002; CTRL vs DOX+ TNFα+Bnip3shRNA N. Sp>0.99; CTRL vs DOX+ TNFα***p<0.0001
Figure 3.
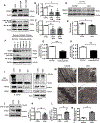
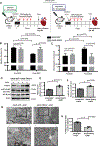
Figure 3.. TRAF2 Signaling is Suppressed in Cancer Patients with Doxorubicin Cardiomyopathy.
A, Representative Western Blot analysis of cardiac cell lysate derived from saline control (CTRL) and Doxorubicin (DOX) (5 μM and 10 μM, 18hr) treated cardiac myocytes, analyzed for TRAF2, total and phosphorylated (Serine 536) NF-κB p65 protein expression. B, Histograms depicts quantitative data for TRAF2 protein for panel A. Data are expressed as Mean ± SEM, (n=3–5) and are analysed by one-sample t-test with control value set to 1, CTRL vs DOX 5μM N.S.p=0.07; CTRL vs DOX 10μM *p=0.03. C, Quantitative data for normalized phosphorylated NF-κB for the data shown in panel A. Data are expressed as Mean ± SEM, (n=4–5), CTRL vs DOX5 μM N.S.p=0.057; CTRL vs DOX 10 μM *p=0.013. D, Western Blot analysis of cardiac cell lysate derived from mouse hearts of saline treated (saline) and DOX treated mice. The filter was probed with antibodies directed against TRAF2, α-sarcomeric Actin served as a loading control. E, Histogram depicts quantitative data for TRAF2 protein, normalized to α-sarcomeric Actin, shown in panel D. Statistical significance was analysed using a parametric student t-test. Data are expressed as Mean ± SEM, n=3 Saline (control) and 4 DOX hearts, Saline vs DOX *p=0.029. F, Western Blot analysis of human left ventricular (LV) tissue lysate derived from patients treated with DOX (DOX, lanes 3–6) and from normal hearts that were donated for transplantation but not used (Controls, lanes 1 and 2), see methods for details. The filter was probed with antibodies directed against TRAF2, phosphorylated NF-κB (serine 536), total NF-κB and GAPDH as a loading control. G, Histogram depicts quantitative data for normalized TRAF2 protein shown in panel F. Statistical significance was analysed using a parametric student t-test. Data are expressed as Mean ± SEM, Normal (CTRL) vs Patients who received DOX (DOX) **p=0.002. H, Quantitative data for normalized NF-κB protein data shown in panel F. Statistical significance was analysed using a parametric student t-test. Data are expressed as Mean ± SEM, Normal (CTRL) vs Patients who received DOX (DOX) **p=0.003. I, Immunoprecipitation assay (IP) and Western Blot analysis of cardiac cell lysate derived from saline (CTRL) and DOX treated cells, the IP was performed using an antibody directed against RIPK1, the filter was probed with murine, or rabbit antibodies directed against TRAF2, K-63 ubiquitin and RIPK1, α-sarcomeric Actin served as a loading control. J, Representative Western Blot analysis of cardiac cell lysate derived from saline (CTRL) and DOX treated cardiac myocytes probed with antibodies directed against phospho (Serine 536) NF-κB p65 and Bnip3, respectively. K, Quantitative data for NF-κB protein shown in panel J. Data are expressed as Mean ± SEM (n=5), analysed by one-sample t-test with control set to 1, CTRL vs DOX *p=0.019. L, Quantitative data for normalized Bnip3 protein shown in panel J. Data are expressed as Mean ± SEM (n=5), analysed by one-sample t-test with control set to 1, CTRL vs DOX *p=0.021. M: Representative electron micrographs (5800x magnification) of cardiac muscle derived from saline (Top) and DOX (Bottom) treated mice, magnified insets depict mitochondrial abnormalities and structural defects, bar=2μm. N, Histogram depicts % mitochondria with severe defects; mitochondria with cristae structure completely diminished were scored as severely damaged. A total of mitochondria>500 was analyzed from at least 6 sections of electron micrographs derived from 4 mice per group. Statistical significance between saline and DOX was analysed parametric student t-test ***p<0.0001
Figure 4.
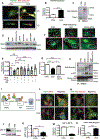
Figure 4.. TRAF2 Undergoes Proteasomal Degradation in Doxorubicin Treated Cardiac Myocytes.
A, Immunofluorescence microscopy of saline (CTRL) and DOX treated cardiac myocytes. Cells were labeled with antibodies directed against TRAF2 (green) and K48-ubiquitin (Red), images show normal view (Top) and 3D view (Bottom) to depict co-localization pattern (yellow), bar=5μm. B, Histogram represents Pearson’s coefficient as an index of co-localization of TRAF2 and K48 ubiquitin proteins, analyzed by a non-parametric Mann-Whitney U test (n=3 independent experiments), Data are expressed as Mean ± SEM, statistical significance from CTRL, ***p<0.0001. C, Immunoprecipitation with TRAF2 followed by Western Blot analysis for CTRL and DOX treated cardiac myocytes. The filter was probed with antibody directed against K48 ubiquitin, normalized to α-sarcomeric Actin. D, Western Blot analysis of cardiac cell lysate derived from CTRL and DOX (10μM) in the absence and presence of proteasome inhibitor, Lactacystin (LACTA, 1μM) or autophagy inhibitors, Chloroquine (CQ, 10 μM) and 3- Methyl Adenine (3 MA, 5mM), the filter was probed with an antibody directed against TRAF2, α-sarcomeric Actin was used as a loading control. E, Histograms depict quantitative data for normalized TRAF2 protein for the data shown in panel D. Data are expressed as Mean ± SEM, n=3–5 independent experiments, compared the treatment groups to the control using one-sample t-test with control set to 1 followed by comparisons between treatment groups using series of paired t-tests, CTRL vs DOX **p=0.007; CTRL vs DOX+Lacta N.S.p=0.27; DOX vs DOX+LACTA *p=0.02; DOX vs DOX+CQ N.S.p=0.39; DOX vs DOX+3MA N.S.p=0.29; CTRL vs DOX+CQ N.S.p=0.71; CTRL vs DOX+3MA N.S. p=0.188; CTRL vs Lacta N.S. p=.88; CTRL vs CQ N.S. p=.74; CTRL vs 3MA N.S.p=.99. F, Immunofluorescence of cardiac myocytes from CTRL and DOX treated cells stained for TRAF2 in the absence or presence of Lactacystin (LACTA, 1μM), Magnified insets are provided by dotted regions, bar =10μm. G, Histogram presents perinuclear TRAF2 protein intensity for the data shown in panel F, analyzed by one-sample t-test with control set to 1 followed by Holm-Sidak correction for multiple comparisons (n=3 independent experiments), Data are expressed as Mean ± SEM, CTRL vs DOX ***p=0.0009; DOX vs DOX+LACTA *p=0.025; CTRL vs DOX+LACTA N.S.p=0.75. H, Immunoprecipitation (IP) assay and Western Blot analysis for saline (CTRL) and DOX treated cardiac myocytes in the absence and presence of LACTA, 1μM. The IP was performed with an antibody directed against TRAF2, the filter was probed for c-IAP1, TRAF2 and K48 ubiquitin. I, Schematic model for regulation of TRAF2 protein stability; c-IAP1 which possess endogenous ubiquitin - ligase activity can auto-activate and ubiquitinate TRAF2 in absence of the de-ubiquitinating enzyme USP19 (Ubiquitin Specific Protease19). Loss of USP19 leads to K48 ubiquitination of TRAF2 by c-IAP1 resulting in proteasomal degradation of TRAF2. J, Western Blot analysis of cardiac cell lysate derived from saline (CTRL) and DOX treated cells. The filter was probed with an antibody directed against USP19. K, Quantitative data for normalized USP-19 protein shown in panel J. Data are expressed as Mean ± SEM (n=3), statistical significance from CTRL determined by one-sample t-test with control set to 1, CTRL vs DOX *p=0.015. L, Immunofluorescence staining of saline (CTRL) and DOX treated cardiac myocytes stained for c-IAP1 (green) and USP19 (red). M, Histogram presents Pearson’s coefficient as an index of co-localization of c-IAP1 and USP19 proteins, shown in panel L, analyzed by nonparametric Mann-Whitney U test (n=3 independent experiments), Data are expressed as Mean ± SEM, statistical significance from CTRL, ***p<0.0001. N, Immunofluorescence staining for c-IAP1 (green) and K48 ubiquitin(red), magnified insets are depicted by the dotted square, white arrows mark co-localization (yellow fluorescence) in perinuclear area, bar= 5μm. O, Histogram presents Pearson’s coefficient as an index of co-localization of c-IAP1 and K48 ubiquitin proteins, for the images shown in panel M, analyzed by non=parametric Mann-Whitney U test (n=3 independent experiments), Data are expressed as Mean ± SEM, statistical significance from CTRL, ***p<0.0001.
Figure 5.
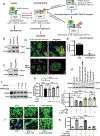
Figure 5.. Ubiquitination Status of c-IAP1 Influences DOX Induced Loss of TRAF2 and Cardiotoxicity.
A, Schematic diagram represents two mechanisms for the regulation of c-IAP1mediated proteasomal degradation of TRAF2 in cardiac myocytes treated with DOX. Mechanism 1- Inactivation of c-IAP1 activity. Mechanism 2- Activation of USP19 activity. Deubiquitination of c-IAP1 by either mechanism will prevent K48 ubiquitination and proteasomal degradation of TRAF2. B, Western Blot analysis verifies the expression of HA tagged c-IAP1 wild type (HA c-IAP1wt) and HA tagged c-IAP1 H588A c-IAP1 mutant, defective for E3 ligase (HA-c-IAP1 Mut).C, Western Blot analysis to verify the Flag- tagged USP19 (Flag-USP19). D, Immunofluorescence staining of DOX treated cardiac myocytes in the absence and presence of de-ubiquitinase USP19. Cells were stained for c-IAP (green) and K48 ubiquitin (Red), magnified insets are depicted by the dotted square, white arrows demark co-localization (yellow) in perinuclear area, bar= 10μm. E, Histogram represents Pearson’s coefficient to show co-localization of c-IAP1 and K48 ubiquitin, analyzed by the non-parametric Mann-Whitney U test. Data are expressed as Mean ± SEM (n=3 independent experiments), statistical significance from DOX, ***p<0.0001. F, Western Blot analysis of the lysate derived from vector control cardiac myocytes treated with saline (CTRL) and DOX (10μM) in the absence and presence of USP19. The filter was probed with antibodies directed against TRAF2 and α-sarcomeric Actin, as a protein loading control. G, Histograms depicts quantitative data for normalized TRAF2 protein for the data shown in panel F. Data are expressed as Mean ± SEM, n=4–5 independent experiments, compared the treatment groups to the control using one-sample t-test with control set to 1 followed by comparisons between treatment groups using series of paired t-tests: CTRL vs DOX **p=0.004; DOX vs DOX+USP19(0.3μg) N.S.p=0.97; DOX vs DOX+USP19(0.4μg) NS p=0.16; DOX vs DOX+USP19(0.5μg) **p=0.01; CTRL vs DOX+USP19(0.3μg) *p=0.049; CTRL vs DOX+USP19(0.5μg) N.S.p=0.06. H, Western Blot analysis for TRAF2 expression in cardiac cell lysates derived from vehicle (CTRL) and DOX (10μM) treatment in the presence of HA-c-IAP1 WT, HA- c-IAP1 Mut and Flag-USP19. α-sarcomeric Actin was as a control for protein loading. I, Quantitative data for normalized TRAF2 protein shown in panel H. Data are expressed as Mean ± SEM, n=4 independent experiments, compared the treatment groups to the control using one-sample t-test with control set to 1 followed by comparisons between treatment groups using series of paired t-tests: CTRL vs DOX *p=0.027; CTRL vs DOX + c-IAP1 WT **p=0.005; CTRL vs DOX + c-IAP1 Mut N.S. p=0.45; CTRL vs c-IAP1 WT N.S. p=0.28; CTRL vs c-IAP1 Mut N.S. p=0.25; DOX vs DOX + c-IAP1 WT N.S.p=0.81; DOX vs DOX + c-IAP1 Mut N.S.p=0.23; DOX + c-IAP1 Mut vs c-IAP1 Mut N.S.p=0.99; c-IAP1 Mut vs c-IAP1 WT N.S.p=0.99. J, Cell viability in saline (CTRL) and DOX treated cardiac myocytes in the presence of exogenous CTRL vector, HA-c-IAP1 WT and HA-c-IAP1 Mut, bar= 40µm. K, Histogram represents quantitative data for panel J. Data are expressed as Mean ± SEM, percent death from control, n=3–4 independent myocyte isolations, counting > 200 cells for each condition tested, analysed by one-way ANOVA; CTRL vs DOX ***p<0.0001; DOX vs DOX + c-lAP wt. N.S.p > 0.9999, Not significant (N.S.); DOX vs DOX + c-lAP Mut *** p<0.0001.
Figure 6.
Figure 6.. TRAF2 Restores NF-κB Signaling and Suppresses Doxorubicin Induced Bnip3 Activation, Mitochondrial Defects and Necrotic Death induced by Doxorubicin.
A, Western Blot analysis of cardiac cell lysate derived from saline (CTRL) or Doxorubicin (DOX, 10μM) treated cells in the absence and presence of adenovirus encoding TRAF2. The filter was probed with an antibody directed against TRAF2. B, Western Blot analysis for phosphorylated and total NF-κB p65 expression under conditions shown in Panel A. C, Quantitative data for normalized NF-κB p65 protein shown in panel B. Data are expressed as Mean ± SEM, n=3 independent experiments compared the treatment groups to the control using one-sample t-test with control set to 1 followed by comparisons between treatment groups using series of paired t-tests: CTRL vs DOX *p=0.041; CTRL vs DOX + TRAF2 N.S.p=60; CTRL vs TRAF2 N.S. p=0.77; DOX vs DOX + TRAF2 *p=0.026; DOX vs TRAF2 **p=0.002; DOX + TRAF2 vs TRAF2 N.S.p=0.22. D, Epifluorescence microscopy of cardiac myocytes for the conditions shown in panel A, cells were stained for activated acetylated NF-κB (Ac- NF-κB p65, green fluorescence), Hoechst 33528 (blue fluorescence) for nuclear DNA, Magnified insets are depicted by dotted squared region, bar= 10μm. E, Representative epifluorescence microscopy for Super oxide, Reactive Oxygen Species (ROS) in cardiac myocytes from saline (CTRL) and Doxorubicin (DOX, 10μM) treated cells stained with dihydroethidium dye, (red), bar= 40μm (increased red fluorescence indicates increased ROS production). F, Epifluorescence images depicting mitochondrial permeability transition pore (mPTP, green) bar=10μm (Reduced green fluorescence indicates mPTP opening). G, Histogram represents quantitative data for panel F, reflecting percent change in fluorescence intensity as an index of mPTP opening, values were normalized to CTRL, data are expressed as Mean ± SEM, n=4 independent myocyte isolations, Statistical significance was analysed by comparing the treatment groups to the control using one-sample t-test with control set to 100 followed by comparisons between treatment groups using series of paired t-tests: CTRL vs DOX **p=0.003; CTRL vs DOX + TRAF2 N.S.p=0.32; CTRL vs TRAF2 N.S.p=0.48; DOX vs DOX + TRAF2 **p=0.009; TRAF2 vs DOX + TRAF2 N.S.p =0.29. H, Mitochondrial oxygen consumption rate (OCR pmol/min) by XF 96 Seahorse metabolic analyzer, see methods for details, in saline (CTRL) or Doxorubicin (DOX, 10μM) treated cells in the absence and presence of adenovirus encoding TRAF2. The values were normalized to CTRL, data are expressed as Mean ± SEM, from n=4 independent myocyte isolations using > n=5 replicates for each condition tested, Statistical significance was analysed by comparing the treatment groups to the control using one-sample t-test with control set to 100 followed by comparisons between treatment groups using series of paired t-tests: CTRL vs DOX **p=0.002; CTRL vs DOX + TRAF2 N.S.p=0.081;DOX vs DOX + TRAF2 **p=0.007. I, Respiratory Spare capacity (OCR pmol/min), data expressed as Mean ± SEM, n=4 independent myocyte isolations using >n=5 replicates for each condition tested. Statistical significance was analysed by comparing the treatment groups to the control using one-sample t-test with control set to 100 followed by comparisons between treatment groups using series of paired t-tests: CTRL vs DOX ***p=.0005; CTRL vs DOX + TRAF2 N.S.p=0.10; DOX vs DOX + TRAF2 **p=0.008. J, Western Blot analysis of cell lysate derived from saline (CTRL) and Doxorubicin (DOX) treated cardiac myocytes. The filter was probed with a murine antibody directed against Bnip3 and TRAF2, α-sarcomeric Actin served as a loading control. K, Quantitative data for normalized Bnip3 protein shown in panel J. Data are expressed as Mean ± SEM, n=3 independent experiments, analysed by treatments comparisons to control using one-sample t-test with control set to 1 followed by comparisons between treatment groups using series of paired t-tests: CTRL vs DOX *p=0.012; CTRL vs DOX + TRAF2 N.S.p=0.77; CTRL vs TRAF2 N.S.p=0.19;DOX vs DOX + TRAF2 *p=0.027; DOX vs TRAF2 *p=0.02. L, Immunofluorescence microscopy of cardiac myocytes for mitochondrial localization of Bnip3 for conditions shown in panel H, Bnip3 (green) and mitochondrial marker TOM 20 (red), dotted squared region depicts magnified combination bar= 5μm. M, Pearson’s coefficient analysis for Bnip3/TOM 20 co-localization for the conditions shown in panel L. Data are derived from n=3 independent myocyte isolations, analysed by non-parametric Kruskal-Wallis one-way ANOVA, CTRL vs DOX ***p<0.0001; DOX vs DOX + TRAF2 ***p<0.0001; CTRL vs DOX + TRAF2 N.S.p > 0.9999. N, Lactate dehydrogenase (LDH) release analyzed in media derived from saline (CTRL) and DOX treated cardiac myocytes in the absence and presence of exogenous TRAF2 expression. Data is derived from n=5 independent myocyte isolations using replicates of n=3, values are normalized to CTRL, analyzed by non-parametric Kruskal-Wallis one-way ANOVA. Statistical significance between groups, analysed by one-way ANOVA, CTRL vs DOX, ***p<0.0001; DOX vs DOX + TRAF2, ***p<0.0001; CTRL vs DOX + TRAF2, N.S.p > 0.9999, Not significant.
Figure 7.
Figure 7.. TRAF2 Suppresses Doxorubicin Induced Death of Cardiac Myocytes Dependent on E3 -Ligase Activity and IKKβ-NF-ΚB Signaling.
A, Epifluorescence microscopy of saline (CTRL) and Doxorubicin (DOX,10μM) treated cardiac myocyte in the presence of TRAF2 alone or in combination with kinase inactive IKKβ (IKKβKM). Cardiac myocytes were stained with vital dyes Calcein AM and ethidium homodimer-1 to detect the number of live (green) and dead (red) cells respectively as detailed in Figure 1C, bar= 40μm. B, Histogram represents quantitative data for panel A, Data are expressed as Mean ± SEM of percent dead cells from control, derived from n=3–5 independent myocyte isolations, counting > 200 cells per each condition tested, analysed by one-way ANOVA (Bonferroni); CTRL vs DOX ***p<0.0001; DOX vs DOX + TRAF2 ***p=0.0003; DOX vs DOX + TRAF2+ IKKßKM Not significant (N.S.) N.S.p > 0.9999; DOX + TRAF2 vs DOX + TRAF2+ IKKβKM **p=0.0022. C, Cell viability for saline (CTRL) and DOX,10μM treated cardiac myocytes expressing exogenous wild type TRAF2 (TRAF2 WT) or TRAF2 RING finger mutant (TRAF2 RING mut), defective for E3 ligase activity, bar= 40μm. D, Histogram represents quantitative data for panel C. Data are expressed as Mean ± SEM of percent dead cells of control, from n=4 independent myocyte isolations, analysed by one-way ANOVA followed by Bonferroni multiple comparisons; CTRL vs DOX **p=0.0041; DOX vs DOX + TRAF2 WT **p=0.0028; DOX vs DOX + TRAF2 RING Mut N.S. p=0.97. E, Western Blot analysis of cell lysate derived from of saline (CTRL) and Doxorubicin (DOX,10μM) treated mouse adult cardiac myocytes (ACMC) in the absence and presence of TRAF2 (Adenovirus), α-sarcomeric Actin served as a loading control. F, Epifluorescence microscopy of saline (CTRL) and DOX treated mouse adult cardiac myocytes (ACMC) in the absence and presence of TRAF2. Representative images depicting mitochondrial membrane potential (ψM, red fluorescence); reduced red fluorescence indicates loss of mitochondrial membrane potential. G, Histogram represents quantitative data for panel F, reflecting percent change in fluorescence intensity as an index of loss of membrane potential; all values were normalized to CTRL, data are expressed as Mean ± SEM, n=4 independent myocyte isolations, analysed by comparing treatments to control using one-sample t-test with control set to 100 followed by comparisons between treatment groups using series of paired t-tests: CTRL vs DOX *p=0.0011; CTRL vs DOX + TRAF2 N.S.p=0.615; CTRL vs TRAF2 N.S.p=0.37; DOX vs DOX + TRAF2 *p=0.012; DOX vs TRAF2 *p=0.005. H, Epifluorescence microscopy of saline (CTRL) and DOX treated ACMC in the absence and presence of TRAF2. Cardiac myocytes were stained with vital dyes Calcein- AM and ethidium homodimer-1 to detect the number of live (green) and dead (red) cells respectively as detailed in panel A, bar= 40μm. I, Histogram represents quantitative data for panel H, Data are expressed as Mean ± SEM of percent dead cells from control, derived from n=4 independent myocyte isolations, analysed by one-way ANOVA followed by Bonferroni multiple comparisons; CTRL vs DOX ***p=0.0002; DOX vs DOX + TRAF2 **p=0.008; CTRL vs DOX + TRAF2 N.S.p=0.196
Figure 8.
Figure 8.. TRAF2 Suppresses DOX Induced Mitochondrial Injury and Cardiac Dysfunction in vivo.
A, Experimental strategy, and timeline for DOX treatment in mice following AAV9-GFP or AAV9-TRAF2 infection. One week after tail vein injection of AVV9-GFP as control or AAV9-TRAF2, mice underwent baseline echocardiography followed by doxorubicin (DOX) administration (5 mg/kg IP per week) for 4 weeks for a cumulative dose of 20 mg/kg (see methods for details). Two weeks following the last DOX dose, repeat echocardiography was performed on mice and the study was terminated. B, Ejection fraction (EF %) for AAV9-GFP (n=4) and AAV9-TRAF2 (n=5) mice, measured at baseline (pre-DOX) and 2 weeks post DOX treatment (post-DOX). Statistical significance between baseline (pre- DOX treatment) and post DOX treatment EF of AAV9-GFP and AAV9-TRAF2 mice were analysed by repeated measures two-way ANOVA followed by SIDAK post hoc test. Baseline (pre-DOX) AAV9-GFP vs AAV9- TRAF2 N.S.p=0.703; pre-DOX AAV9-GFP vs post-DOX AAV9-GFP *p=0.030; pre-DOX AAV9-TRAF2 vs post-DOX AAV9-TRAF2 N.S.p=0.99, post-DOX AAV9-GFP vs post-DOX AAV9-TRAF2 *p=0.035. C, End-diastolic volume (EDV) (|jl) for AAV9-GFP (n=4) and AAV9-TRAF2 (n=5) mice were measured at baseline (pre-DOX) and 2 weeks post DOX treatment (post-DOX). Statistical significance between baseline (pre-DOX treatment) and post DOX treatment LVEDV of AAV9-GFP and AAV9-TRAF2 mice were analysed by repeated measures two-way ANOVA followed by SIDAK post hoc test. Baseline (pre-DOX) LVEDV of AAV9-GFP vs AAV9-TRAF2 N.S.p=0.91; pre and post DOX treatment of AAV9-GFP *p=0.07; pre and post DOX treatment of AAV9-TRAF2 N.S.P=0.72, post-DOX treatment of AAV9-GFP vs AAV9-TRAF2 *p=0.045. D, Western blot analysis of cardiac tissue derived from DOX treated AAV9-GFP and AAV9-TRAF2 mice. The filter was probed with antibodies directed against TRAF2, phosphorylated (Serine 536) and total p65NF-ΚB; α-sarcomeric Actin served as a loading control. E, Quantitative data for TRAF2 shown in panel D. Data are expressed as Mean ± SEM, derived from n=3 mice in each group. Statistical significance determined by an unpaired, two-tailed student t-test between AAV9-GFP and AAV9-TRAF2 mice treated with DOX *p=0.011. F, Histogram presents quantitative data for p-p65NF-ΚB/NF-ΚB ratio. Data are expressed as Mean ± SEM, derived from n=3 mice hearts in each group. Statistical significance determined by an unpaired, two-tailed student t-test between AAV9-GFP and AAV9-TRAF2 mice treated with DOX *p=0.005. G, Representative electron micrographs (EM) (12000x magnification) of cardiac muscle derived from DOX treated AAV9-GFP (Left) and AAV9-TRAF2 (Right) mice, magnified insets below, depict mitochondrial abnormalities and structural defects, bar=500nM. H, Histogram depicts % mitochondria with severe defects; Mitochondria with cristae structure completely diminished were scored as severely damaged. A total of mitochondria>500 were analyzed from at least 6 sections of electron micrographs (derived from 3–4 mice) per each treatment group. Statistical significance determined by an unpaired, two-tailed student t-test between AAV9-GFP+ DOX (n=3) and AAV9-TRAF2 +DOX (n=4) *p=0.006. I, Schematic represents a model for disruption of TRAF2 signaling in the pathogenesis of doxorubicin cardiotoxicity. Briefly, inhibition of USP19 in DOX treated cardiac myocytes leads to increased K48 ubiquitination and proteasomal degradation of TRAF2 via E3 ligase activity of cIAP1. Decline in TRAF2 disrupts NF-κB-signaling and promotes Bnip3 activation, mitochondrial perturbations and necrotic cell death.

Comment in

References

    1. Ichikawa Y, Ghanefar M, Bayeva M, Wu R, Khechaduri A, Naga Prasad S V, Mutharasan RK, Naik TJ, Ardehali H. Cardiotoxicity of doxorubicin is mediated through mitochondrial iron accumulation. J Clin Invest. 2014;124:617–630. doi:10.1172/JCI72931. - DOI - PMC - PubMed
    1. Dhingra R, Margulets V, Chowdhury SR, Thliveris J, Jassal D, Fernyhough P, Dorn GW, Kirshenbaum LA. Bnip3 mediates doxorubicin-induced cardiac myocyte necrosis and mortality through changes in mitochondrial signaling. Proc Natl Acad Sci. 2014;111:E5537–E5544. doi:10.1073/pnas.1414665111. - DOI - PMC - PubMed
    1. Bradley JR. TNF-mediated inflammatory disease. J. Pathol. 2008;214:149–160. - PubMed
    1. Lipshultz SE, Cochran TR, Franco VI, Miller TL. Treatment-related cardiotoxicity in survivors of childhood cancer. Nat Rev Clin Oncol. 2013;10:697–710. doi:10.1038/nrclinonc.2013.195. - DOI - PubMed
    1. Octavia Y, Tocchetti CG, Gabrielson KL, Janssens S, Crijns HJ, Moens AL. Doxorubicin-induced cardiomyopathy: From molecular mechanisms to therapeutic strategies. J Mol Cell Cardiol. 2012;52:1213–1225. doi:10.1016/j.yjmcc.2012.03.006. - DOI - PubMed

Publication types

MeSH terms