. 2022 Aug 19;101(33):e29708.
doi: 10.1097/MD.0000000000029708.

Tissue attenuation imaging and tissue scatter imaging for quantitative ultrasound evaluation of hepatic steatosis

Affiliations

Tissue attenuation imaging and tissue scatter imaging for quantitative ultrasound evaluation of hepatic steatosis

Aladár D Rónaszéki et al. Medicine (Baltimore). .

Abstract

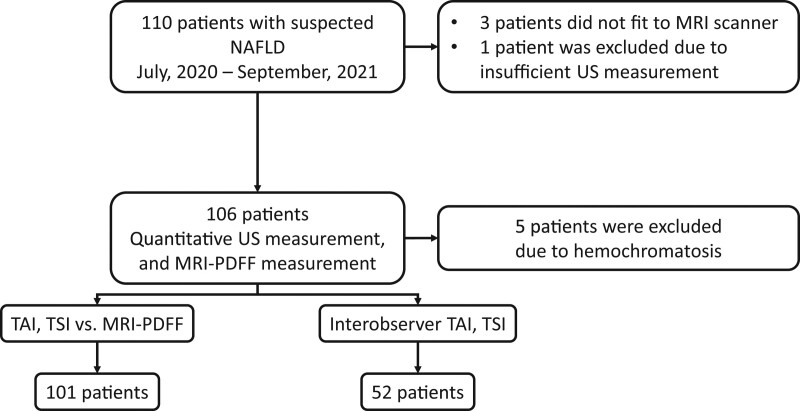
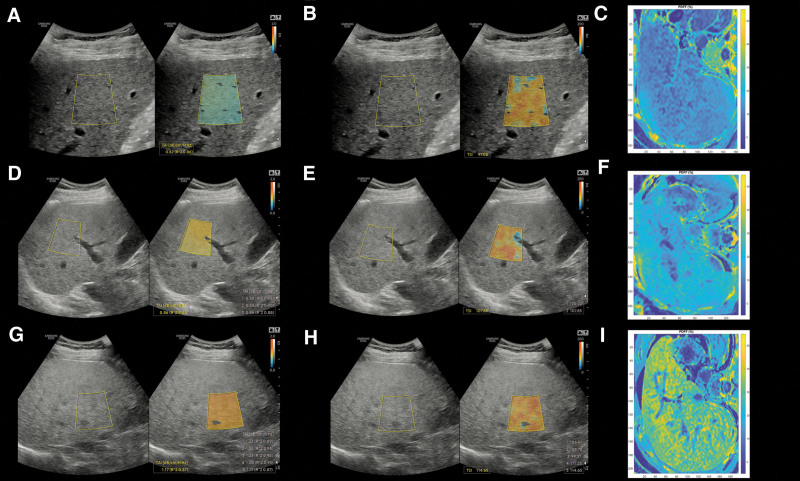
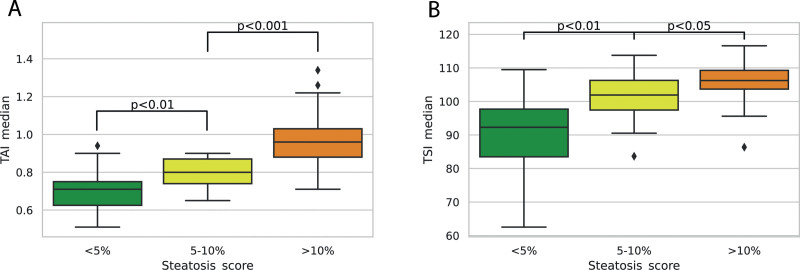
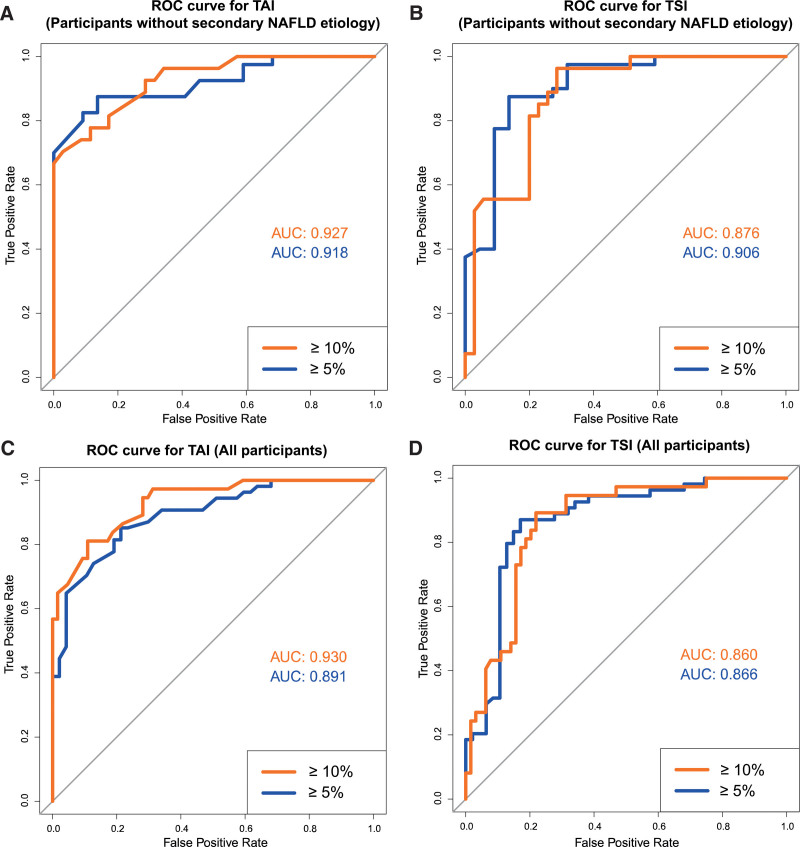
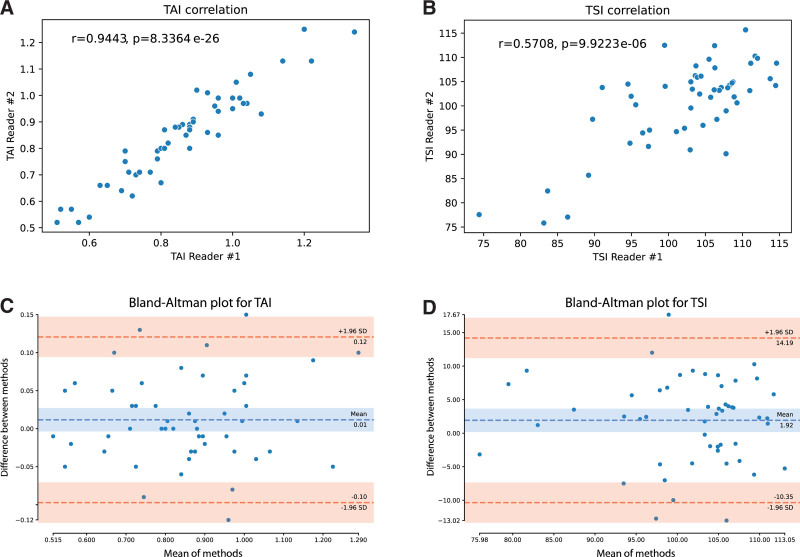
We aimed to assess the feasibility of ultrasound-based tissue attenuation imaging (TAI) and tissue scatter distribution imaging (TSI) for quantification of liver steatosis in patients with nonalcoholic fatty liver disease (NAFLD). We prospectively enrolled 101 participants with suspected NAFLD. The TAI and TSI measurements of the liver were performed with a Samsung RS85 Prestige ultrasound system. Based on the magnetic resonance imaging proton density fat fraction (MRI-PDFF), patients were divided into ≤5%, 5-10%, and ≥10% of MRI-PDFF groups. We determined the correlation between TAI, TSI, and MRI-PDFF and used multiple linear regression analysis to identify any association with clinical variables. The diagnostic performance of TAI, TSI was determined based on the area under the receiver operating characteristic curve (AUC). The intraclass correlation coefficient (ICC) was calculated to assess interobserver reliability. Both TAI (rs = 0.78, P < .001) and TSI (rs = 0.68, P < .001) showed significant correlation with MRI-PDFF. TAI overperformed TSI in the detection of both ≥5% MRI-PDFF (AUC = 0.89 vs 0.87) and ≥10% (AUC = 0.93 vs 0.86). MRI-PDFF proved to be an independent predictor of TAI (β = 1.03; P < .001), while both MRI-PDFF (β = 50.9; P < .001) and liver stiffness (β = -0.86; P < .001) were independent predictors of TSI. Interobserver analysis showed excellent reproducibility of TAI (ICC = 0.95) and moderate reproducibility of TSI (ICC = 0.73). TAI and TSI could be used successfully to diagnose and estimate the severity of hepatic steatosis in routine clinical practice.


Conflict of interest statement

P.N.K. has served as a speaker for Samsung Medison Ltd. All other authors declare no conflict of interest.

Figures

Figure 1.
Figure 1.
Patient selection and study design. We enrolled 110 participants with suspected NAFLD into this prospective study. One hundred six patients with suspected liver steatosis who fulfilled the inclusion criteria underwent both quantitative ultrasound and MRI-PDFF measurements to determine the liver’s fat content. Three morbidly obese patients had been excluded because they did not fit into the MRI scanner, an additional patient was excluded due to failure of the ultrasound measurement, and further 5 patients were excluded due to hemochromatosis, which can interfere with MRI-PDFF. The final patient cohort included 101 NAFLD patients. In 52 cases, 2 examiners independent from each other performed quantitative ultrasound measurements to assess the interobserver reproducibility of TAI and TSI values. MRI-PDFF = magnetic resonance imaging-based proton density fat fraction measurement, NAFLD = nonalcoholic fatty liver disease, TAI = tissue attenuation imaging, TSI = tissue scatter distribution imaging.
Figure 2.
Figure 2.
Quantitative ultrasound measurement of the liver fat. Tissue attenuation imaging (A) and tissue scatter distribution imaging (B) of participants with a liver fat content of <5%. For visual reference, colormaps from magnitude-based estimation of MRI-PDFF values were also reconstructed on axial slices where livers with < 5% MRI-PDFF showed blue color indicating no significant steatosis (C). Patients with 5–10% of MRI-PDFF had higher TAI (D) and TSI (E) values compared to patients with no significant hepatic steatosis, while the MRI-PDFF colormap of the liver turned green (F). Finally, patients with ≥ 10% of MRI-PDFF had the highest TAI (G) and TSI values (G), and they had a yellowish color on the MRI-PDFF colormap (I). MRI-PDFF = magnetic resonance imaging-based proton density fat fraction measurement, TAI = tissue attenuation imaging, TSI = tissue scatter distribution imaging.
Figure 3.
Figure 3.
Comparison of quantitative ultrasound metrics between different amounts of hepatic steatosis. Both TAI and TSI showed significant differences between hepatic steatosis of < 5% vs 5–10% vs ≥10% MRI-PDFF. The TSI values showed a greater overlap between the different categories compared to TAI measurements. MRI-PDFF = magnetic resonance imaging-based proton density fat fraction measurement, TAI = tissue attenuation imaging, TSI = tissue scatter distribution imaging.
Figure 4.
Figure 4.
Receiver operating characteristic curve analysis for quantitative ultrasound metrics. According to the receiver operating characteristic curve analysis of NAFLD cases without secondary etiology TAI had excellent AUCs of 0.927 and 0.918 (A), while TSI had very good and excellent AUCs of 0.876 and 0.906 (B), to detect ≥ 5% and ≥ 10% MRI-PDFF, respectively. The TAI (AUC = 0.930 and 0.891) (C) and TSI (AUC = 0.860 and 0.866) (D) had similarly good classification accuracy for ≥ 5% and ≥ 10% MRI-PDFF in all participants. AUC = area under the receiver operating characteristic curve, MRI-PDFF = magnetic resonance imaging-based proton density fat fraction measurement, NAFLD = nonalcoholic fatty liver disease, ROC = receiver operating characteristic curve, TAI = tissue attenuation imaging, TSI = tissue scatter distribution imaging.
Figure 5.
Figure 5.
Analysis of interobserver agreement with quantitative ultrasound. The TAI and TSI values measured by the 2 examiners both showed a strong correlation with a Spearman rho of 0.94, P < .001 (A) and 0.57, P < 001 (B), respectively. The average interobserver difference (dashed blue line) was 0.01 cm/dB/MHz with TAI (C) and 1.92 with TSI (D). Both TAI and TSI showed good reproducibility according to the Bland-Altman plot, where 94% (49/52) of the interobserver differences fell within the 95% confidence interval with limits (dashed red lines) at 1.96 standard deviations. SD = standard deviation, TAI = tissue attenuation imaging, TSI = tissue scatter distribution imaging.

References

    1. Asrani SK, Devarbhavi H, Eaton J, et al. . Burden of liver diseases in the world. J Hepatol. 2019;70:151–71. - PubMed
    1. Mitra S, De A, Chowdhury A. Epidemiology of non-alcoholic and alcoholic fatty liver diseases. Transl Gastroenterol Hepatol. 2020;5:16–16. - PMC - PubMed
    1. Younossi ZM, Koenig AB, Abdelatif D, et al. . Global epidemiology of nonalcoholic fatty liver disease-meta-analytic assessment of prevalence, incidence, and outcomes. Hepatology. 2016;64:73–84. - PubMed
    1. European Association for the Study of the Liver (EASL); European Association for the Study of Diabetes (EASD); European Association for the Study of Obesity (EASO). EASL-EASD-EASO Clinical Practice Guidelines for the management of non-alcoholic fatty liver disease. J Hepatol. 2016;64:1388–402. - PubMed
    1. Pais R, Barritt AS, Calmus Y, et al. . NAFLD and liver transplantation: current burden and expected challenges. J Hepatol. 2016;65:1245–57. - PMC - PubMed

MeSH terms