. 2023 Jan 15;207(2):160-172.
doi: 10.1164/rccm.202110-2414OC.

Comprehensive Analysis of Fibroblast Activation Protein Expression in Interstitial Lung Diseases

Affiliations

Comprehensive Analysis of Fibroblast Activation Protein Expression in Interstitial Lung Diseases

Penghui Yang et al. Am J Respir Crit Care Med. .

Abstract

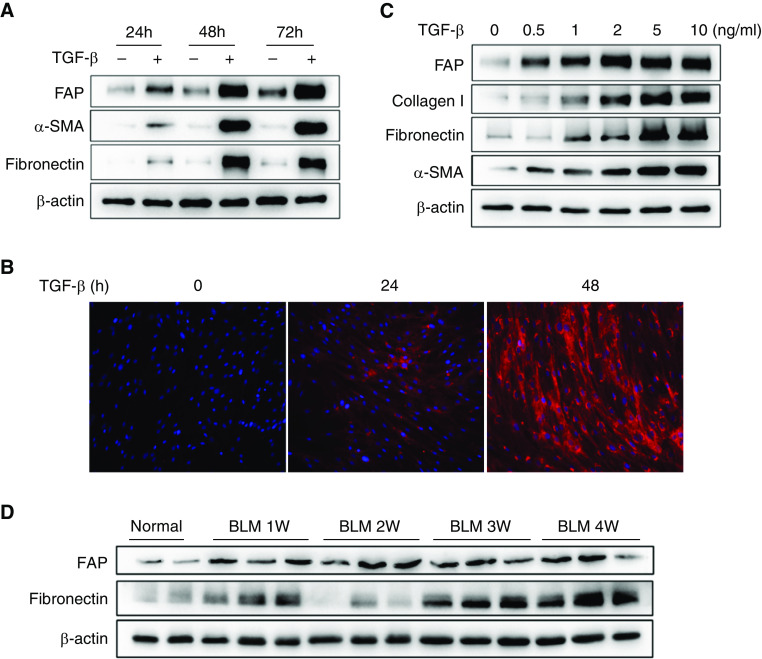
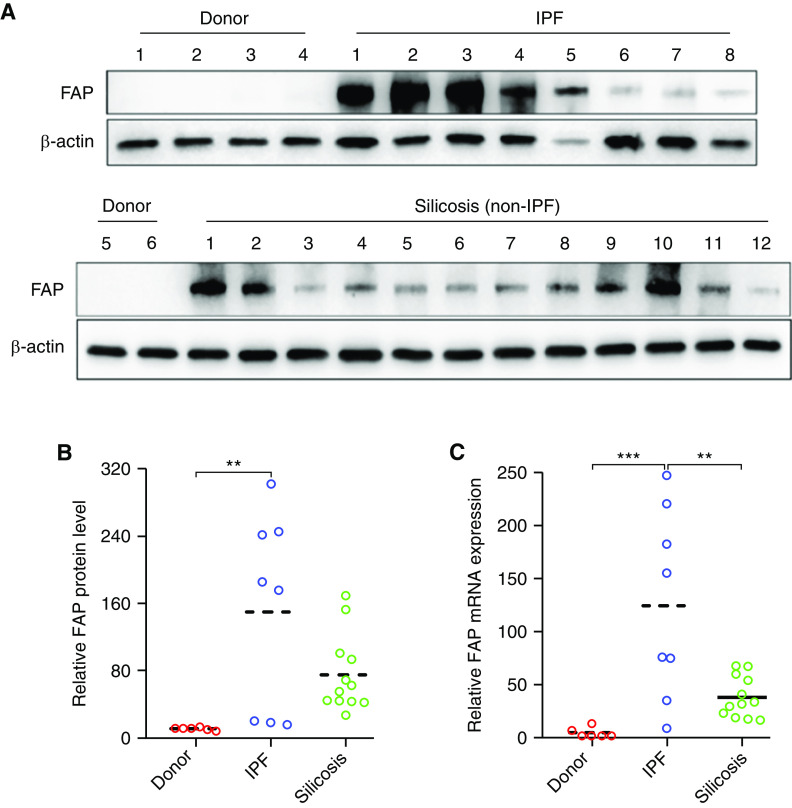
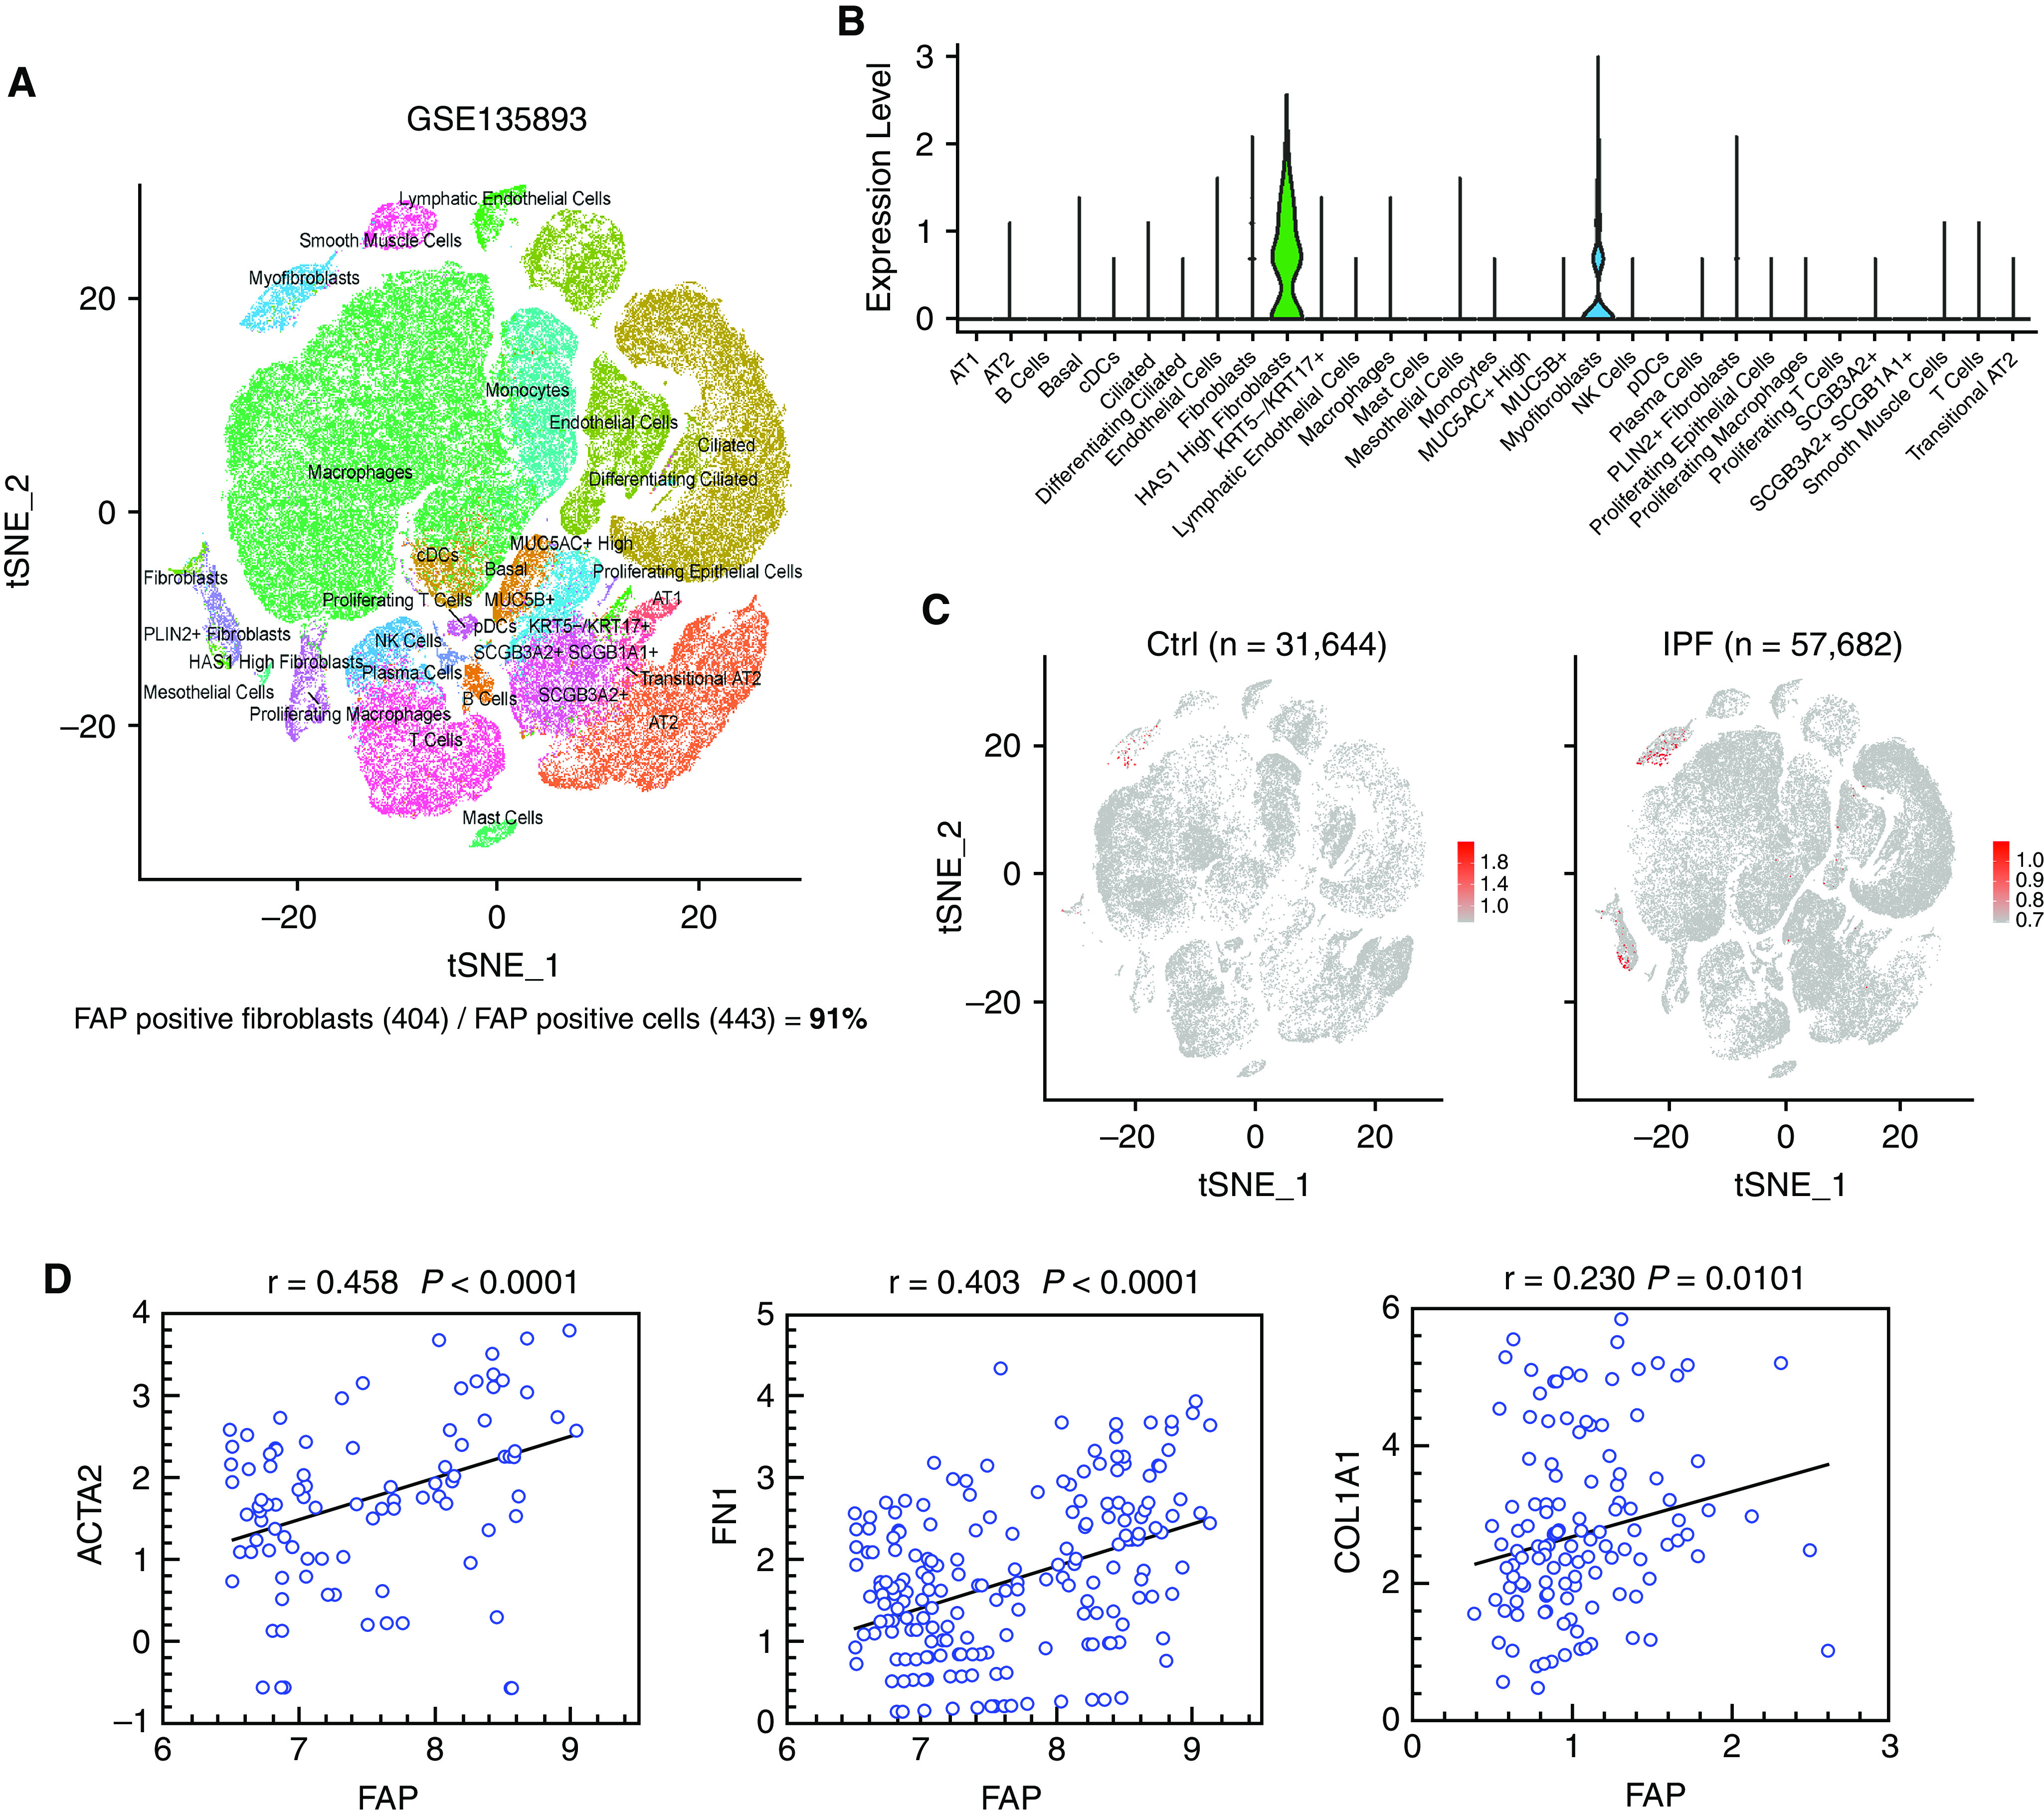
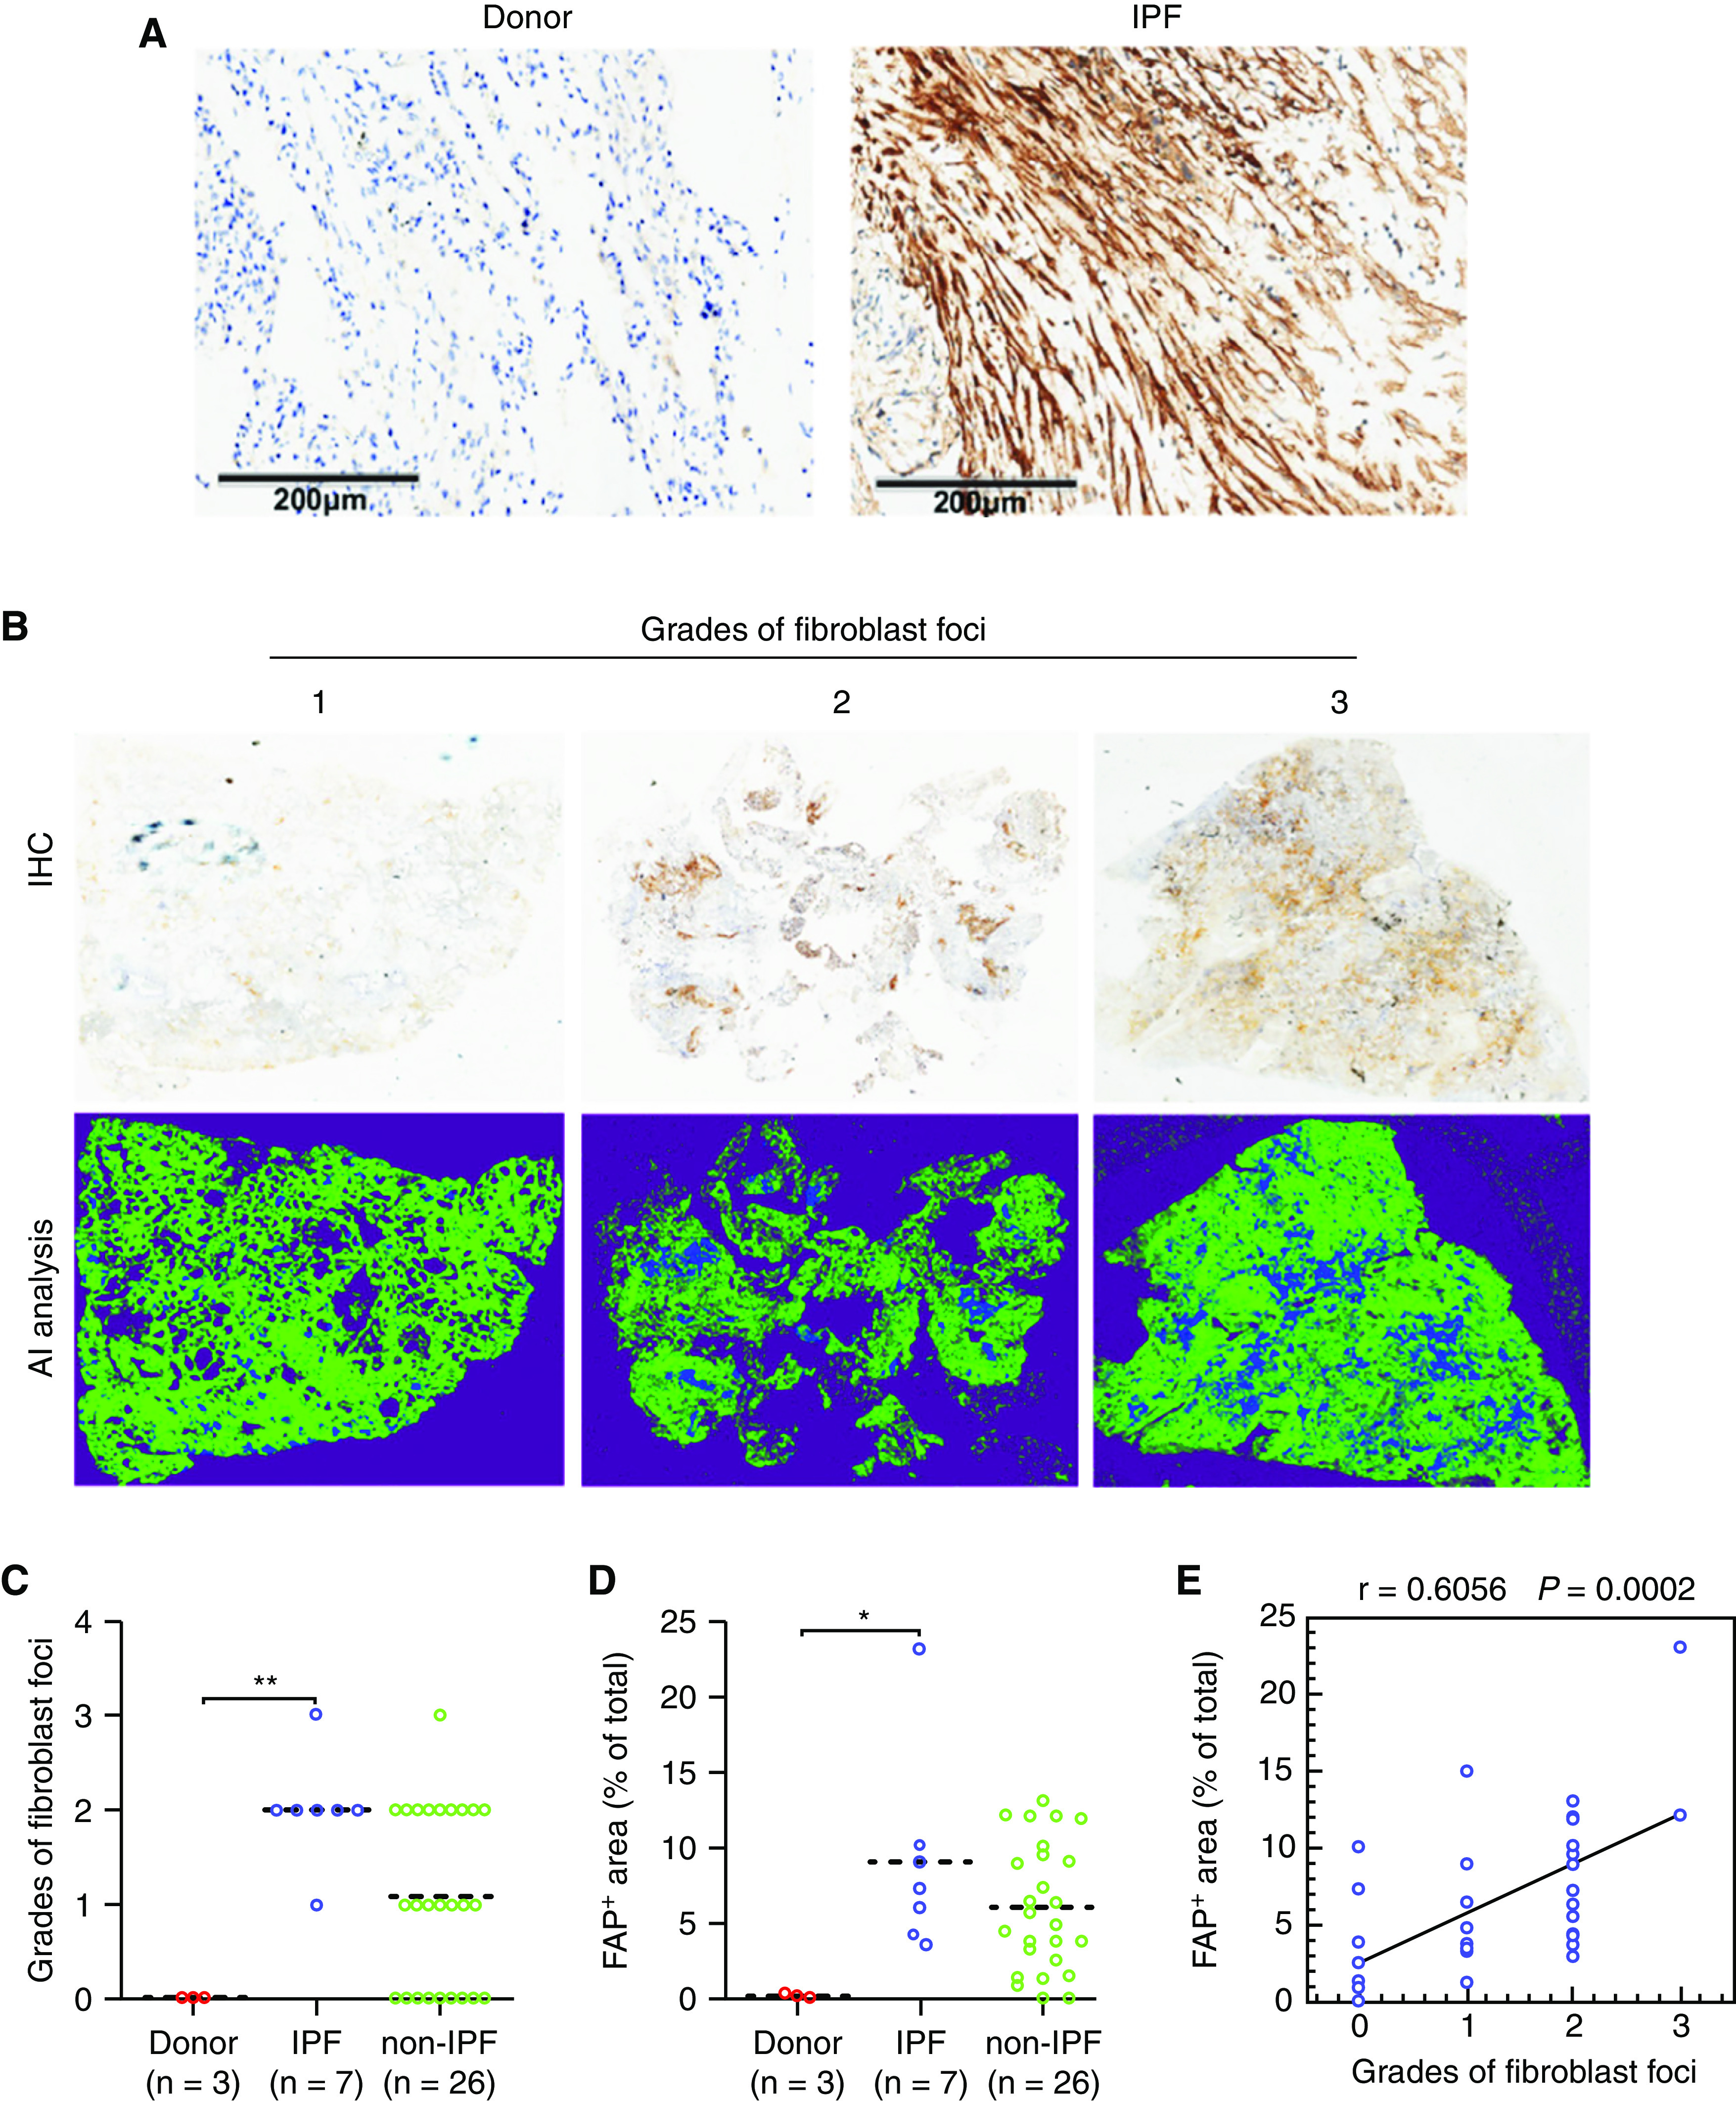
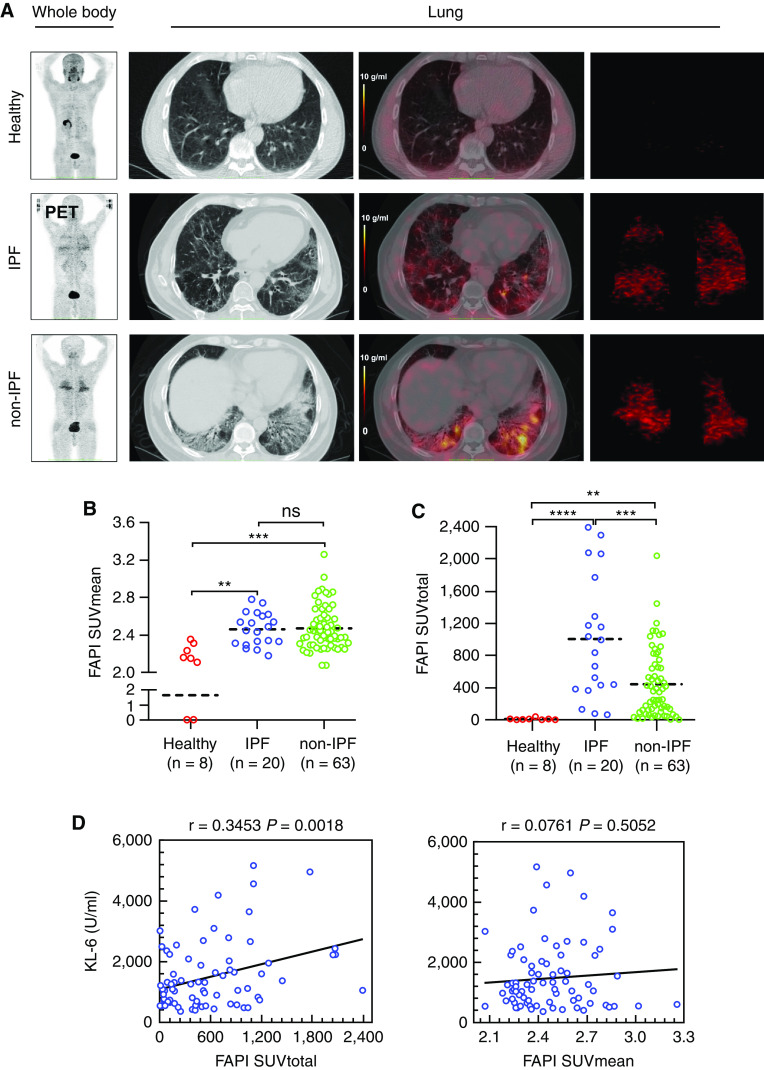
Rationale: Sustained activation of lung fibroblasts and the resulting oversynthesis of the extracellular matrix are detrimental events for patients with interstitial lung diseases (ILDs). Lung biopsy is a primary evaluation technique for the fibrotic status of ILDs, and is also a major risk factor for triggering acute deterioration. Fibroblast activation protein (FAP) is a long-known surface biomarker of activated fibroblasts, but its expression pattern and diagnostic implications in ILDs are poorly defined. Objectives: The present study aims to comprehensively investigate whether the expression intensity of FAP could be used as a potential readout to estimate or measure the amounts of activated fibroblasts in ILD lungs quantitatively. Methods: FAP expression in human primary lung fibroblasts as well as in clinical lung specimens was first tested using multiple experimental methods, including real-time quantitative PCR (qPCR), Western blot, immunofluorescence staining, deep learning measurement of whole slide immunohistochemistry, as well as single-cell sequencing. In addition, FAP-targeted positron emission tomography/computed tomography imaging PET/CT was applied to various types of patients with ILD, and the correlation between the uptake of FAP tracer and pulmonary function parameters was analyzed. Measurements and Main Results: Here, it was revealed, for the first time, FAP expression was upregulated significantly in the early phase of lung fibroblast activation event in response to a low dose of profibrotic cytokine. Single-cell sequencing data further indicate that nearly all FAP-positive cells in ILD lungs were collagen-producing fibroblasts. Immunohistochemical analysis validated that FAP expression level was closely correlated with the abundance of fibroblastic foci on human lung biopsy sections from patients with ILDs. We found that the total standard uptake value (SUV) of FAP inhibitor (FAPI) PET (SUVtotal) was significantly related to lung function decline in patients with ILD. Conclusions: Our results strongly support that in vitro and in vivo detection of FAP can assess the profibrotic activity of ILDs, which may aid in early diagnosis and the selection of an appropriate therapeutic window.

Keywords: fibroblast activation protein; idiopathic pulmonary fibrosis; interstitial lung diseases; positron emission tomography/computed tomography.


Figures

Figure 1.
Figure 1.
Transforming growth factor β (TGF-β) modulation of fibroblast activation protein expression in human primary lung fibroblasts. (A) Human primary lung fibroblasts from healthy donors were treated with TGF-β (10 ng/ml) for the indicated times (24, 48, and 72 h). The corresponding negative control at each time point was set and then subjected to Western blot to analyze the expression of fibroblast activation protein (FAP), fibronectin, and α smooth muscle actin (α-SMA). (B) At the same time, immunofluorescence staining was used to detect the expression of FAP at different time points after being treated with TGF-β (10 ng/ml). The red color represents FAP immunoreactive signals, whereas the blue indicates DAPI staining. (C) Five concentration gradients (0.5, 1, 2, 5, and 10 ng/ml TGF-β) and negative control (0 ng/ml TGF-β) groups were implemented for 48 hours in a TGF-β dose-dependent experiment. Western blot analysis was used to detect the FAP, fibronectin, collagen I, and α-SMA. (D) Expression of FAP in mouse lung tissues at different time points after bleomycin (BLM) model.
Figure 2.
Figure 2.
Expression of protein and mRNA of fibroblast activation protein (FAP) in transplanted lung tissue for patients with and without idiopathic pulmonary fibrosis (IPF). (A and B) The frozen lung tissues from healthy donors (n = 6) and patients with IPF (n = 8) or non-IPF interstitial lung disease (silicosis, n = 12) were used for FAP expression evaluation by Western blot. **P < 0.01. (C) Real-time PCR analysis of FAP mRNA expression. β-actin was used as an internal reference gene to normalize the expression of FAP. The relative expression of FAP in one healthy donor (1#) was designated as sample control and set at one. The expression folds in other individuals were calculated through comparison to control subjects. The dashed line is a median. **P < 0.01 and ***P < 0.001.
Figure 3.
Figure 3.
Single-cell analysis reveals the specific expression of fibroblast activation protein (FAP) in fibroblasts from the public data. (A) Uniform manifold approximation and projection (UMAP) shows the control and idiopathic pulmonary fibrosis (IPF) single-cell populations from study GSE135893. (B) FAP expression level in each cell population using single-cell RNA sequencing data from study GSE135893. (C) UMAP shows the cells that express FAP in healthy donors and patients with IPF from study GSE135893. (D) Expression correlation analysis between FAP and ACTA2, FN1, and COL1A1 (the x-axis and y-axis represent log2 normalized expression level). cDCs = conventional dendritic cells; Ctrl = control; NK = natural killer; tSNE = t-distributed stochastic neighbor embedding.
Figure 4.
Figure 4.
Fibroblast activation protein (FAP) expression in lung biopsies of patients with and without idiopathic pulmonary fibrosis (IPF). The lung biopsy tissue sections of IPF (n = 7) and non-IPF interstitial lung disease (ILD) (n = 26) were subjected to immunohistochemical staining of FAP. (A) Representative higher magnification immunohistochemistry images for FAP expression in donors and patients with IPF. Scale bars, 200 μm. (B) Representative immunohistochemistry images for patients with ILD with different grades of fibroblast foci (+, ++, and +++). The above columns indicate panorama images of original immunohistochemistry for the whole slide images, and the below columns indicate the positive signal extraction (blue) by artificial intelligence analysis. The grades of (C) fibroblast foci and (D) percentages of FAP-positive areas within the WSI for donors, patients with ILD and IPF, and patients with ILD but without IPF. (E) Correlation between the percentages of FAP-positive areas and the grades of fibroblast foci for patients (n = 33), including IPF and non-IPF, r = 0.6056; P = 0.0002, data are shown in correlation plots. The dashed line is a median. *P < 0.05 and **P < 0.01.
Figure 5.
Figure 5.
Fibroblast activation protein (FAP)-targeted positron emission tomography (PET)/computed tomography (CT) imaging of patients with interstitial lung disease (ILD). A total of 78 patients diagnosed as idiopathic pulmonary fibrosis (IPF) (n = 20), non-IPF ILD (n = 63), and healthy volunteers (n = 8) were recruited for a PET imaging study with 68Ga-FAPI-04. (A) The columns from left to right successively showed representative images of whole-body uptake for 68Ga-FAPI-04 with PET, 68Ga-FAPI-04 uptake in lung cross-section with CT, PET/CT, and the 68Ga-FAPI-04 total uptake with PET by three-dimensional (3-D) reconstruction. (B) Mean of standard uptake value (SUVmean) for 68Ga-FAPI-04 in all patients with ILD and healthy volunteers. The dashed line is a median. ****P < 0.0001. (C) Quantitative analysis for total volume uptake of PET tracer targeting FAP (SUVtotal) in different subtypes of patients with ILD and healthy volunteers. The dashed line is a median. **P < 0.01, ***P < 0.001, and ****P < 0.0001. (D) Correlation analysis between the uptake of 68Ga-FAPI-04 (SUVmean and SUVtotal) in ILDs (including patients with and without IPF) with KL-6, linear regression (r), and linear regression lines are plotted. P < 0.05 was considered statistically significant. ns = no significance.
Figure 6.
Figure 6.
Correlation analysis for 68Ga-FAPI-04 uptake and pulmonary function test (PFT). (A) Timeline for positron emission tomography (PET)/computed tomography (CT) and PFT: the first PFT was conducted within no more than 1 month from PET/CT scan. The time interval between the two PFT measurements was approximately 4–20 months. (B) Correlation analysis between standard uptake value (SUV) for 68Ga-FAPI-04 (SUVtotal and SUVmean) and PFT (baseline DlCO and FVC). (C) Correlation analysis between 68Ga-FAPI-04 (SUVtotal and SUVmean) uptake and changes in PFT (change from baseline in DlCO and FVC). Linear regression (r) and linear regression lines are plotted. P < 0.05 was considered statistically significant. FAPI = fibroblast activation protein inhibitors.

Comment in

References

    1. Rockey DC, Bell PD, Hill JA. Fibrosis–0a common pathway to organ injury and failure. N Engl J Med . 2015;372:1138–1149. - PubMed
    1. Jun JI, Lau LF. Resolution of organ fibrosis. J Clin Invest . 2018;128:97–107. - PMC - PubMed
    1. Ryu JH, Moua T, Daniels CE, Hartman TE, Yi ES, Utz JP, et al. Idiopathic pulmonary fibrosis: evolving concepts. Mayo Clin Proc . 2014;89:1130–1142. - PubMed
    1. Richeldi L, Collard HR, Jones MG. Idiopathic pulmonary fibrosis. Lancet . 2017;389:1941–1952. - PubMed
    1. Barratt SL, Creamer A, Hayton C, Chaudhuri N. Idiopathic pulmonary fibrosis (IPF): an overview. J Clin Med . 2018;7:201. - PMC - PubMed

Publication types