. 2022 Aug 19;18(8):e1010394.
doi: 10.1371/journal.pcbi.1010394. eCollection 2022 Aug.

TreeKnit: Inferring ancestral reassortment graphs of influenza viruses

Affiliations

TreeKnit: Inferring ancestral reassortment graphs of influenza viruses

Pierre Barrat-Charlaix et al. PLoS Comput Biol. .

Abstract

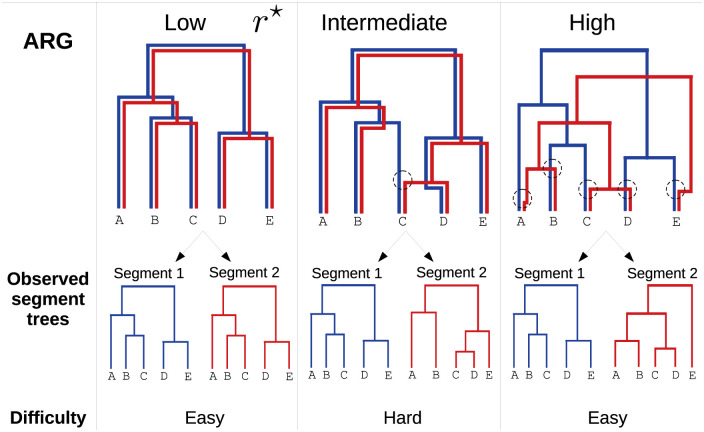
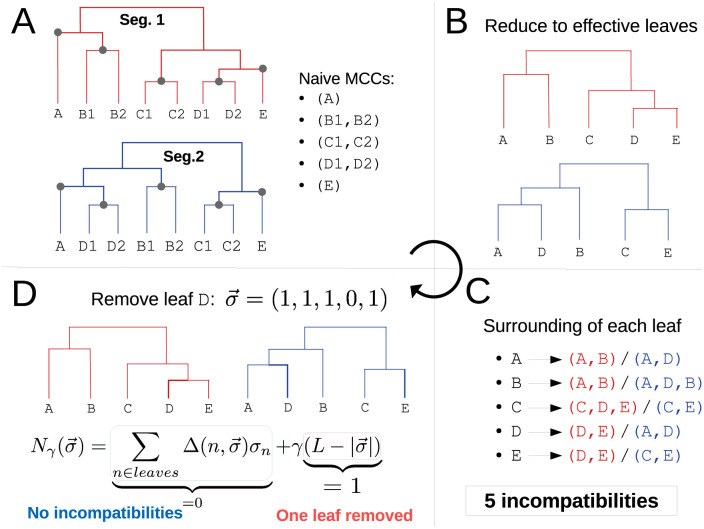
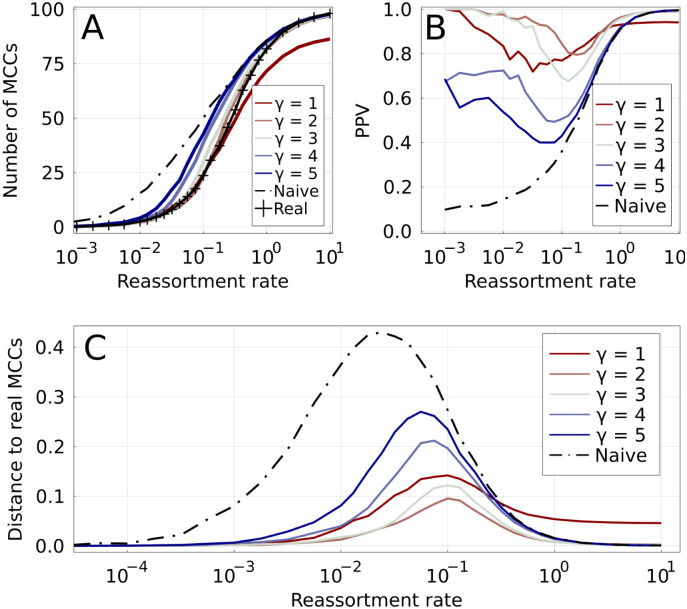
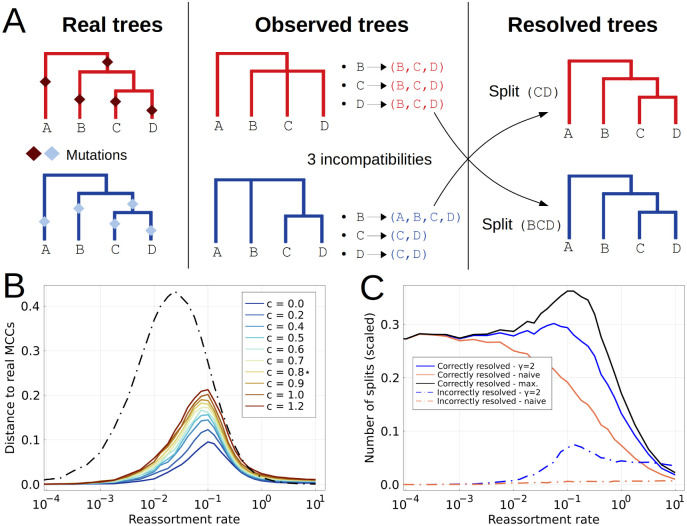
When two influenza viruses co-infect the same cell, they can exchange genome segments in a process known as reassortment. Reassortment is an important source of genetic diversity and is known to have been involved in the emergence of most pandemic influenza strains. However, because of the difficulty in identifying reassortment events from viral sequence data, little is known about their role in the evolution of the seasonal influenza viruses. Here we introduce TreeKnit, a method that infers ancestral reassortment graphs (ARG) from two segment trees. It is based on topological differences between trees, and proceeds in a greedy fashion by finding regions that are compatible in the two trees. Using simulated genealogies with reassortments, we show that TreeKnit performs well in a wide range of settings and that it is as accurate as a more principled bayesian method, while being orders of magnitude faster. Finally, we show that it is possible to use the inferred ARG to better resolve segment trees and to construct more informative visualizations of reassortments.


Conflict of interest statement

The authors have declared that no competing interests exist.

Figures

Fig 1
Fig 1. Example of ARGs for five sampled strains and for two segments (blue and red).
Reassortments are shown as black circles in each ARG. Based on the scaled reassortment rate in the population r, three regimes can be identified. Left: Very low reassortment rate. Reassortments are very rare, and every strain inherits its two segments from the same parent. The ARG is equal to the gene trees, and reconstructing it is easy. Center: Intermediate reassortment rate. Some exchange of segments takes place: some strains do not inherit their segments from the same parent (here, strain C). The segments trees have different topologies, but are still relatively similar. Inferring the position of reassortments from the gene trees is non trivial. Right: Very high reassortment rate. A reassortment takes place on every branch of the ARG before the first coalescence. The two segments have independent evolutionary histories, and the segment trees share no structure. Inference of reassortments becomes easy again.
Fig 2
Fig 2. Schematic of the iterative algorithm.
A: Construction of the naive MCCs. Circles indicate the root of the five clades that match exactly in the two trees (slightly highlighted branches). Trying to grow one of these clades gives inconsistent results in the two trees: e.g. growing the MCC (B1,B2) gives clade (A,B1,B2) in the first tree and (A,D1,D2,B1,B2) in the second. B: Trees obtained after reducing trees of A to their naive MCCs: each clade is represented by a single effective leaf. C: Counting incompatibilities in the reduced trees. For each effective leaf, the clades defined by its direct ancestor in the two trees are compared, and each mismatch counts as one incompatibility. D: Enforcing reassortments on some leaves to remove incompatibilities. A configuration σ is associated to each set of removed leaves. The scoring function Nγ(σ) adds the number of remaining incompatibilities given σ and the number of removed leaves multiplied by γ. The optimal set of reassortments is found by minimizing Nγ(σ), e.g. removing D is optimal if γ < 5.
Fig 3
Fig 3. Accuracy of inferred MCCs in simulated ARGs.
Increasing values of γ are shown by colored lines, from red to blue. A: Number of MCCs found by different methods as a function of the reassortment rate. The real number of MCCs is represented by the marked black line. The naive method (dashed black line) overestimates the number of MCCs for low r, while the parsimonious one (γ = 1) underestimates it for high r. B: Positive predictive value for reassortments: fraction of inferred reassortments that are indeed present in the real ARG. The low number of reassortments results in a relatively large uncertainty for this quantity for r ≪ 1. C: Distance between inferred and real MCCs for different methods. The distance is based on the variation of information [20].
Fig 4
Fig 4. Effect of poorly resolved trees on the inference of MCCs.
A: Pre-resolving trees before inferring MCCs. The approach is greedy: every split of one tree that is compatible with the other is introduced in the other. B: VI distance to real MCCs as a function of r for different tree resolutions c, using γ = 2. The dashed line corresponds to the naive method γ → ∞. The quality of the inference decreases with c. c ≃ 0.8 corresponds to levels found in A/H3N2 influenza trees with strains from the same season. C: Quality of the resolution of trees after having inferred MCCs. This combines splits introduced by the pre-resolution step, and splits known once the MCCs are inferred. The number of correctly inferred splits is shown, scaled by the number of splits that would be necessary to make the trees binary. The black line indicates the performance if the MCCs were exactly known.
Fig 5
Fig 5. Comparison of TreeKnit with CoalRe [9, 17] and GiRaF [14, 21] on simulated ARGs of 100 leaves.
For three reassortment rates, shows the Left: number of true reassortments, Center: number of false reassortments, and Right: number of missed reassortments, for all three methods. Large markers represent the average over 5 simulations for each r. Smaller markers show results on individual ARGs. Results for each method are slightly shifted on the r-axis for visibility.

Similar articles

Cited by

References

    1. Simon-Loriere E, Holmes EC. Why do RNA viruses recombine? Nature Reviews Microbiology. 2011;9(8):617–626. doi: 10.1038/nrmicro2614 - DOI - PMC - PubMed
    1. Smith GJD, Bahl J, Vijaykrishna D, Zhang J, Poon LLM, Chen H, et al.. Dating the emergence of pandemic influenza viruses. Proceedings of the National Academy of Sciences. 2009;106(28):11709–11712. doi: 10.1073/pnas.0904991106 - DOI - PMC - PubMed
    1. Guan Y, Vijaykrishna D, Bahl J, Zhu H, Wang J, Smith GJD. The emergence of pandemic influenza viruses. Protein & Cell. 2010;1(1):9–13. doi: 10.1007/s13238-010-0008-z - DOI - PMC - PubMed
    1. Price MN, Dehal PS, Arkin AP. FastTree: Computing Large Minimum Evolution Trees with Profiles instead of a Distance Matrix. Molecular Biology and Evolution. 2009;26(7):1641–1650. doi: 10.1093/molbev/msp077 - DOI - PMC - PubMed
    1. Minh BQ, Schmidt HA, Chernomor O, Schrempf D, Woodhams MD, von Haeseler A, et al.. IQ-TREE 2: New Models and Efficient Methods for Phylogenetic Inference in the Genomic Era. Molecular Biology and Evolution. 2020. doi: 10.1093/molbev/msaa131 - DOI - PMC - PubMed

Publication types