. 2022 Aug 19;18(8):e1010413.
doi: 10.1371/journal.pcbi.1010413. eCollection 2022 Aug.

Mitochondrial mRNA localization is governed by translation kinetics and spatial transport

Affiliations

Mitochondrial mRNA localization is governed by translation kinetics and spatial transport

Ximena G Arceo et al. PLoS Comput Biol. .

Abstract

For many nuclear-encoded mitochondrial genes, mRNA localizes to the mitochondrial surface co-translationally, aided by the association of a mitochondrial targeting sequence (MTS) on the nascent peptide with the mitochondrial import complex. For a subset of these co-translationally localized mRNAs, their localization is dependent on the metabolic state of the cell, while others are constitutively localized. To explore the differences between these two mRNA types we developed a stochastic, quantitative model for MTS-mediated mRNA localization to mitochondria in yeast cells. This model includes translation, applying gene-specific kinetics derived from experimental data; and diffusion in the cytosol. Even though both mRNA types are co-translationally localized we found that the steady state number, or density, of ribosomes along an mRNA was insufficient to differentiate the two mRNA types. Instead, conditionally-localized mRNAs have faster translation kinetics which modulate localization in combination with changes to diffusive search kinetics across metabolic states. Our model also suggests that the MTS requires a maturation time to become competent to bind mitochondria. Our work indicates that yeast cells can regulate mRNA localization to mitochondria by controlling mitochondrial volume fraction (influencing diffusive search times) and gene translation kinetics (adjusting mRNA binding competence) without the need for mRNA-specific binding proteins. These results shed light on both global and gene-specific mechanisms that enable cells to alter mRNA localization in response to changing metabolic conditions.


Conflict of interest statement

The authors have declared that no competing interests exist.

Figures

Fig 1
Fig 1. Quantitative models show equilibrium and kinetic contributions to mitochondrial mRNA localization.
(A) Simplified discrete-state model of mRNA mitochondrial localization. mRNA can be either binding competent (‘sticky’) or not binding competent (‘not sticky’), and either within binding range of mitochondria (‘close’) or not within binding range (‘far’). mRNA transition between these states with rates described in the text. (B) Localized fraction [defined as ‘close’ in (A)] as the spatial fraction of the cell near mitochondria (Eq 2) is varied. Rapid transport curves indicate rapid switching from close to far relative to switching between sticky and not sticky, while for slow transport the relative switching speeds are reversed. (C) Stochastic model of mRNA translation. Ribosomes initiate translation at rate kinit and progress to the next codon at rate kelong. MTS is translated after the first 100 amino acids. Once MTS is translated, MTS becomes binding-competent at rate kMTS. (D) Schematic of mRNA diffusion in spatial model, shown in cross-section. The cytoplasmic space is treated as a cylinder centered on a mitochondrial cylinder (red): the three dimensional volume extends along the cylinder axis. mRNA in region 1 are sufficiently close for binding-competent mRNA to bind to the mitochondria, mRNA in region 2 are considered mitochondrially localized in diffraction-limited imaging data, and region 3 represents the remainder of the cell volume. mRNA not bound to mitochondria will freely diffuse between these regions. (E) For the stochastic translation model shown in (C), the fraction of mRNA lifetime that an mRNA is binding-competent vs. β = kinit(LLMTS)/kelong, the mean number of translated MTSs per mRNA. For each data point, mRNA translation parameters kinit, L, and kelong were randomly selected from the ranges kinit ∈ [10−3 s−1, 0.5 s−1], L ∈ [150 aa, 600 aa], and kelong ∈ [1 s−1, 10 s−1]. (F) Mitochondrial localization from the stochastic model illustrated in C and D, as kinit is varied. L = 400 aa, 4% mitochondrial volume fraction, and kelong as indicated in legend. (G) is the same data as F, but plotted against β.
Fig 2
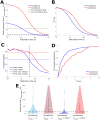
Fig 2. Instantaneous model is insufficient to explain differential mitochondrial localization of different gene groups.
(A) Cumulative distributions of conditional and constitutive mRNA genes vs number of binding-competent ribosomes β (lines indicate fraction of genes with given β or less). β for each mRNA gene is calculated from gene-specific kinit and kelong that are estimated from experimental data (see Methods). Inset is cumulative distribution of ribosome occupancy [38], showing ribosome occupancy and β have similar distributions. (B) Violin plot [41] showing mRNA localization fraction of individual genes with instantaneous model (no maturation delay), with translation kinetics for each gene estimated from experimental data (see Methods). 4% MVF. For direct comparison to experimental data, mRNA in region 1 (see Fig 1D) recorded as mitochondrially localized. (C) Mitochondrial localization vs mitochondrial volume fraction for TIM50 and ATP3 with instantaneous model (solid lines), with translation kinetics for both genes estimated from experimental data (see Methods). For direct comparison to experimental data (dotted lines with circles), mRNA in regions 1 and 2 (see Fig 1D) recorded as mitochondrially localized. (D) Cumulative distributions of MTS exposure time texpo = (LlMTS)/kelong. The steeper rise of conditional genes indicates more conditional gene mRNAs have low exposure times. Translation kinetics for each gene estimated from experimental data (see Methods). Inset shows the cumulative distribution of elongation rate, for which constitutive genes have a steeper rise, indicating slower typical elongation, which contributes to the longer exposure times in the main plot.
Fig 3
Fig 3. MTS binding-competence maturation time underlies distinct mitochondrial localization behavior of conditional and constitutive genes.
(A) Mean exposure time of a binding-competent MTS before completing translation (Eq 7) vs binding-competence maturation time. Data for median conditional (L = 393 aa, kinit = 0.3253 s−1, kelong = 14.5086 s−1) and constitutive genes (L = 483 aa, kinit = 0.1259 s−1, kelong = 7.7468 s−1) is shown. Horizontal dashed lines are the mean diffusive search times (Eq 8) to reach binding range of mitochondria (region 1 in Fig 1D). (B) βmature (mean number of mature binding-competent MTS signals, Eq 6) vs maturation time for median conditional and constitutive genes. (C) Mitochondrial localization (to region 1) vs maturation time for median conditional and constitutive genes with 4% MVF. Horizontal dotted lines indicate experimental localization medians. 40 second maturation time (vertical dashed line) allows model to match experimental localization for both conditional and constitutive genes. (D) Cumulative distribution of βmature (mean mature MTS signals per mRNA) for conditional and constitutive genes. Steeper rise of conditional genes indicates more conditional genes have low β than constitutive genes; compare to Fig 2A, which lacked MTS maturation time. (E) Violin plot showing model exposure times with 40-second MTS maturation and the instantaneous model without MTS maturation (kMTS → ∞). 4% MVF. Median conditional exposure time with maturation is below the diffusive search time to find the binding region (horizontal dashed line, Eq 8 for 4% MVF) while the other three medians are above this search time. For (C)—(E), the translation kinetics for each gene are estimated from experimental data (see Methods).
Fig 4
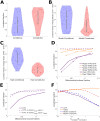
Fig 4. MTS maturation time distinguishes mRNA localization of conditional and constitutive genes.
(A) Violin plots of mitochondrial localization of conditional and constitutive genes for model with 40-second maturation time; compare to Fig 2B, which lacked MTS maturation time. p-value = 0.5% for two-sample Kolmogorov-Smirnov test for a difference between conditional and constitutive localization distributions. (B,C) Violin plots of localization increase upon cycloheximide application for model with 40-second MTS maturation time (B) and from experiment (C). (D) Mitochondrial localization for ATP3 and TIM50 vs MVF for model with 40-second MTS maturation time. Solid lines are CHX-, which closely corresponds to experimental data [23] shown with dotted lines with circles. Dashed lines are CHX + model predictions, exhibiting large increase upon CHX application for ATP3 and limited increase for TIM50. (E) Comparing model mitochondrial localization results for ATP3 to similar hypothetical construct gene with decreased elongation rate and initial rate selected to maintain either MTS number β or mature MTS number βmature. (F) Comparing model mitochondrial localization results for median conditional and constitutive genes, ATP3, and TIM50 as both elongation and initiation rates (ktranslate) are varied. ktranslate,0 is the elongation or initiation rate for each of ATP3, TIM50, and median conditional and constitutive genes. For all panels, the translation kinetics for each gene are estimated from experimental data (see Methods). For (F), see Fig 3 for median conditional and constitutive translation kinetics. (A), (B), and (F) use 4% MVF.

Similar articles

Cited by

References

    1. Bauer NC, Doetsch PW, Corbett AH. Mechanisms regulating protein localization. Traffic. 2015;16(10):1039–1061. doi: 10.1111/tra.12310 - DOI - PubMed
    1. Aviram N, Schuldiner M. Targeting and translocation of proteins to the endoplasmic reticulum at a glance. Journal of cell science. 2017;130(24):4079–4085. doi: 10.1242/jcs.204396 - DOI - PubMed
    1. Chio US, Cho H, Shan So. Mechanisms of tail-anchored membrane protein targeting and insertion. Annual review of cell and developmental biology. 2017;33:417–438. doi: 10.1146/annurev-cellbio-100616-060839 - DOI - PMC - PubMed
    1. Guardia CM, De Pace R, Mattera R, Bonifacino JS. Neuronal functions of adaptor complexes involved in protein sorting. Current opinion in neurobiology. 2018;51:103–110. doi: 10.1016/j.conb.2018.02.021 - DOI - PMC - PubMed
    1. Wheeler RJ, Hyman AA. Controlling compartmentalization by non-membrane-bound organelles. Philosophical Transactions of the Royal Society B: Biological Sciences. 2018;373(1747):20170193. doi: 10.1098/rstb.2017.0193 - DOI - PMC - PubMed

Publication types

MeSH terms

Substances