. 2022 Aug 19;8(33):eabp8412.
doi: 10.1126/sciadv.abp8412. Epub 2022 Aug 19.

COP1 dynamics integrate conflicting seasonal light and thermal cues in the control of Arabidopsis elongation

Affiliations

COP1 dynamics integrate conflicting seasonal light and thermal cues in the control of Arabidopsis elongation

Cristina Nieto et al. Sci Adv. .

Abstract

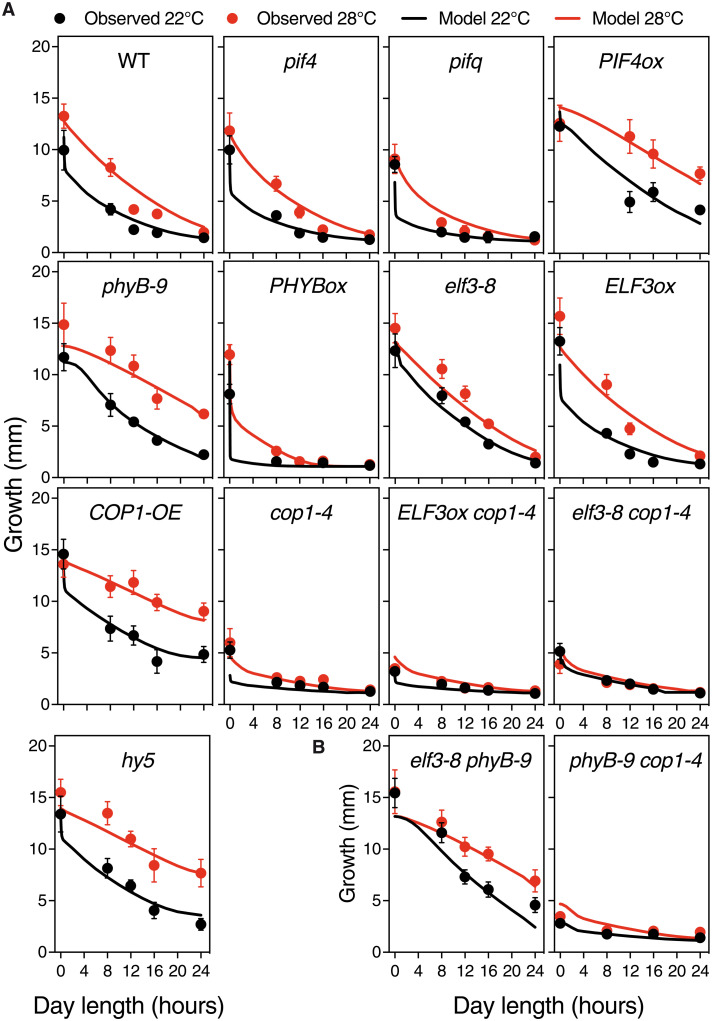
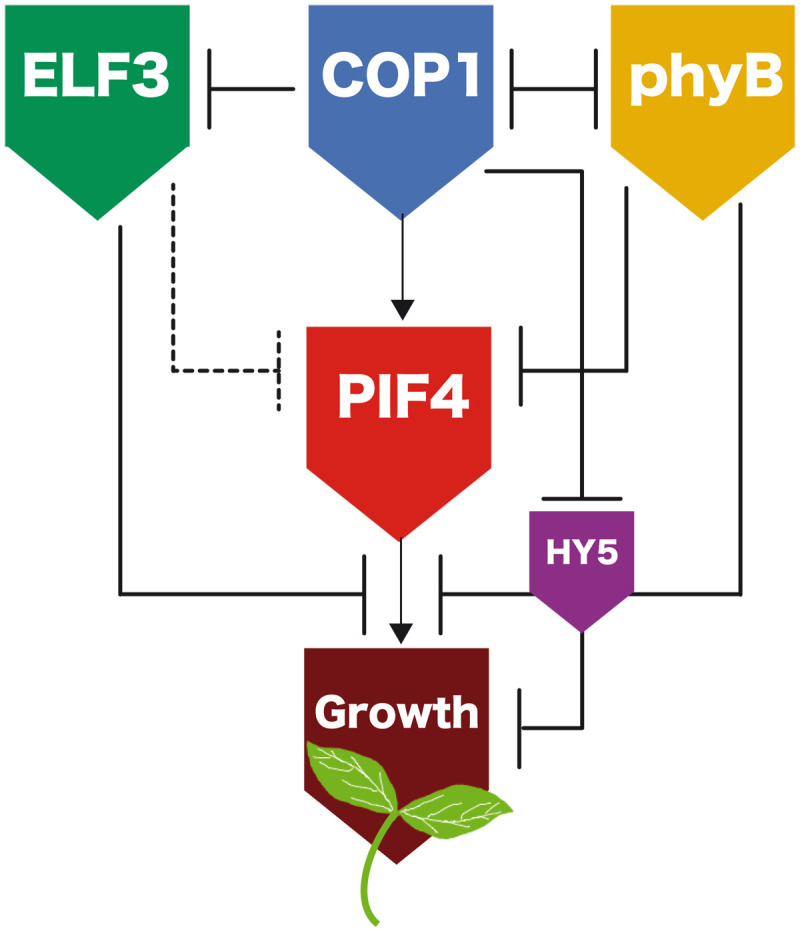
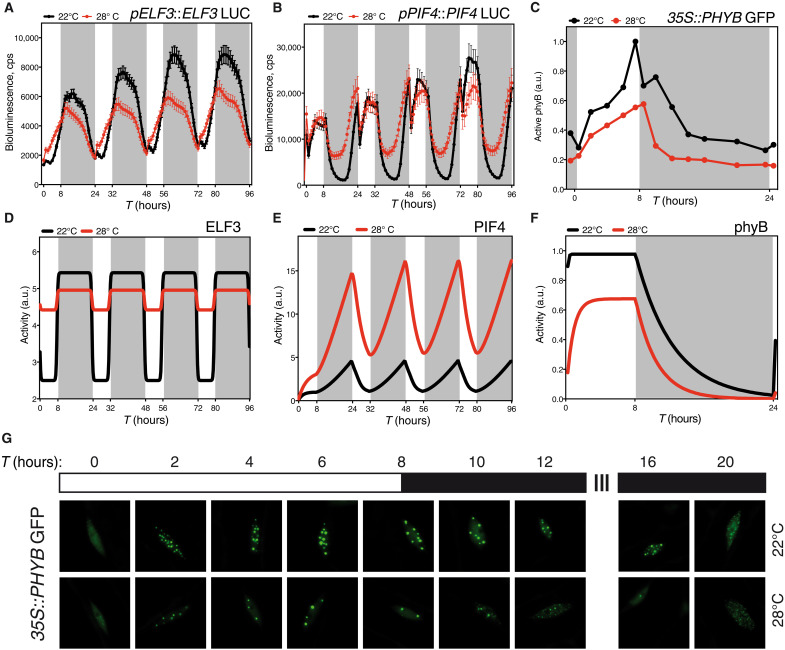
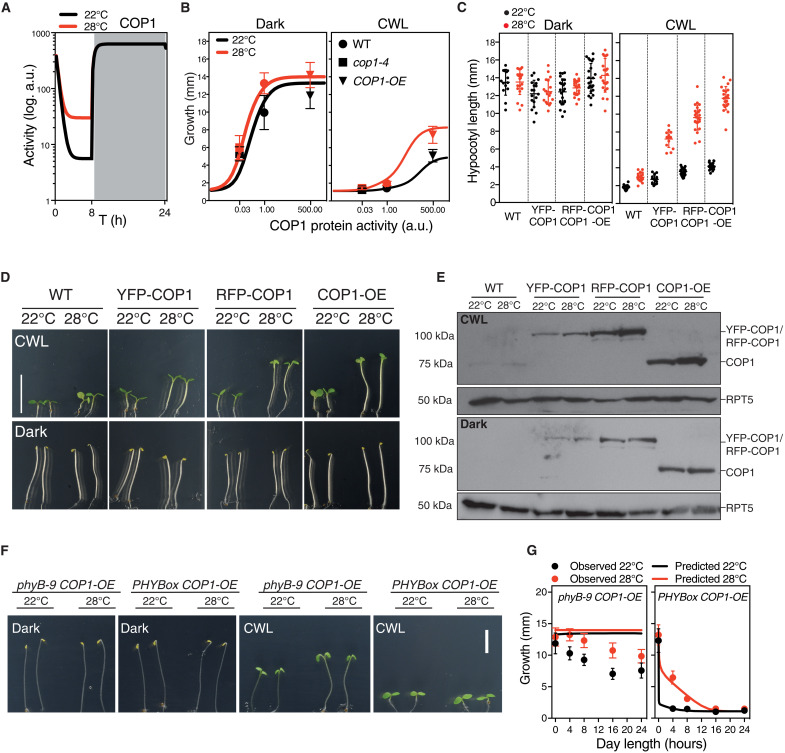
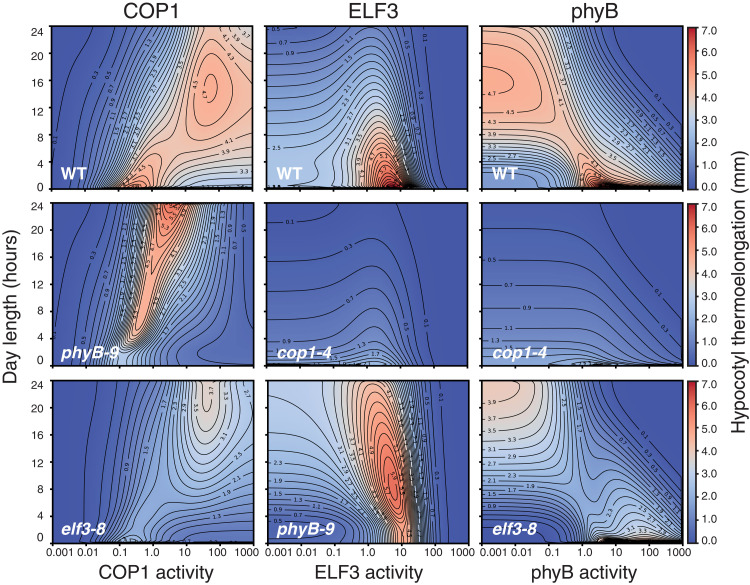
As the summer approaches, plants experience enhanced light inputs and warm temperatures, two environmental cues with an opposite morphogenic impact. Key components of this response are PHYTOCHROME B (phyB), EARLY FLOWERING 3 (ELF3), and CONSTITUTIVE PHOTOMORPHOGENIC 1 (COP1). Here, we used single and double mutant/overexpression lines to fit a mathematical model incorporating known interactions of these regulators. The fitted model recapitulates thermal growth of all lines used and correctly predicts thermal behavior of others not used in the fit. While thermal COP1 function is accepted to be independent of diurnal timing, our model shows that it acts at temperature signaling only during daytime. Defective response of cop1-4 mutants is epistatic to phyB-9 and elf3-8, indicating that COP1 activity is essential to transduce phyB and ELF3 thermosensory function. Our thermal model provides a unique toolbox to identify best allelic combinations enhancing climate change resilience of crops adapted to different latitudes.


Figures

Fig. 1.
Fig. 1.. The model captures the growth data used for training and correctly predicts thermal growth of genotypes not used in the fitting process.
(A) Hypocotyl lengths of the various Arabidopsis backgrounds grown at either 22° or 28°C and darkness, short days (8-hour light), 12-hour light, long days (16-hour light), and CWL. These data were used to train the mathematical model. Seeds were subjected to a 4-hour pulse of light to synchronize germination, and half of the plates were transferred to 28°C following seed germination. Seedlings were grown for 5 days, and plates were photographed for hypocotyl length measurement with ImageJ. Circles represent mean ± SD; the number of seedlings is indicated in table S2. Solid lines show the growth predicted by the trained model. The model accurately captures the main trends of data. WT, wild type. (B) Thermal growth behavior predicted for elf3-8 phyB-9 and phyB-9-cop1-4 mutants, not used to train the model. These two genotypes thus serve as a first validation step of the developed model. Symbols as in (A); the number of repetitions for each point is indicated in table S2. Shorter hypocotyls denoting later seed germination were not measured. In (A), values for PHYBox 12-hour 22°C and ELF3ox 16-hour 28°C were skipped because of poor germination.
Fig. 2.
Fig. 2.. ELF3, COP1, phyB, PIF4, and HY5 form a highly connected network that controls hypocotyl growth.
Schematic representation of the known interactions of these regulators and the model network. PIF4 activates the expression of cell wall loosening and auxin biosynthesis/responsive genes to initiate hypocotyl growth. ELF3, COP1, phyB, and HY5 regulate PIF4 transcription, PIF4 protein stability, and binding of this factor to its cognate promoter elements. Dashed and solid lines respectively indicate transcriptional and posttranscriptional control as included in the model.
Fig. 3.
Fig. 3.. The model accurately predicts growth in a 4-hour light regime.
Measured hypocotyl length (circles) for six genotypes were compared with values predicted by the model (solid lines), as indicated. Note that lines are, in this case, model predictions, not fits to the data, and hence provide a further validation of the model. Bars indicate SD of n = 19 to 50 seedlings (table S3).
Fig. 4.
Fig. 4.. The model predicts key features of the dynamics of ELF3, PIF4, and phyB.
Microplate bioluminescence detection of Col-0 lines expressing the pELF3::ELF3-LUC (A) and pPIF4::PIF4-LUC (B) constructs. Seedlings were grown in short-day cycles at the indicated temperatures. Values represent mean ± SEM of the 2-s absolute bioluminescence of at least 24 seedlings. Plates were measured every hour. (D) ELF3 and (E) PIF4 activity as predicted by the model. (C and G) Temperature effects on phyB nuclear bodies in seedlings grown in short-day conditions. Transgenic 35S::phyB-GFP seedlings were grown for 5 days in short-day cycles, at either 22° or 28°C. Mean size of phyB nuclear bodies and total nuclear fluorescence measured with the MATLAB software on confocal images taken every 2 hours (C) and diagram of the analyzed time points and growth conditions (G). Arbitrary units (a.u.) of phyB activity were calculated multiplying the nuclear bodies’ mean size by nuclear fluorescence at each time point. Three seedlings were measured in each assay, and two biological replicates were analyzed. All seedlings were grown under 50 μmol m−2 s−1 white light in short-day cycles at 22° or 28°C. Warmer temperature results in fewer photobodies and less nuclear intensity. (F) phyB activity predicted by the model. Rectangles indicate light conditions: white, lights on; gray, lights off. T indicates the time in hours.
Fig. 5.
Fig. 5.. Light enhances temperature dependency of COP1 activity.
(A) Levels of COP1 activity predicted by the mathematical model in short-day conditions. (B) Hypocotyl length as affected by the interaction of environmental conditions and COP1 levels. Hypocotyl lengths of Col-0, cop1-4, and COP1-OE (symbols) compared to the growth values estimated by the model (solid lines), in dark (left) and CWL (right). Bars indicate SD. (C) Thermal growth phenotype of different COP1 overexpressors, forming a gradient of accumulating protein levels. Bars indicate SD of n = 14 to 24 seedlings (table S4). (D) Representative pictures of 5-day-old seedlings grown in CWL (top) and continuous darkness (bottom), at 22° or 28°C. Scale bars, 10 mm. (E) Western blot showing that increased accumulation of the COP1 protein correlates with enhanced thermal elongation in CWL, but this response is saturated in darkness. COP1 was detected using an anti-COP1 antibody. RPT5 was used for loading control and detected using an anti-RPT5 antibody. Total protein extracts were used for immunoblot analysis. (F) Phenotypes of phyB-9 COP1-OE and PHYBox COP1-OE seedlings grown for 5 days in either darkness or CWL at 22° or 28°C. (G) Observed hypocotyl growth (circles) of phyB-9 COP1-OE and PHYBox COP1-OE lines grown for 5 days in different day length conditions, and 22° or 28°C. Solid lines are predictions from the model. Bars indicate SD of n = 13 to 112 seedlings (table S5).
Fig. 6.
Fig. 6.. Contribution of COP1, ELF3, and phyB to day length–dependent thermoelongation as predicted by the model.
Heatmap plots representing hypocotyl thermal elongation (calculated as the difference of hypocotyl length between 28° and 22°C) relative to day length (y axis) and activity of the COP1, phyB, and ELF3 proteins (x axis, as indicated). A value of 1.0 corresponds to wild-type level, while greater and lesser values are equivalent to overexpression and loss of function, respectively. Backgrounds are indicated in the panels.

Similar articles

Cited by

References

    1. Burgie E. S., Vierstra R. D., Phytochromes: An atomic perspective on photoactivation and signaling. Plant Cell 26, 4568–4583 (2014). - PMC - PubMed
    1. Casal J. J., Photoreceptor signaling networks in plant responses to shade. Annu. Rev. Plant Biol. 64, 403–427 (2013). - PubMed
    1. Gommers C. M. M., Visser E. J. W., Onge K. R. S., Voesenek L. A. C. J., Pierik R., Shade tolerance: When growing tall is not an option. Trends Plant Sci. 18, 65–71 (2013). - PubMed
    1. Jung J.-H., Domijan M., Klose C., Biswas S., Ezer D., Gao M., Khattak A. K., Box M. S., Charoensawan V., Cortijo S., Kumar M., Grant A., Locke J. C. W., Schäfer E., Jaeger K. E., Wigge P. A., Phytochromes function as thermosensors in Arabidopsis. Science 354, 886–889 (2016). - PubMed
    1. Legris M., Klose C., Burgie E. S., Rojas C. C. R., Neme M., Hiltbrunner A., Wigge P. A., Schäfer E., Vierstra R. D., Casal J. J., Phytochrome B integrates light and temperature signals in Arabidopsis. Science 354, 897–900 (2016). - PubMed