. 2022 Aug 19;8(33):eabn9134.
doi: 10.1126/sciadv.abn9134. Epub 2022 Aug 19.

Natural locus coeruleus dynamics during feeding

Affiliations

Natural locus coeruleus dynamics during feeding

Natale R Sciolino et al. Sci Adv. .

Abstract

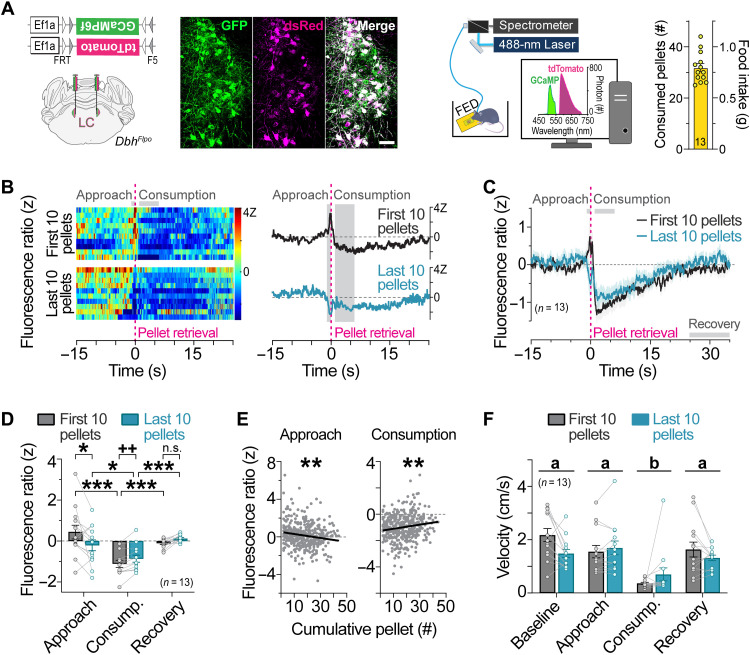
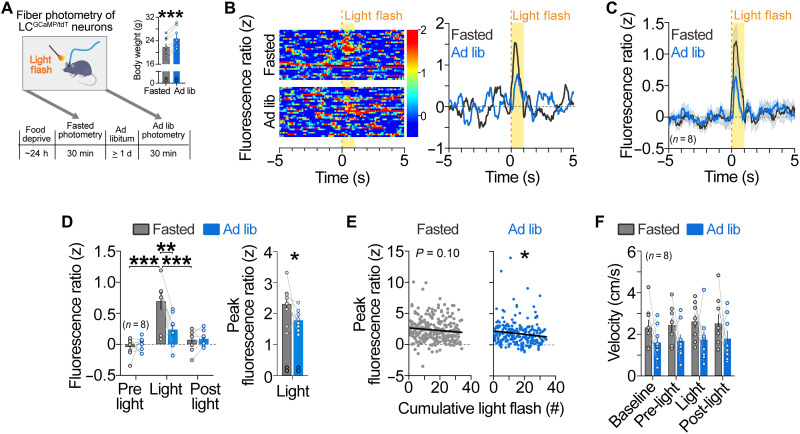
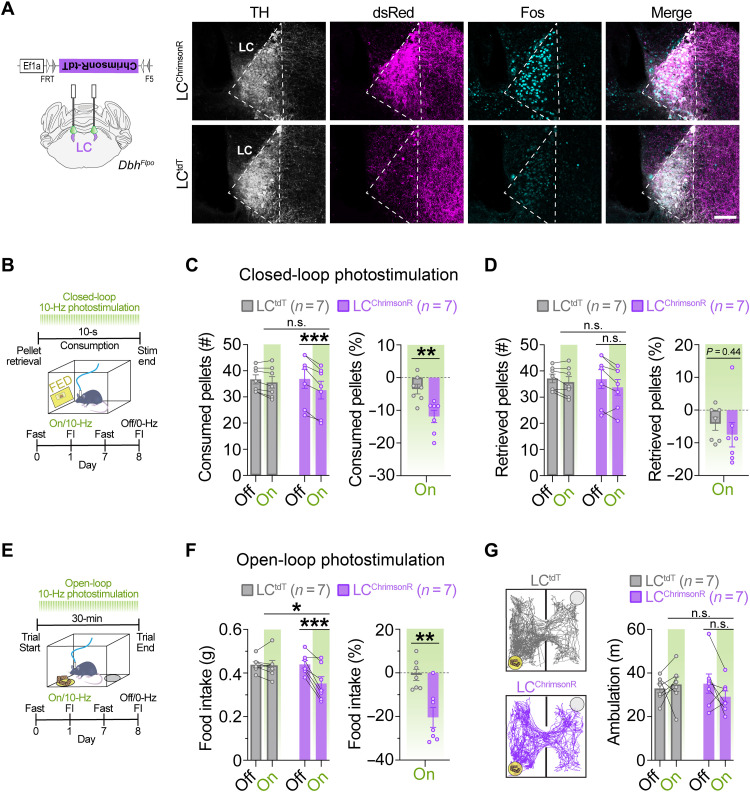
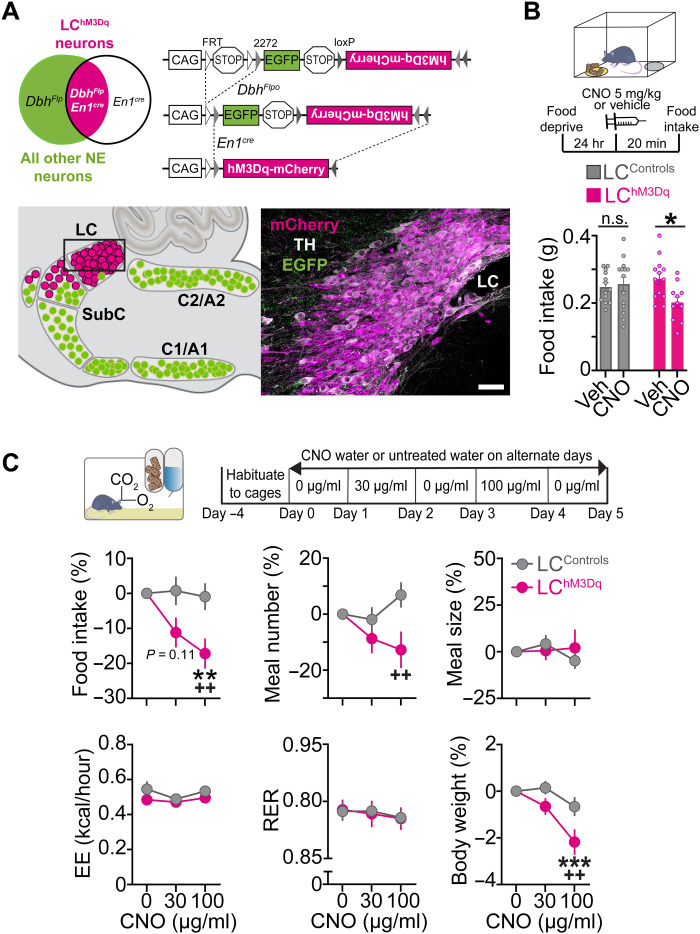
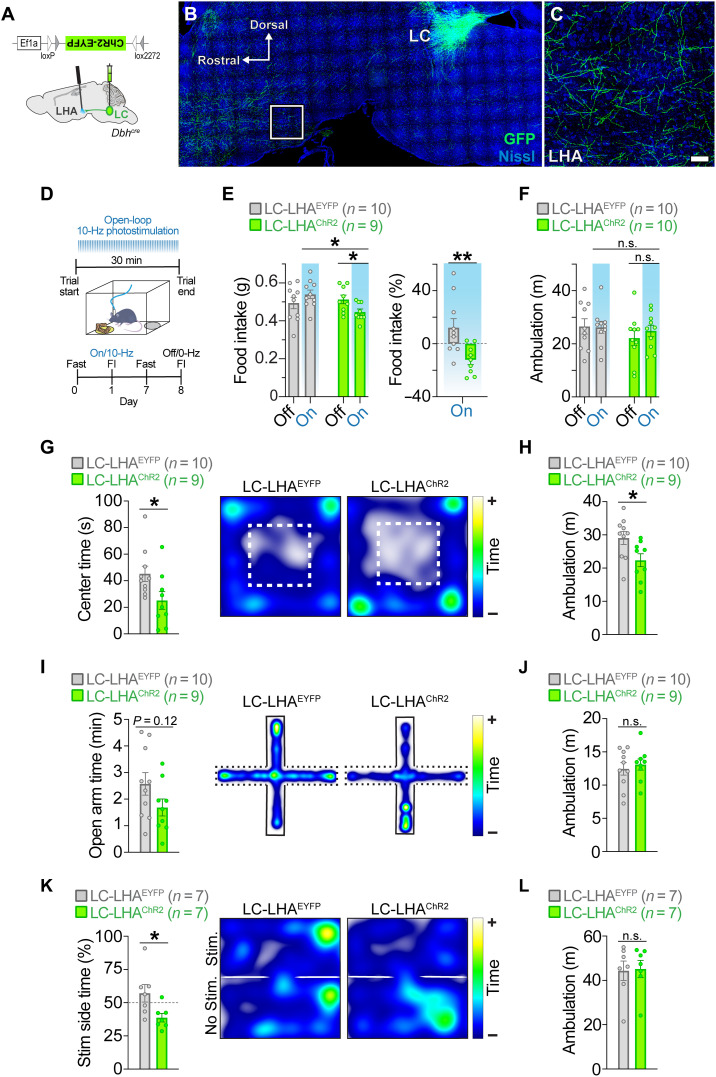
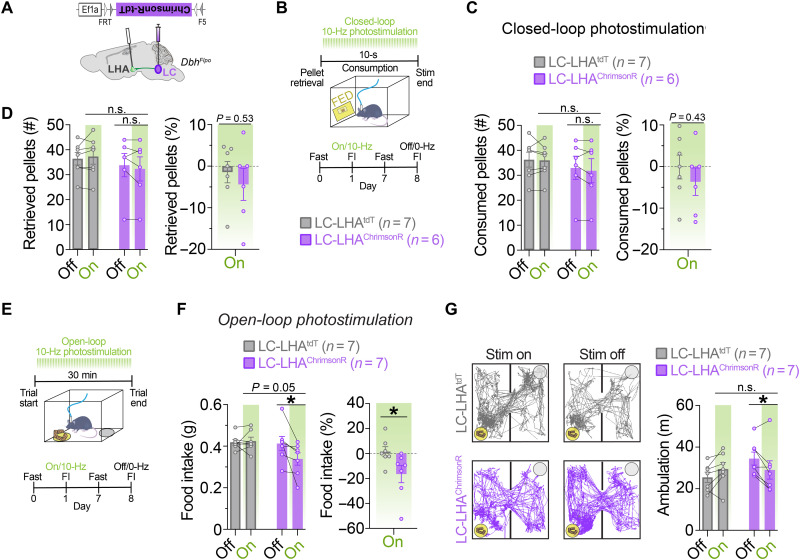
Recent data demonstrate that noradrenergic neurons of the locus coeruleus (LC-NE) are required for fear-induced suppression of feeding, but the role of endogenous LC-NE activity in natural, homeostatic feeding remains unclear. Here, we found that LC-NE activity was suppressed during food consumption, and the magnitude of this neural response was attenuated as mice consumed more pellets throughout the session, suggesting that LC responses to food are modulated by satiety state. Visual-evoked LC-NE activity was also attenuated in sated mice, suggesting that satiety state modulates LC-NE encoding of multiple behavioral states. We also found that food intake could be attenuated by brief or longer durations of LC-NE activation. Last, we found that activation of the LC to the lateral hypothalamus pathway suppresses feeding and enhances avoidance and anxiety-like responding. Our findings suggest that LC-NE neurons modulate feeding by integrating both external cues (e.g., anxiogenic environmental cues) and internal drives (e.g., satiety).


Figures

Fig. 1.
Fig. 1.. LC-NE activity is increased during food approach and suppressed during feeding in a manner influenced by satiety.
(A) Left: Flp-dependent viral genetic strategy for coexpression of GCaMP6f and tdTomato (tdT) in LC-NE neurons. Middle: Coronal view of the locus coeruleus from an LCGCaMP/tdT mouse immunostained for GCaMP6f (GFP antibody) and tdT (dsRed antibody). Scale bar, 50 μm. Right: Schematic of in vivo fiber photometry setup and feeding experimentation device (FED). Average food intake across the 1-hour session. Data are means ± SEM. n = 13 LCGCaMP/tdT mice. (B) Fluorescence ratio expressed as a z score aligned to pellet retrieval during the first 10 pellets (top) and last 10 pellets (bottom) of the session from a representative fasted LCGCaMP/tdT mouse. Single trials are represented in the heatmap (left), and average z-score fluorescence ratio is represented in the trace (right). (C) Average z-score fluorescence ratio aligned to pellet retrieval in fasted LCGCaMP/tdT mice during the first 10 pellets and last 10 pellets of the session. Data are means ± SEM. n = 13 LCGCaMP/tdT mice. (D) Average z-score fluorescence ratio during feeding-related behaviors. Two-way repeated-measures ANOVA, satiety × behavior interaction: F2,24 = 8.819, P = 0.0013. Bonferroni post hoc test, ***P < 0.001 and *P < 0.05. n.s., nonsignificant. Paired sample t test: t12 = 3.807, ++P < 0.01. Data are means ± SEM. n = 13 LCGCaMP/tdT mice. (E) Linear regression of the average z-score fluorescence ratio during food approach and consumption in relation to pellet events across the sessions of fasted LCGCaMP/tdT mice. Approach (slope = −0.02126 ± 0.006555; R2 = 0.02569; F1,399 = 10.52, **P < 0.01) and consumption (slope = 0.01562 ± 0.004806; R2 = 0.02579; F1,399 = 10.56, **P < 0.01). (F) Average velocity during feeding-related behaviors. Two-way repeated-measures ANOVA, main effect of behavior: F3,36 = 26.9, P < 0.001, satiety × behavior interaction: F3,36 = 4.457, P = 0.0092. Bonferroni post hoc test, P < 0.001 consumption (group b) versus all other behavioral states (group a). Data are means ± SEM. n = 13 LCGCaMP/tdT mice.
Fig. 2.
Fig. 2.. Visual-evoked LC-NE activity is influenced by satiety.
(A) Left: Timeline of photometry recordings during presentation of light flashes. Right: Body weights during fasted and ad libitum–fed recordings. Paired samples t test, ***P < 0.001. Data are means ± SEM. n = 8 LCGCaMP/tdT mice. (B) Fluorescence ratio expressed as a z score aligned to visual stimulus during the fasted (top) and ad libitum–fed (bottom) recordings from a representative LCGCaMP/tdT mouse. Single trials are represented in the heatmap (left), and average z-score fluorescence ratio is represented in the trace (right). (C) Average z-score fluorescence ratio aligned to visual stimulus. (D) Left: Average z-score fluorescence ratio during visual-related events in LCGCaMP/tdT mice. Two-way repeated-measures ANOVA, satiety × event interaction: F2,14 = 8.681, P = 0.0035. Bonferroni post hoc test, ***P < 0.001 and **P < 0.01. Right: Average peak z-score fluorescence ratio during visual events. Paired sample t test (one-tailed): t7 = 1.942, P = 0.0466. Data are means ± SEM. n = 8 LCGCaMP/tdT mice. (E) Linear regression of the average peak z-score fluorescence ratio during light flashes across the fasted and ad libitum–fed sessions of LCGCaMP/tdT mice. Fasted (slope = −0.02061 ± 0.01245; R2 = 0.01055, F1,257 = 2.740, P = 0.0991) and ad libitum–fed (slope = −0.02777 ± 0.01238; R2 = 0.01949; F1,253 = 5.028, P = 0.0258). (F) Average velocity during visual-related events. Two-way repeated-measures ANOVA, main effect of satiety: F1,7 = 1.728, P = 0.2301; main effect of event: F3,21 = 2.235, P = 0.1140; satiety × event interaction: F3,21 = 0.1346, P = 0.9383. Data are means ± SEM. n = 8 LCGCaMP/tdT mice.
Fig. 3.
Fig. 3.. Optogenetic stimulation of LC-NE cell bodies suppresses feeding.
(A) Left: Schematic of coronal mouse brain showing location of Flp-dependent AAV to drive ChrimsonR-tdT expression. Right: Immunofluorescent labeling of Fos (turquoise) in noradrenergic (TH, light gray), tdT-expressing (dsRed, magenta) locus coeruleus neurons in coronal brain sections from a representative LCtdT and LCChrimsonR mouse following photostimulation (560 nm, 10 Hz, 10 ms) for 30 min. Scale bar, 100 μm. (B) Timeline of closed-loop optogenetic experiment wherein photostimulation (10 Hz) was triggered upon pellet retrieval and occurred briefly for 10 s during consumption from the FED. (C and D) Left: Average feeding behavior of fasted mice during closed-loop optogenetic experiment. Two-way repeated-measures ANOVA, stimulation × virus interaction: number of pellets consumed (C; F1,12 = 13.70, P = 0.0030) and pellets retrieved (D; F1,12 = 1.571, P = 0.2339). Bonferroni post hoc test, ***P < 0.001 and **P < 0.01. Data are means ± SEM. n = 7 LCtdT mice, n = 7 LCChrimsonR mice. Right: Feeding behavior during closed-loop photostimulation <<(On) as percent change from no stimulation (Off) in fasted mice. Unpaired sample t test: percent change in pellets consumed (C; t12 = 3.504, **P < 0.01) and pellets retrieved (D; t12 = 0.7904, P = 0.4446). (E) Timeline of food intake (FI) during open-loop photostimulation (10 Hz, 10-ms pulses). (F) Left: Average 30-min food intake during the presence (On) or absence (Off) of open-loop photostimulation in fasted mice. Two-way repeated-measures ANOVA, stimulation × virus interaction: F1,12 = 14.42, P = 0.0025. Bonferroni post hoc test, ***P < 0.001, **P < 0.01, and *P < 0.05. Right: Food intake during photostimulation as percent change from no photostimulation. Unpaired sample t test, t12 = 3.716, **P < 0.01. (G) Ambulation in FI task during open-loop photostimulation. Left: Representative traces show ambulation, yellow circle indicates food cup location, and gray circle indicates empty cup location. Right: Average ambulation in FI task in fasted mice. Two-way repeated-measures ANOVA, stimulation × virus interaction: F1,12 = 2.149, P = 0.1684. Data are means ± SEM. n = 7 LCtdT mice and n = 7 LCChrimsonR mice.
Fig. 4.
Fig. 4.. Chemogenetic activation of LC-NE neurons suppresses feeding without altering metabolism.
(A) Left: Schematic illustration of intersectional genetic strategy. Recombination of RC::FL-hM3Dq allele by DbhFlpo and En1cre results in hM3Dq-mCherry expression in LC-NE neurons. Recombination by DbhFlpo alone leads to EGFP expression. Right: Schematic of sagittal mouse hindbrain compressed across the mediolateral axis. Parasagittal section from LChM3Dq brain reveals hM3Dq-mCherry expression in LC-NE neurons. Scale bar, 50 μm. (B) Top: Timeline of FI experiments in fasted mice. Bottom: Average FI in fasted mice. Two-way between-subject ANOVA, drug × genotype interaction: F1,47 = 5.20, P = 0.0272. Bonferroni post hoc test, *P < 0.05. Data are means ± SEM. n = 13 vehicle-treated and n = 14 CNO-treated LCControls. n = 13 vehicle-treated LChM3Dq mice, n = 11 CNO-treated LChM3Dq mice. (C) Top: Timeline of CNO water at 30 and 100 μg/ml. Bottom: Behavioral and metabolic measures in the automated homecage. Two-way repeated-measures ANOVA, drug × genotype interaction: food intake (F2,54 = 3.64, P = 0.0329), meal number (F2,54 = 3.478, P = 0.0379), meal size (F2,54 = 0.8542, P = 0.4313), energy expenditure (EE; F2,54 = 0.4781, P = 0.6226), respiratory exchange rate (RER; F2,54 = 0.04714, P = 0.9540), and body weight (F2,70 = 3.647, P = 0.0312). Bonferroni post hoc test, ***P < 0.001 and **P < 0.01 versus vehicle; ++P < 0.01 versus LCControls. Data are means ± SEM. n = 20 LCControls and n = 9 LChM3Dq mice for all measures except body weight wherein n = 17 LChM3Dq mice.
Fig. 5.
Fig. 5.. Optogenetic stimulation of the LC-LHA noradrenergic pathway suppresses feeding, elicits aversion, and enhances anxiety-like behavior.
(A) Schematic illustration of sagittal mouse brain shows location of cre-dependent AAV used to drive ChR2-EYFP expression and location of fiber-optic probes. (B and C) Parasagittal brain section from a Dbhcre; LC-LHAEYFP mouse shows restricted EYFP expression in LC-NE neurons. High-magnification image shows EYFP-expressing LC-NE axonal projections in the LHA. Scale bars, 400 μm (brain) and 150 μm (LHA). (D) Timeline of FI during open-loop photostimulation (465 nm, 10 Hz, 10-ms pulses). (E and F) Average feeding-related behaviors measured in the presence (On) or absence (Off) of open-loop photostimulation in fasted mice. Two-way repeated-measures ANOVA, stimulation × virus interaction: food intake (E, left; F1,17 = 10.8, P = 0.0044) and ambulation (F; F1,18 = 0.655, P = 0.4290). Bonferroni post hoc test, *P < 0.05. Data are means ± SEM. n = 10 LC-LHAEYFP mice, n = 9 to 10 LC-LHAChR2 mice. Unpaired sample t test: food intake during photostimulation as a percent change from no photostimulation (E, right; t17 = 3.055, **P < 0.01). Data are means ± SEM. n = 10 LC-LHAEYFP mice and n = 9 LC-LHAChR2 mice. (G and H) OFT behaviors. Unpaired sample t test: center time (G; t17 = 2.279, *P < 0.05) and ambulation (H; t17 = 2.411, *P < 0.05). Data are means ± SEM. n = 10 LC-LHAEYFP mice and n = 9 LC-LHAChR2 mice. (I and J) EPM behaviors. Unpaired sample t test: open arm time (I; t17 = 1.638, P = 0.1199) and ambulation (J; t17 = 0.5101, P = 0.6165). Data are means ± SEM. n = 10 LC-LHAEYFP mice and n = 9 LC-LHAChR2 mice. (K and L) RTPT behaviors. Unpaired sample t test: stimulation side time (K; t12 = 2.498, *P < 0.05) and ambulation (L; t12 = 0.1369, P = 0.8934). Data are means ± SEM. n = 7 LC-LHAEYFP mice and n = 7 LC-LHAChR2 mice. (G, I, and K) Representative spatial location heatmaps show time spent exploring the arenas.
Fig. 6.
Fig. 6.. Optogenetic stimulation of the LC-LHA noradrenergic pathway suppresses feeding when stimulation is pulsed during the entire behavioral assay, but not when restricted to feeding events.
(A) Schematic illustration of coronal mouse brain shows location of Flp-dependent AAV used to drive ChrimsonR-tdT expression and location of fiber-optic probes. (B) Timeline of closed-loop optogenetic experiment wherein photostimulation (560 nm, 10 Hz, 10-ms pulses) was triggered upon pellet retrieval and occurred briefly for 10 s during consumption from the FED. (C and D) Left: Average feeding behavior of fasted mice during the closed-loop optogenetic experiment. Two-way repeated-measures ANOVA, stimulation × virus interaction: number of pellets consumed (C; F1,11 = 0.2807, P = 0.6068) and pellets retrieved (D; F1,11 = 1.857, P = 0.2003). Data are means ± SEM. n = 7 LC-LHAtdT mice and n = 6 LC-LHAChrimsonR mice. Right: Feeding behavior of fasted mice during closed-loop optogenetic experiment as percent change of photostimulation (On) from no stimulation (Off). Unpaired sample t test: percent change in pellets consumed (C; t11 = 0.8160, P = 0.4318) and pellets retrieved (D; t11 = 0.6549, P = 0.5260). (E) Timeline of FI during open-loop photostimulation (10 Hz, 10-ms pulses). (F) Left: Average 30-min food intake of fasted mice in the presence (On) or absence (Off) of open-loop photostimulation. Two-way repeated-measures ANOVA, stimulation × virus interaction: F1,12 = 5.116, P = 0.0431. Bonferroni post hoc test, *P < 0.05. Data are means ± SEM. n = 7 LC-LHAtdT mice and n = 7 LC-LHAChrimsonR mice. Right: Food intake during photostimulation (On) as a percent change from no photostimulation (Off). Unpaired sample t test, t12 = 2.269, *P < 0.05. (G) Ambulation in FI task during open-loop photostimulation. Left: Representative traces show ambulation, yellow circle indicates food cup location, and gray circle indicates location of an empty cup. Right: Average 30-min ambulation of fasted mice in FI assay during open-loop photostimulation. Two-way repeated-measures ANOVA, stimulation × virus interaction: F1,12 = 10.33, P = 0.0074. Bonferroni post hoc test, *P < 0.05.

References

    1. Sara S. J., Bouret S., Orienting and reorienting: The locus coeruleus mediates cognition through arousal. Neuron 76, 130–141 (2012). - PubMed
    1. Aston-Jones G., Waterhouse B., Locus coeruleus: From global projection system to adaptive regulation of behavior. Brain Res. 1645, 75–78 (2016). - PMC - PubMed
    1. Poe G. R., Foote S., Eschenko O., Johansen J. P., Bouret S., Aston-Jones G., Harley C. W., Manahan-Vaughan D., Weinshenker D., Valentino R., Berridge C., Chandler D. J., Waterhouse B., Sara S. J., Locus coeruleus: A new look at the blue spot. Nat. Rev. Neurosci. 21, 644–659 (2020). - PMC - PubMed
    1. Foote S. L., Aston-Jones G., Bloom F. E., Impulse activity of locus coeruleus neurons in awake rats and monkeys is a function of sensory stimulation and arousal. Proc. Natl. Acad. Sci. U.S.A. 77, 3033–3037 (1980). - PMC - PubMed
    1. Aston-Jones G., Bloom F. E., Norepinephrine-containing locus coeruleus neurons in behaving rats exhibit pronounced responses to non-noxious environmental stimuli. J. Neurosci. 1, 887–900 (1981). - PMC - PubMed