. 2022 Aug 19;8(33):eabq1898.
doi: 10.1126/sciadv.abq1898. Epub 2022 Aug 19.

Successive climate crises in the deep past drove the early evolution and radiation of reptiles

Affiliations

Successive climate crises in the deep past drove the early evolution and radiation of reptiles

Tiago R Simões et al. Sci Adv. .

Abstract

Climate change-induced mass extinctions provide unique opportunities to explore the impacts of global environmental disturbances on organismal evolution. However, their influence on terrestrial ecosystems remains poorly understood. Here, we provide a new time tree for the early evolution of reptiles and their closest relatives to reconstruct how the Permian-Triassic climatic crises shaped their long-term evolutionary trajectory. By combining rates of phenotypic evolution, mode of selection, body size, and global temperature data, we reveal an intimate association between reptile evolutionary dynamics and climate change in the deep past. We show that the origin and phenotypic radiation of reptiles was not solely driven by ecological opportunity following the end-Permian extinction as previously thought but also the result of multiple adaptive responses to climatic shifts spanning 57 million years.


Figures
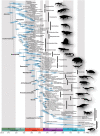
Fig. 1.
Fig. 1.. Revised evolutionary tree and divergence times for the major groups of early amniotes, early synapsids, and reptiles.
Maximum compatible tree from relaxed morphological clock Bayesian inference analysis under the SFBD tree model with a single clock partitioning and best-fitting models (see Materials and Methods and table S11). Node values represent median ages; node violin plots (cyan) represent the distribution of the 95% highest posterior density intervals. Evolutionary branches leading to taxa originating after the Jurassic are omitted for simplicity (for full tree, see figs. S5 and S6).
Fig. 2.
Fig. 2.. Relative rates of evolution across subdivisions of the early amniote, early synapsid, and reptile phenotype.
(A) Mirrored trees depicting median relative rates of morphological evolution under the SFBD tree model using partitioned relaxed morphological clocks (see also figs. S9 and S10). (B) Kernel density plots depicting rate distributions for cranial and postcranial partitions for each major synapsid and reptile clade. Names in bold* indicate clades with significantly different rates between morphological partitions (i.e., mosaic evolution). Relative rates increase substantially in Archelosauria relative to all other groups of reptiles and early synapsids, but rate heterogeneity occurs in both slow- and fast-evolving evolutionary lineages.
Fig. 3.
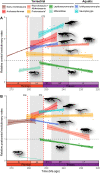
Fig. 3.. Relative evolutionary rates by morphological region and across time for reptile groups under strong selective regimes between the middle Permian and Late Triassic.
(A) Relative cranial evolutionary rates. (B) Relative postcranial evolutionary rates. Horizontal black dashed line indicates the base of the clock rate. Protorosauria* includes a mixture of terrestrial (ground dwelling and arboreal) and semiaquatic taxa. Vertical red dashed lines indicate the time of major mass extinctions caused by global warming: the EGE and the PTE. Each data point represents a sampled species in the morphological dataset (depicted in Fig. 1 and figs. S1 to S10).
Fig. 4.
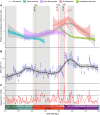
Fig. 4.. Rates of morphological and global temperature change during early reptile evolution.
(A) Relative rates of morphological evolution (for whole body) across time for the major groups of reptiles. See fig. S6 for rates in a time tree and figs. S12 and S13 for results inclusive of early synapsids. SAC, Sakmarian-Artinskian Crisis. (B) Mean sea surface temperatures (SSTs) at every 1 Ma (black dots) and their respective 95% confidence interval (CI; blue vertical lines) [from data file S1 and (47)]. Loess best-fit line across all mean SST values (black solid line) and its 95% CI (gray area) indicate geological long-term temperature trends. (C) Rates of temperature change (the total step change in global mean SST per million year) (from data file S1). Horizontal black dashed lines indicate critical temperature threshold of 3° and 5.2°C. Vertical red dashed lines indicate the time of major mass extinctions caused by global warming: the EGE and the PTE. The vertical orange dashed line marks a mass extinction caused by global cooling: the SAC.
Fig. 5.
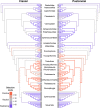
Fig. 5.. Inferred mode of selection across subdivisions of the early amniote, early synapsid, and reptile phenotype.
Branches in shades of blue indicate rates significantly lower than the background rates, indicative of stabilizing selection (or stasis). Branches in shades of red indicate rates significantly higher than the background rates, indicative of positive (or directional) selection. Branches in gray indicate evolutionary rates not significantly different from the background rates (indicating neutral evolution)—following interpretation in (27). Stasis is the most frequent pattern, broken almost exclusively by archelosaurs toward positive selection.
Fig. 6.
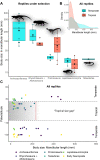
Fig. 6.. Body size comparisons among terrestrial reptile clades and paleolatitudes.
(A) Boxplots of body size for terrestrial clades inferred as undergoing strong selective pressures (directional or stabilizing) for both phenotypic partitions (Fig. 5) between the late Permian and Late Triassic. Y axis depicts ln-transformed mandibular length as used for statistical analyses (see figs. S16 to S19 for additional plots also using femoral length, absolute values, and sampling up to the Middle Triassic). Dots, species data points; diamonds, medians; horizontal lines, means. (B) Kernel density plots depicting the distribution of body sizes for all terrestrial reptile clades by geographical region between the late Permian and Late Triassic (see also figs. S20 and S21 for additional plots also using femoral length, ln-transformed data, and sampling up to the Middle Triassic). The fields are transparent, and the darker region is the overlap between the two geozones. (C) Geographical distribution of body sizes among all terrestrial reptile clades (i.e., according to their paleolatitudes) between the late Permian and Late Triassic (see also fig. S22 for additional plots also using femoral length, ln-transformed data, and sampling up to the Middle Triassic). Dots, species data points. Whereas small-sized reptiles occur in both temperate and tropical zones, there is a maximum limit for reptile body sizes in tropical regions, creating a tropical size gap (B and C). Body size and latitude data are available in data file S1, summary statistics are available in tables S5 to S8, and pairwise Mann-Whitney tests for significant differences between major clades and paleolatitudes are reported in tables S9 and S10.

Similar articles

Cited by

References

    1. Sinervo B., Méndez-de-la-Cruz F., Miles D. B., Heulin B., Bastiaans E., Villagrán-Santa Cruz M., Lara-Resendiz R., Martínez-Méndez N., Calderón-Espinosa M. L., Meza-Lázaro R. N., Gadsden H., Avila L. J., Morando M., de la Riva I. J., Sepulveda P. V., Rocha C. F. D., Ibargüengoytía N., Puntriano C. A., Massot M., Lepetz V., Oksanen T. A., Chapple D. G., Bauer A. M., Branch W. R., Clobert J., Sites J. W. Jr., Erosion of lizard diversity by climate change and altered thermal niches. Science 328, 894–899 (2010). - PubMed
    1. Prates I., Xue A. T., Brown J. L., Alvarado-Serrano D. F., Rodrigues M. T., Hickerson M. J., Carnaval A. C., Inferring responses to climate dynamics from historical demography in neotropical forest lizards. Proc. Natl. Acad. Sci. U.S.A. 113, 7978–7985 (2016). - PMC - PubMed
    1. Grizante M. B., Brandt R., Kohlsdorf T., Evolution of body elongation in gymnophthalmid lizards: Relationships with climate. PLOS ONE 7, e49772 (2012). - PMC - PubMed
    1. Fontanella F. M., Feltrin N., Avila L. J., Sites J. W. Jr., Morando M., Early stages of divergence: Phylogeography, climate modeling, and morphological differentiation in the South American lizard Liolaemus petrophilus (Squamata: Liolaemidae). Ecol. Evol. 2, 792–808 (2012). - PMC - PubMed
    1. Meiri S., Bauer A. M., Chirio L., Colli G. R., Das I., Doan T. M., Feldman A., Herrera F. C., Novosolov M., Pafilis P., Pincheira-Donoso D., Powney G., Torres-Carvajal O., Uetz P., van Damme R., Are lizards feeling the heat? A tale of ecology and evolution under two temperatures. Glob. Ecol. Biogeogr. 22, 834–845 (2013).