Proteomic profiling platforms head to head: Leveraging genetics and clinical traits to compare aptamer- and antibody-based methods
- PMID: 35984888
- PMCID: PMC9390994
- DOI: 10.1126/sciadv.abm5164
Proteomic profiling platforms head to head: Leveraging genetics and clinical traits to compare aptamer- and antibody-based methods
Abstract
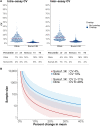
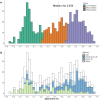
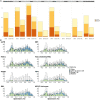
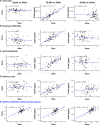
High-throughput proteomic profiling using antibody or aptamer-based affinity reagents is used increasingly in human studies. However, direct analyses to address the relative strengths and weaknesses of these platforms are lacking. We assessed findings from the SomaScan1.3K (N = 1301 reagents), the SomaScan5K platform (N = 4979 reagents), and the Olink Explore (N = 1472 reagents) profiling techniques in 568 adults from the Jackson Heart Study and 219 participants in the HERITAGE Family Study across four performance domains: precision, accuracy, analytic breadth, and phenotypic associations leveraging detailed clinical phenotyping and genetic data. Across these studies, we show evidence supporting more reliable protein target specificity and a higher number of phenotypic associations for the Olink platform, while the Soma platforms benefit from greater measurement precision and analytic breadth across the proteome.
Figures


References
-
- Ngo D., Sinha S., Shen D., Kuhn E. W., Keyes M. J., Shi X., Benson M. D., O’Sullivan J. F., Keshishian H., Farrell L. A., Fifer M. A., Vasan R. S., Sabatine M. S., Larson M. G., Carr S. A., Wang T. J., Gerszten R. E., Aptamer-based proteomic profiling reveals novel candidate biomarkers and pathways in cardiovascular disease. Circulation 134, 270–285 (2016). - PMC - PubMed
-
- Egerstedt A., Berntsson J., Smith M. L., Gidlöf O., Nilsson R., Benson M., Wells Q. S., Celik S., Lejonberg C., Farrell L., Sinha S., Shen D., Lundgren J., Rådegran G., Ngo D., Engström G., Yang Q., Wang T. J., Gerszten R. E., Smith J. G., Profiling of the plasma proteome across different stages of human heart failure. Nat. Commun. 10, 5830 (2019). - PMC - PubMed
-
- Assarsson E., Lundberg M., Holmquist G., Björkesten J., Thorsen S. B., Ekman D., Eriksson A., Rennel Dickens E., Ohlsson S., Edfeldt G., Andersson A.-C., Lindstedt P., Stenvang J., Gullberg M., Fredriksson S., Homogenous 96-plex PEA immunoassay exhibiting high sensitivity, specificity, and excellent scalability. PlOS ONE 9, e95192 (2014). - PMC - PubMed
MeSH terms
Substances
Grants and funding
- HHSN268201100037C/HL/NHLBI NIH HHS/United States
- R01 NR019628/NR/NINR NIH HHS/United States
- HHSN268201800012C/HL/NHLBI NIH HHS/United States
- R01 HL127564/HL/NHLBI NIH HHS/United States
- U24 DK112340/DK/NIDDK NIH HHS/United States
- HHSN268201800014C/HL/NHLBI NIH HHS/United States
- R01 HL142711/HL/NHLBI NIH HHS/United States
- RF1 AG063507/AG/NIA NIH HHS/United States
- HHSN268201800012I/HL/NHLBI NIH HHS/United States
- R01 HL133870/HL/NHLBI NIH HHS/United States
- R01 HL117626/HL/NHLBI NIH HHS/United States
- HHSN268201800011I/HB/NHLBI NIH HHS/United States
- R01 HL146462/HL/NHLBI NIH HHS/United States
- P30 GM118430/GM/NIGMS NIH HHS/United States
- DP5 OD029586/OD/NIH HHS/United States
- R01 HL120393/HL/NHLBI NIH HHS/United States
- R01 HL047327/HL/NHLBI NIH HHS/United States
- KL2 TR002542/TR/NCATS NIH HHS/United States
- R01 HL047323/HL/NHLBI NIH HHS/United States
- HHSN268201800014I/HB/NHLBI NIH HHS/United States
- U01 HL120393/HL/NHLBI NIH HHS/United States
- R01 DK081572/DK/NIDDK NIH HHS/United States
- HHSN268201800001C/HL/NHLBI NIH HHS/United States
- HHSN268201800013I/MD/NIMHD NIH HHS/United States
- R01 HL132320/HL/NHLBI NIH HHS/United States
- HHSN268201800011C/HL/NHLBI NIH HHS/United States
- T32 HL007374/HL/NHLBI NIH HHS/United States
- HHSN268201800015I/HB/NHLBI NIH HHS/United States
- K23 HL150327/HL/NHLBI NIH HHS/United States
- F32 HL150992/HL/NHLBI NIH HHS/United States
- HHSN268201800010I/HB/NHLBI NIH HHS/United States
- R01 HL047317/HL/NHLBI NIH HHS/United States
- K08 HL145095/HL/NHLBI NIH HHS/United States
- R01 HL045670/HL/NHLBI NIH HHS/United States
LinkOut - more resources
Full Text Sources

