. 2022 Aug 12;7(74):eabl3795.
doi: 10.1126/sciimmunol.abl3795. Epub 2022 Aug 19.

PDIA3 epitope-driven immune autoreactivity contributes to hepatic damage in type 2 diabetes

Affiliations

PDIA3 epitope-driven immune autoreactivity contributes to hepatic damage in type 2 diabetes

Cristina C Clement et al. Sci Immunol. .

Abstract

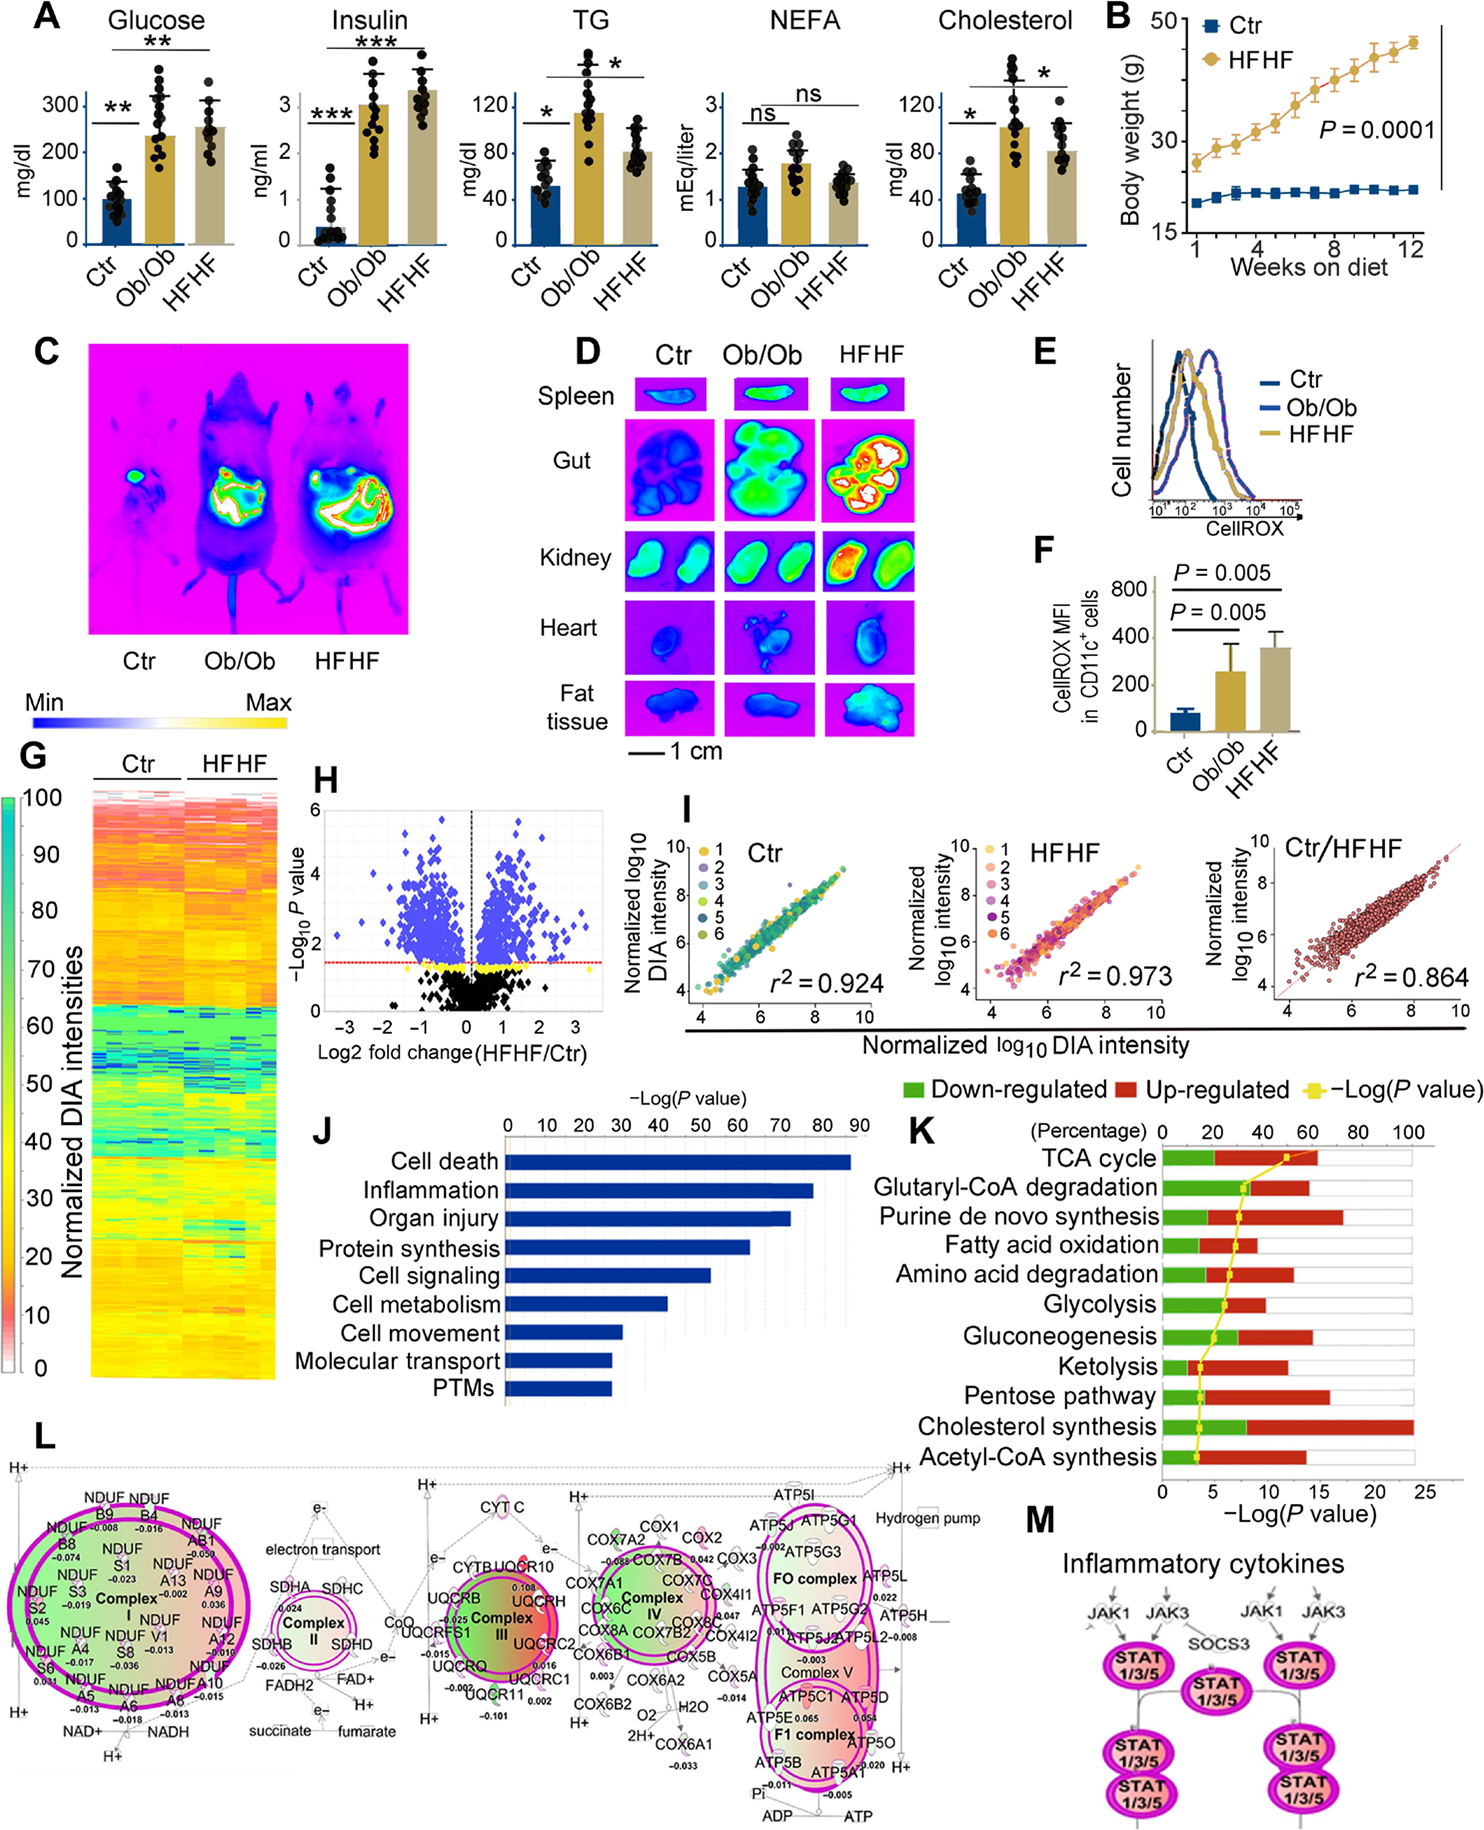
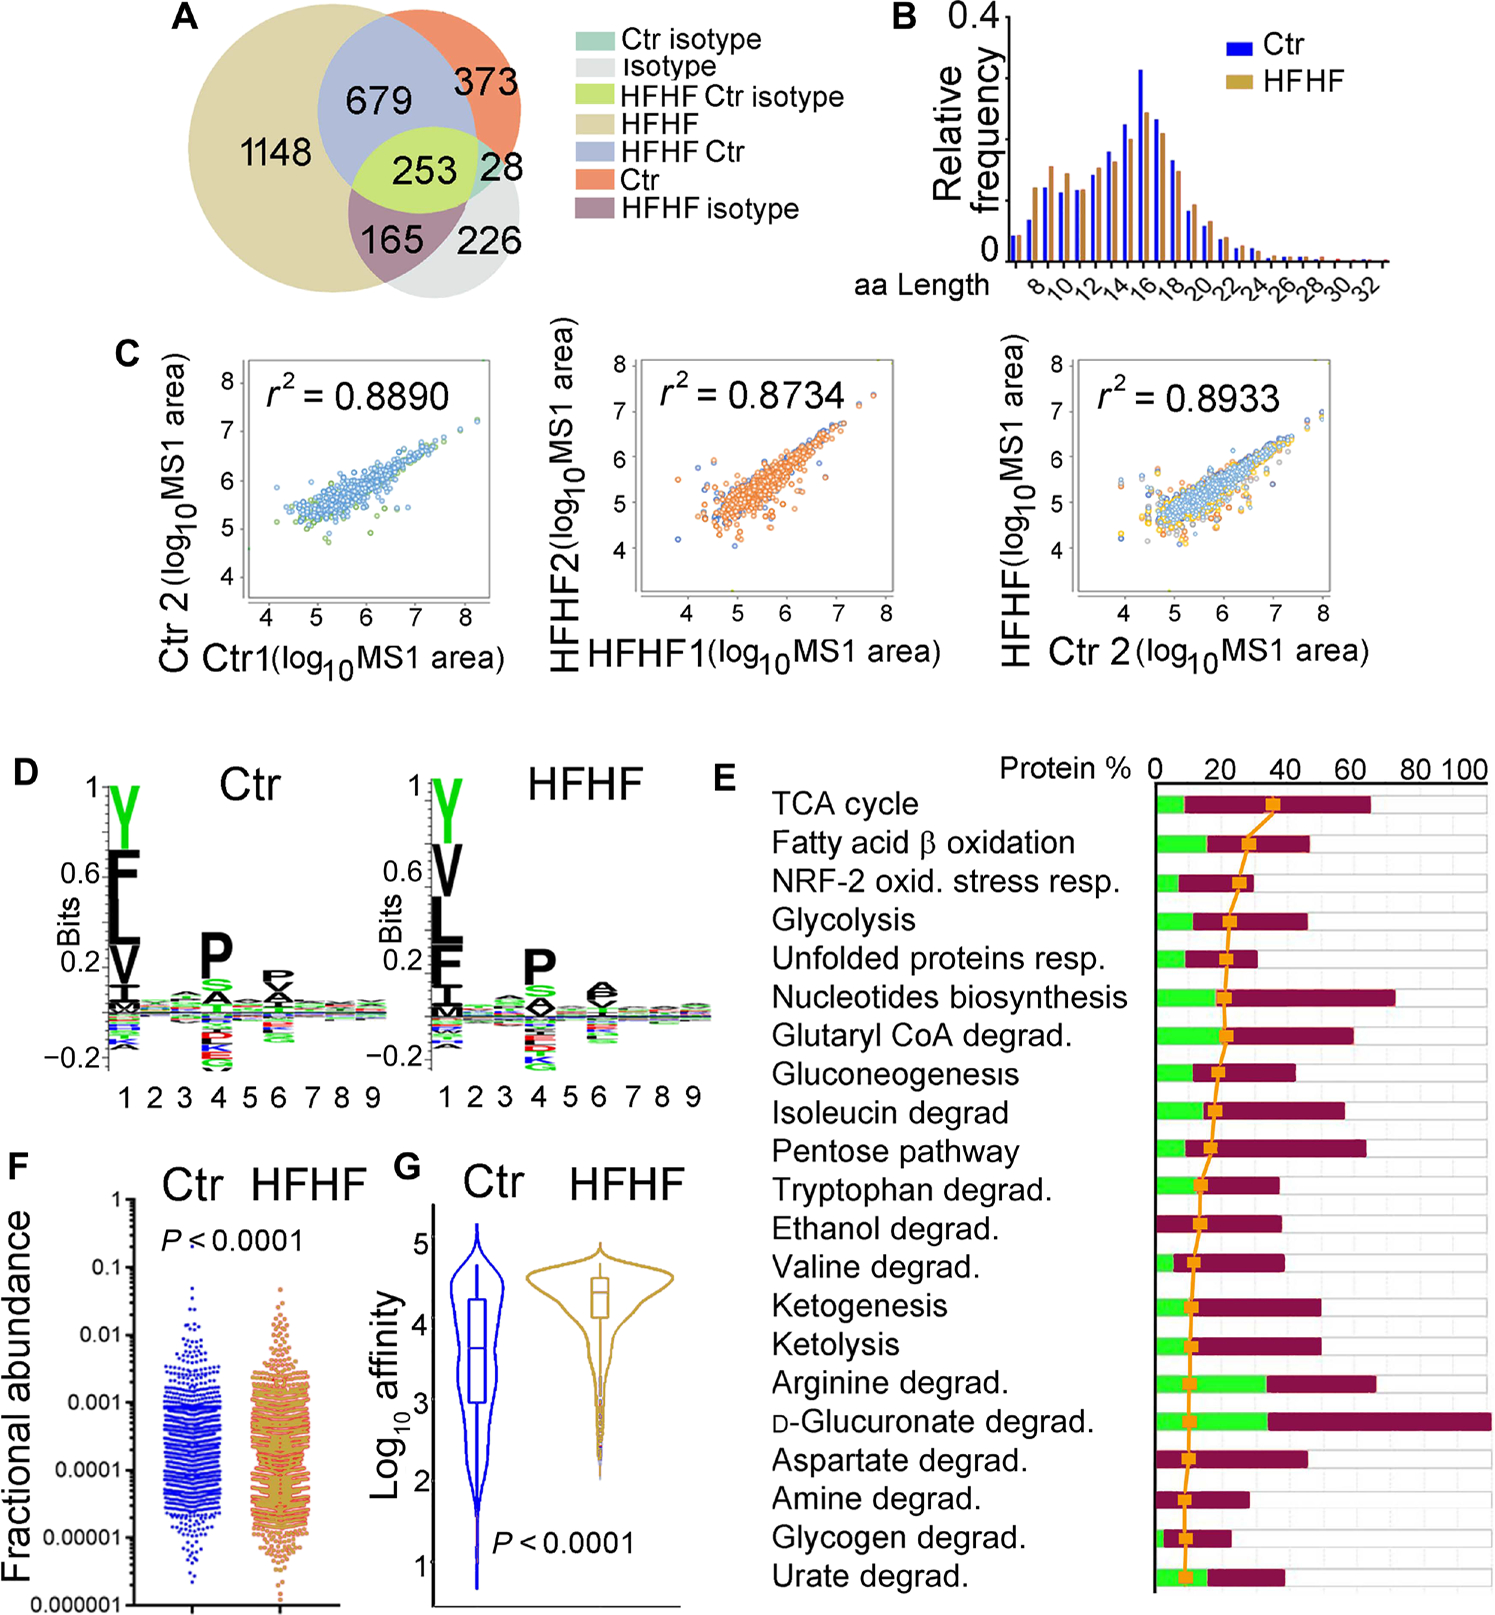
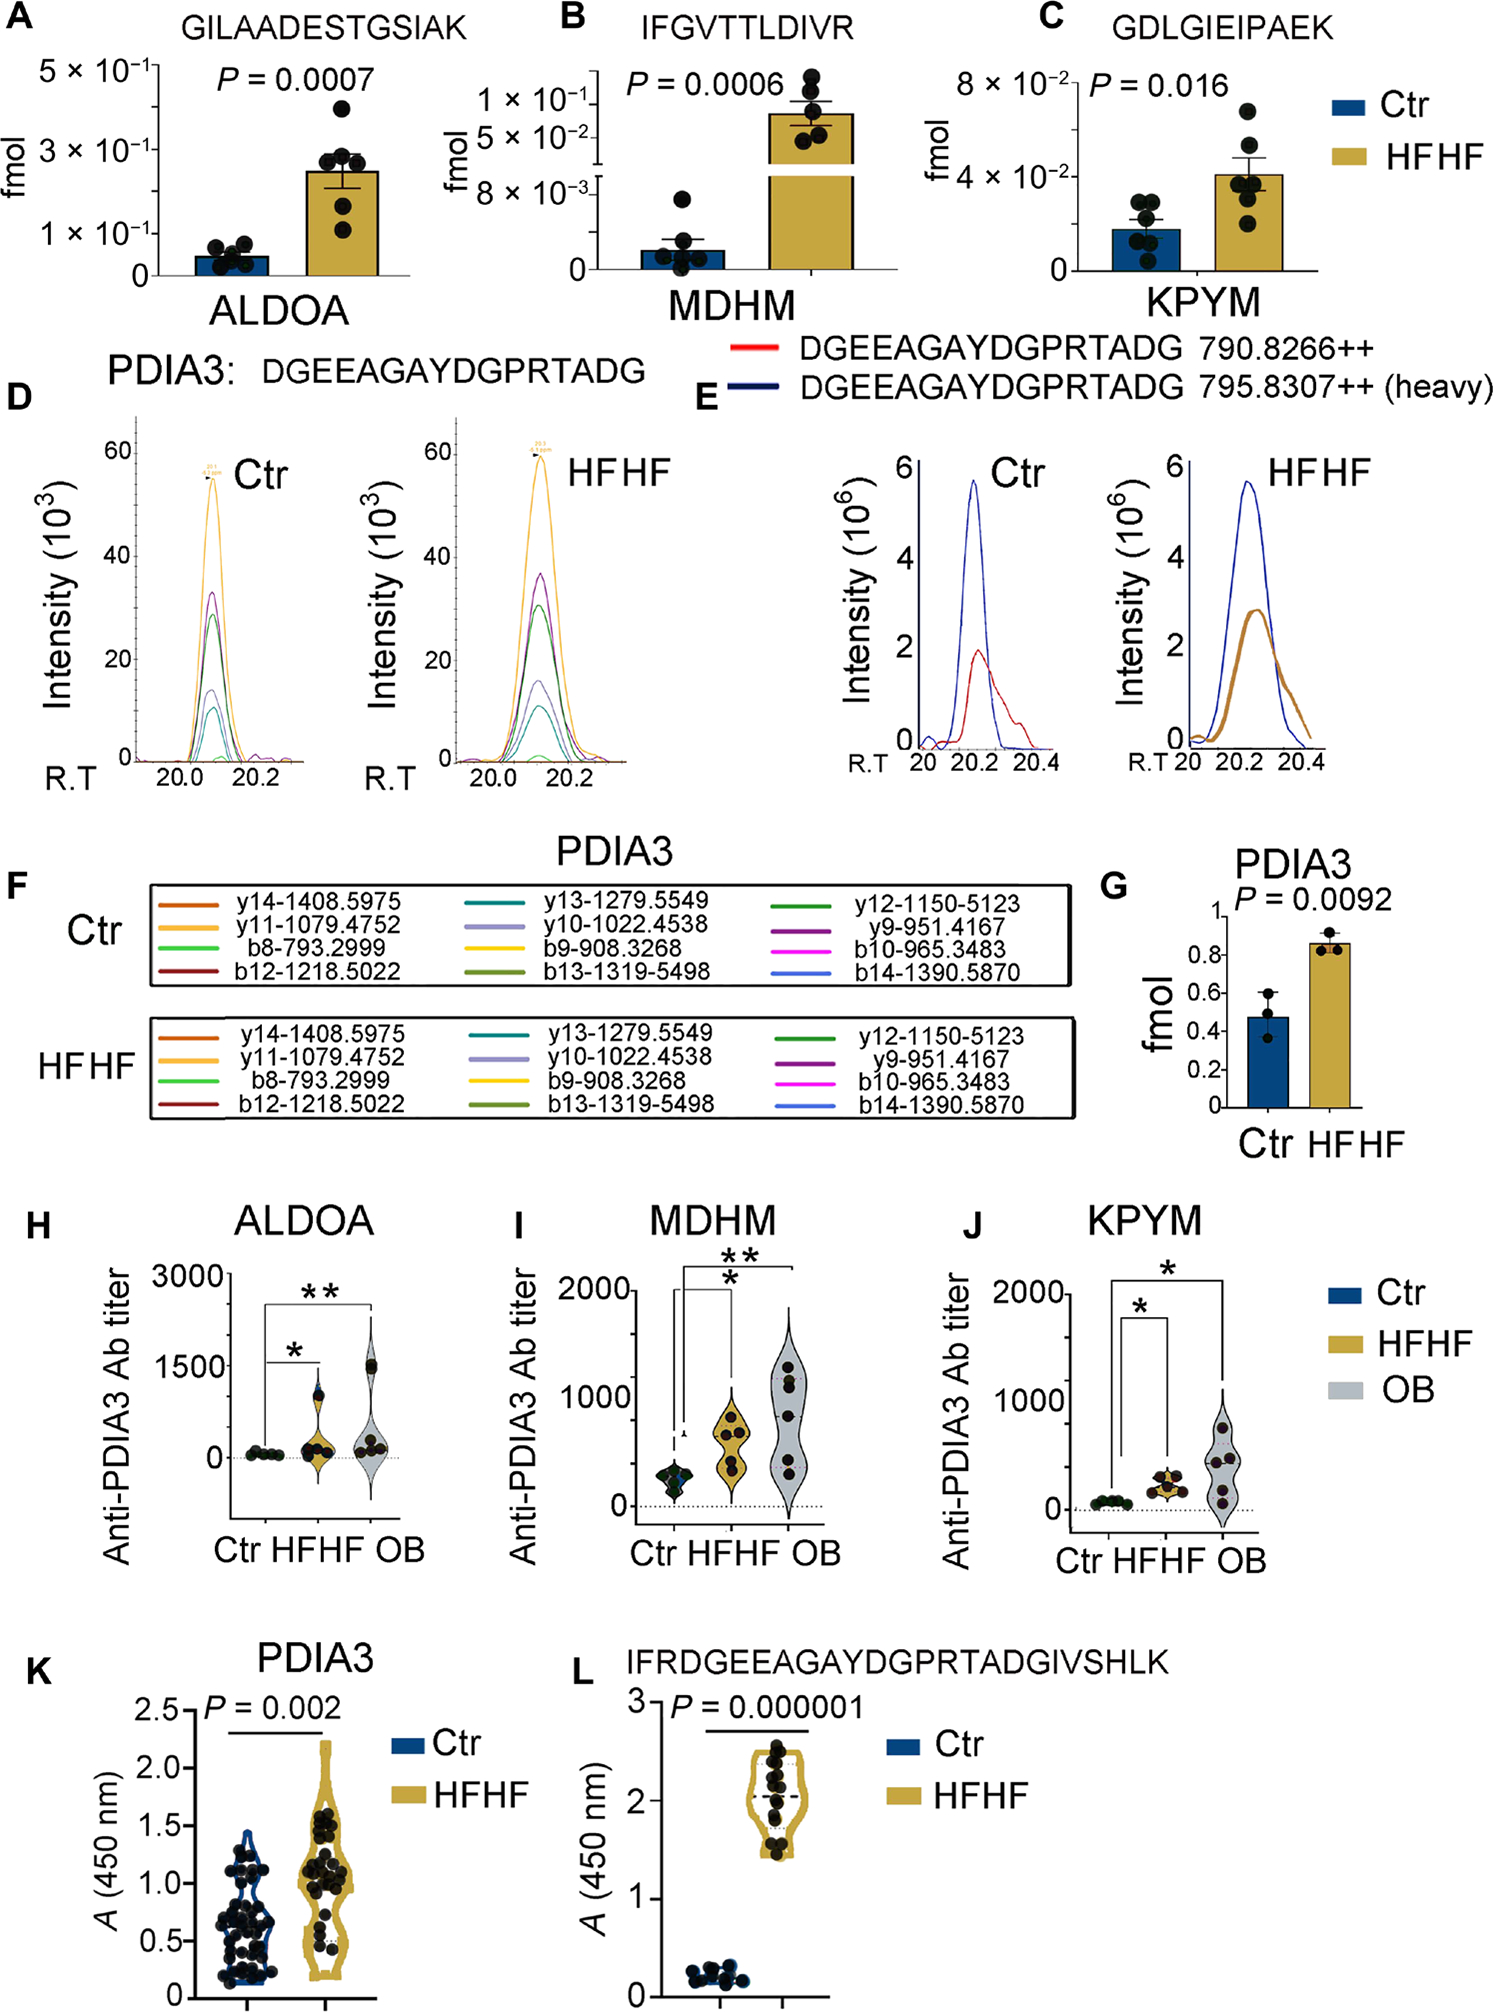
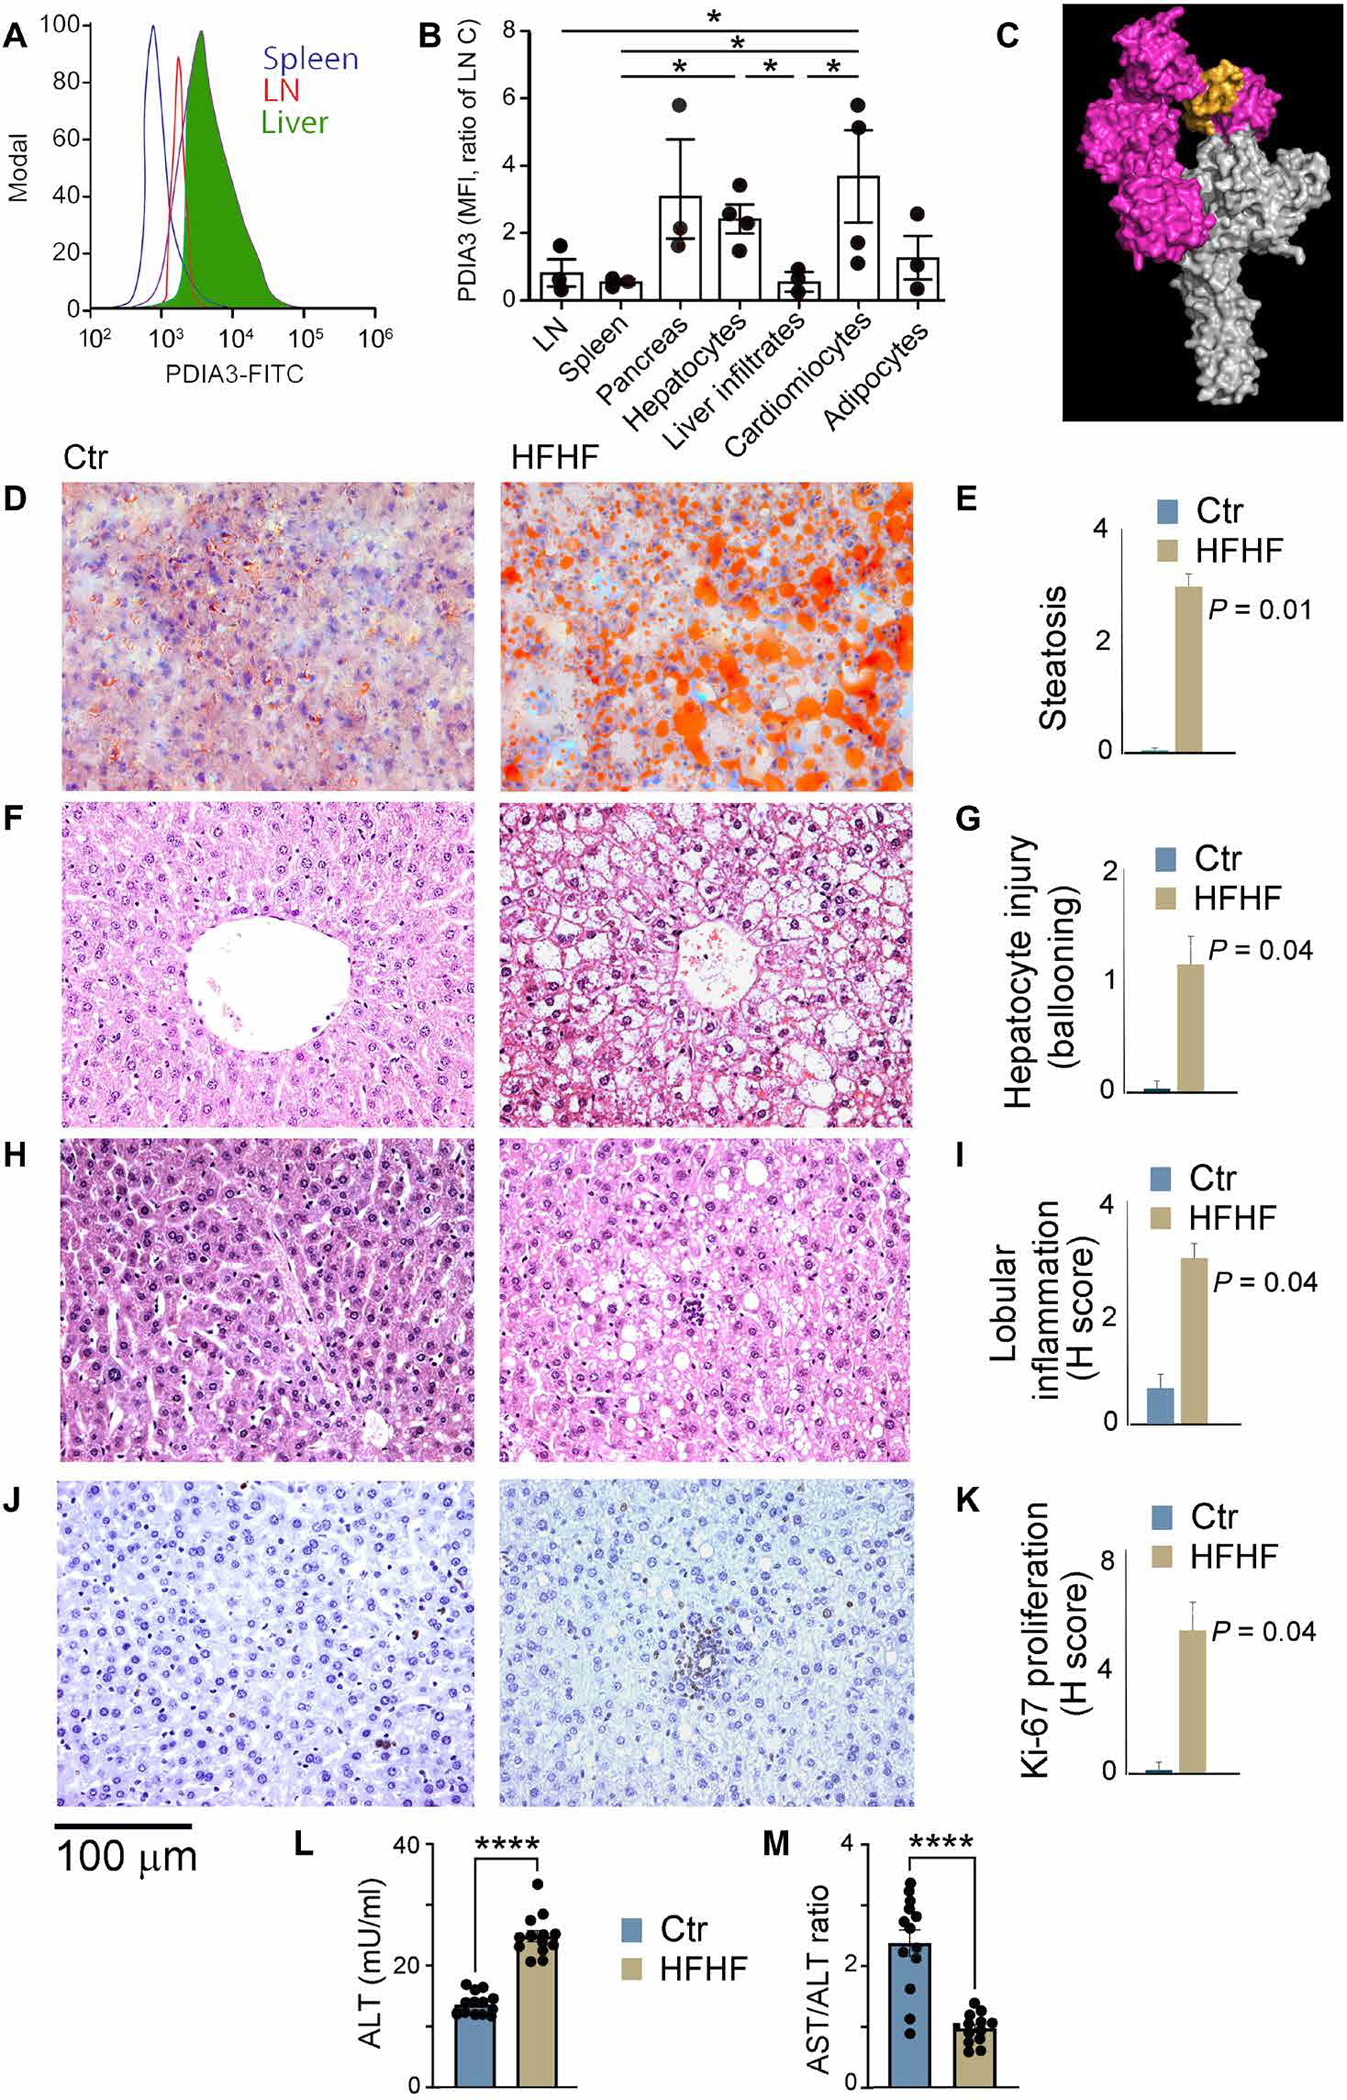
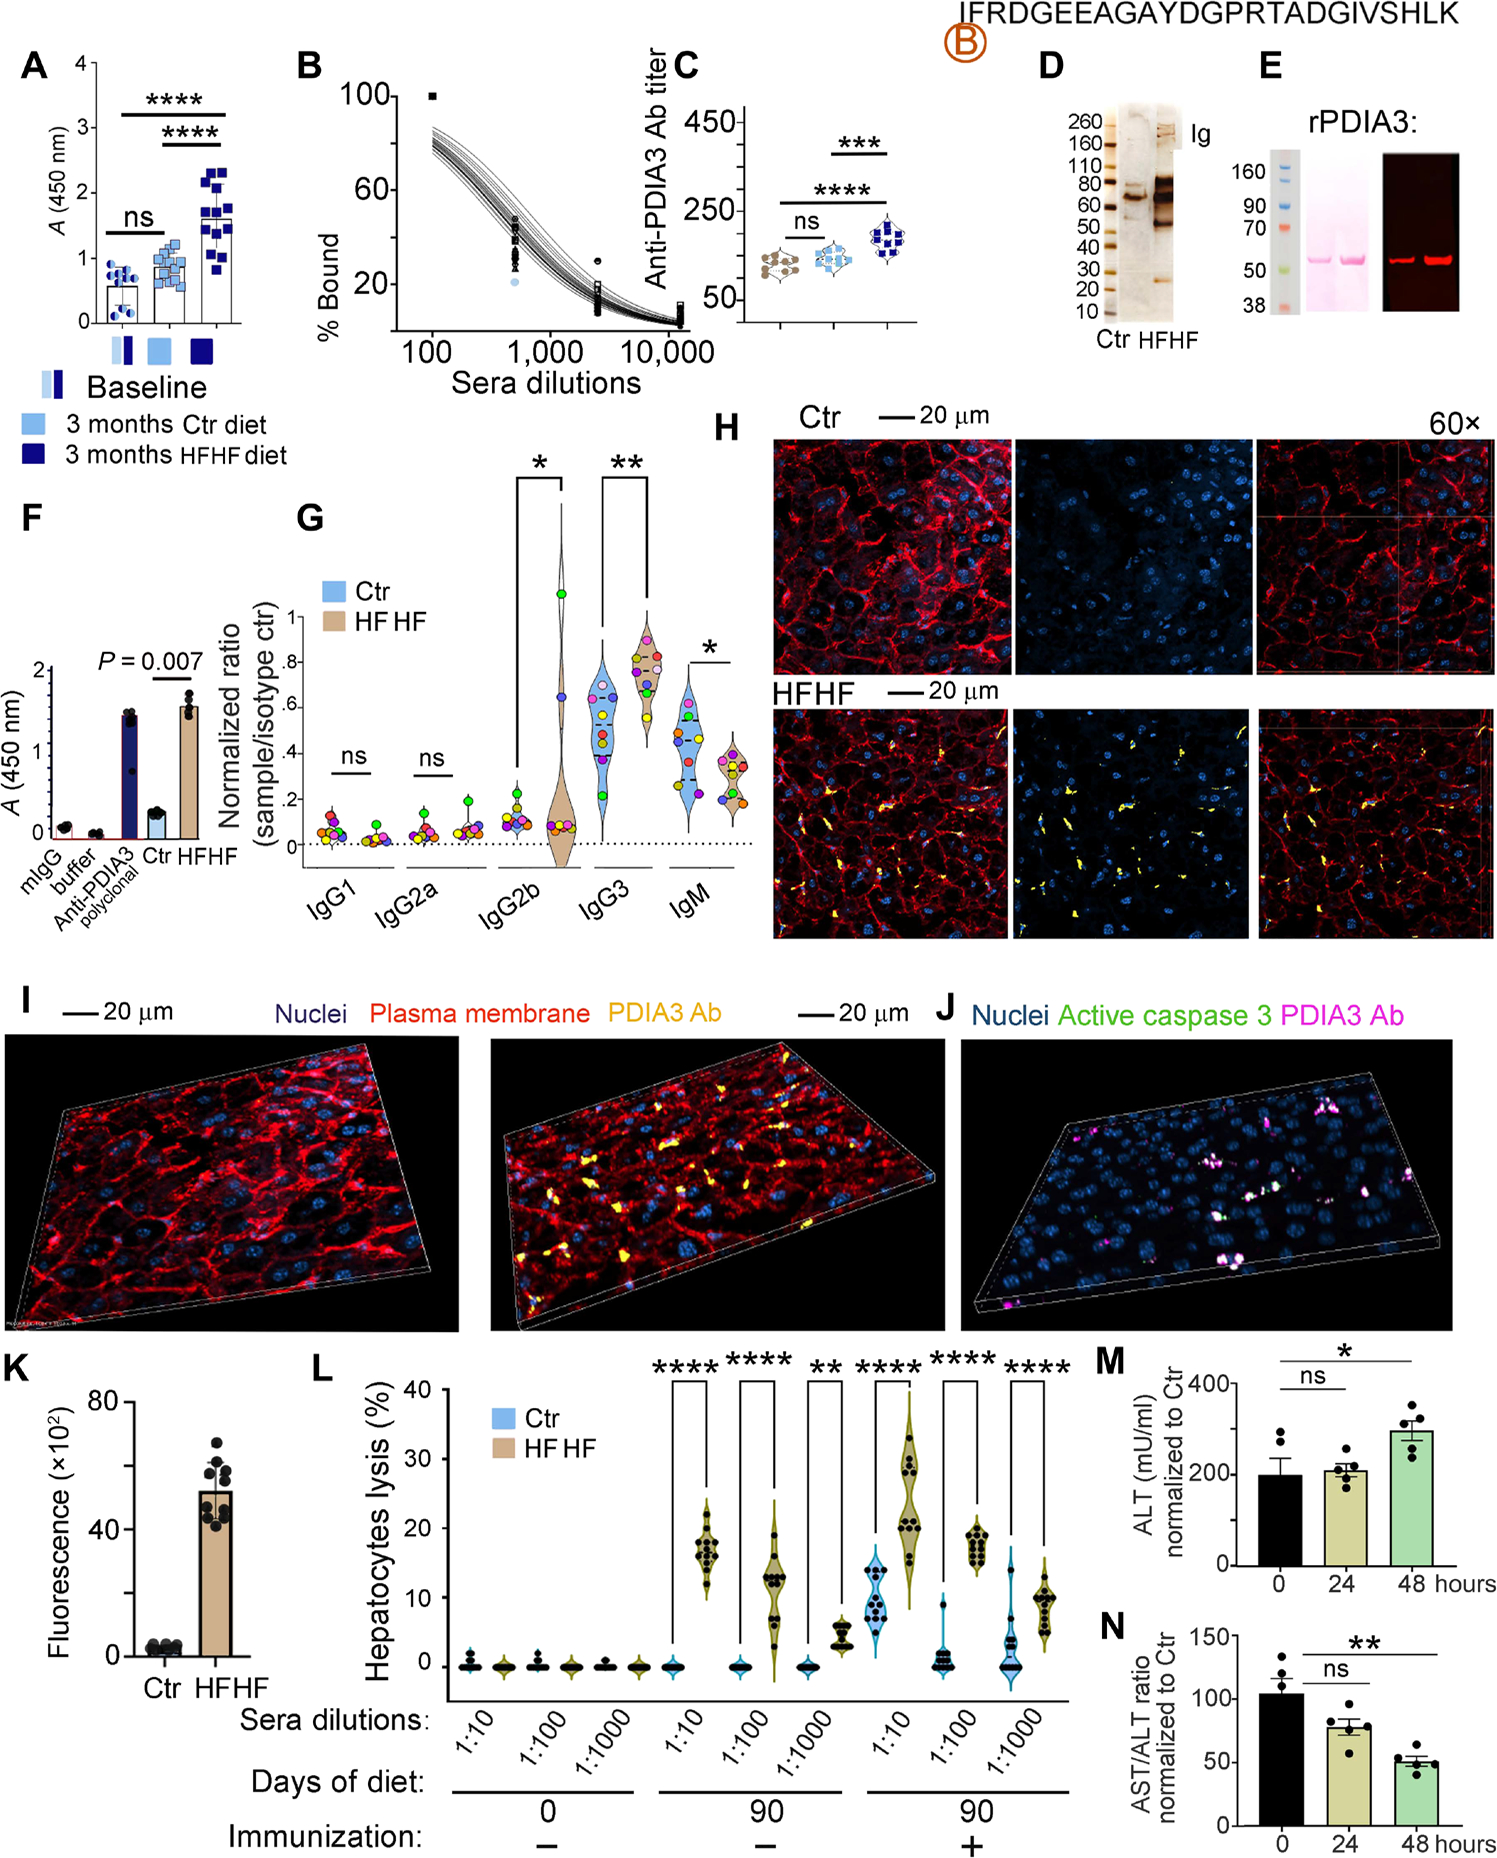
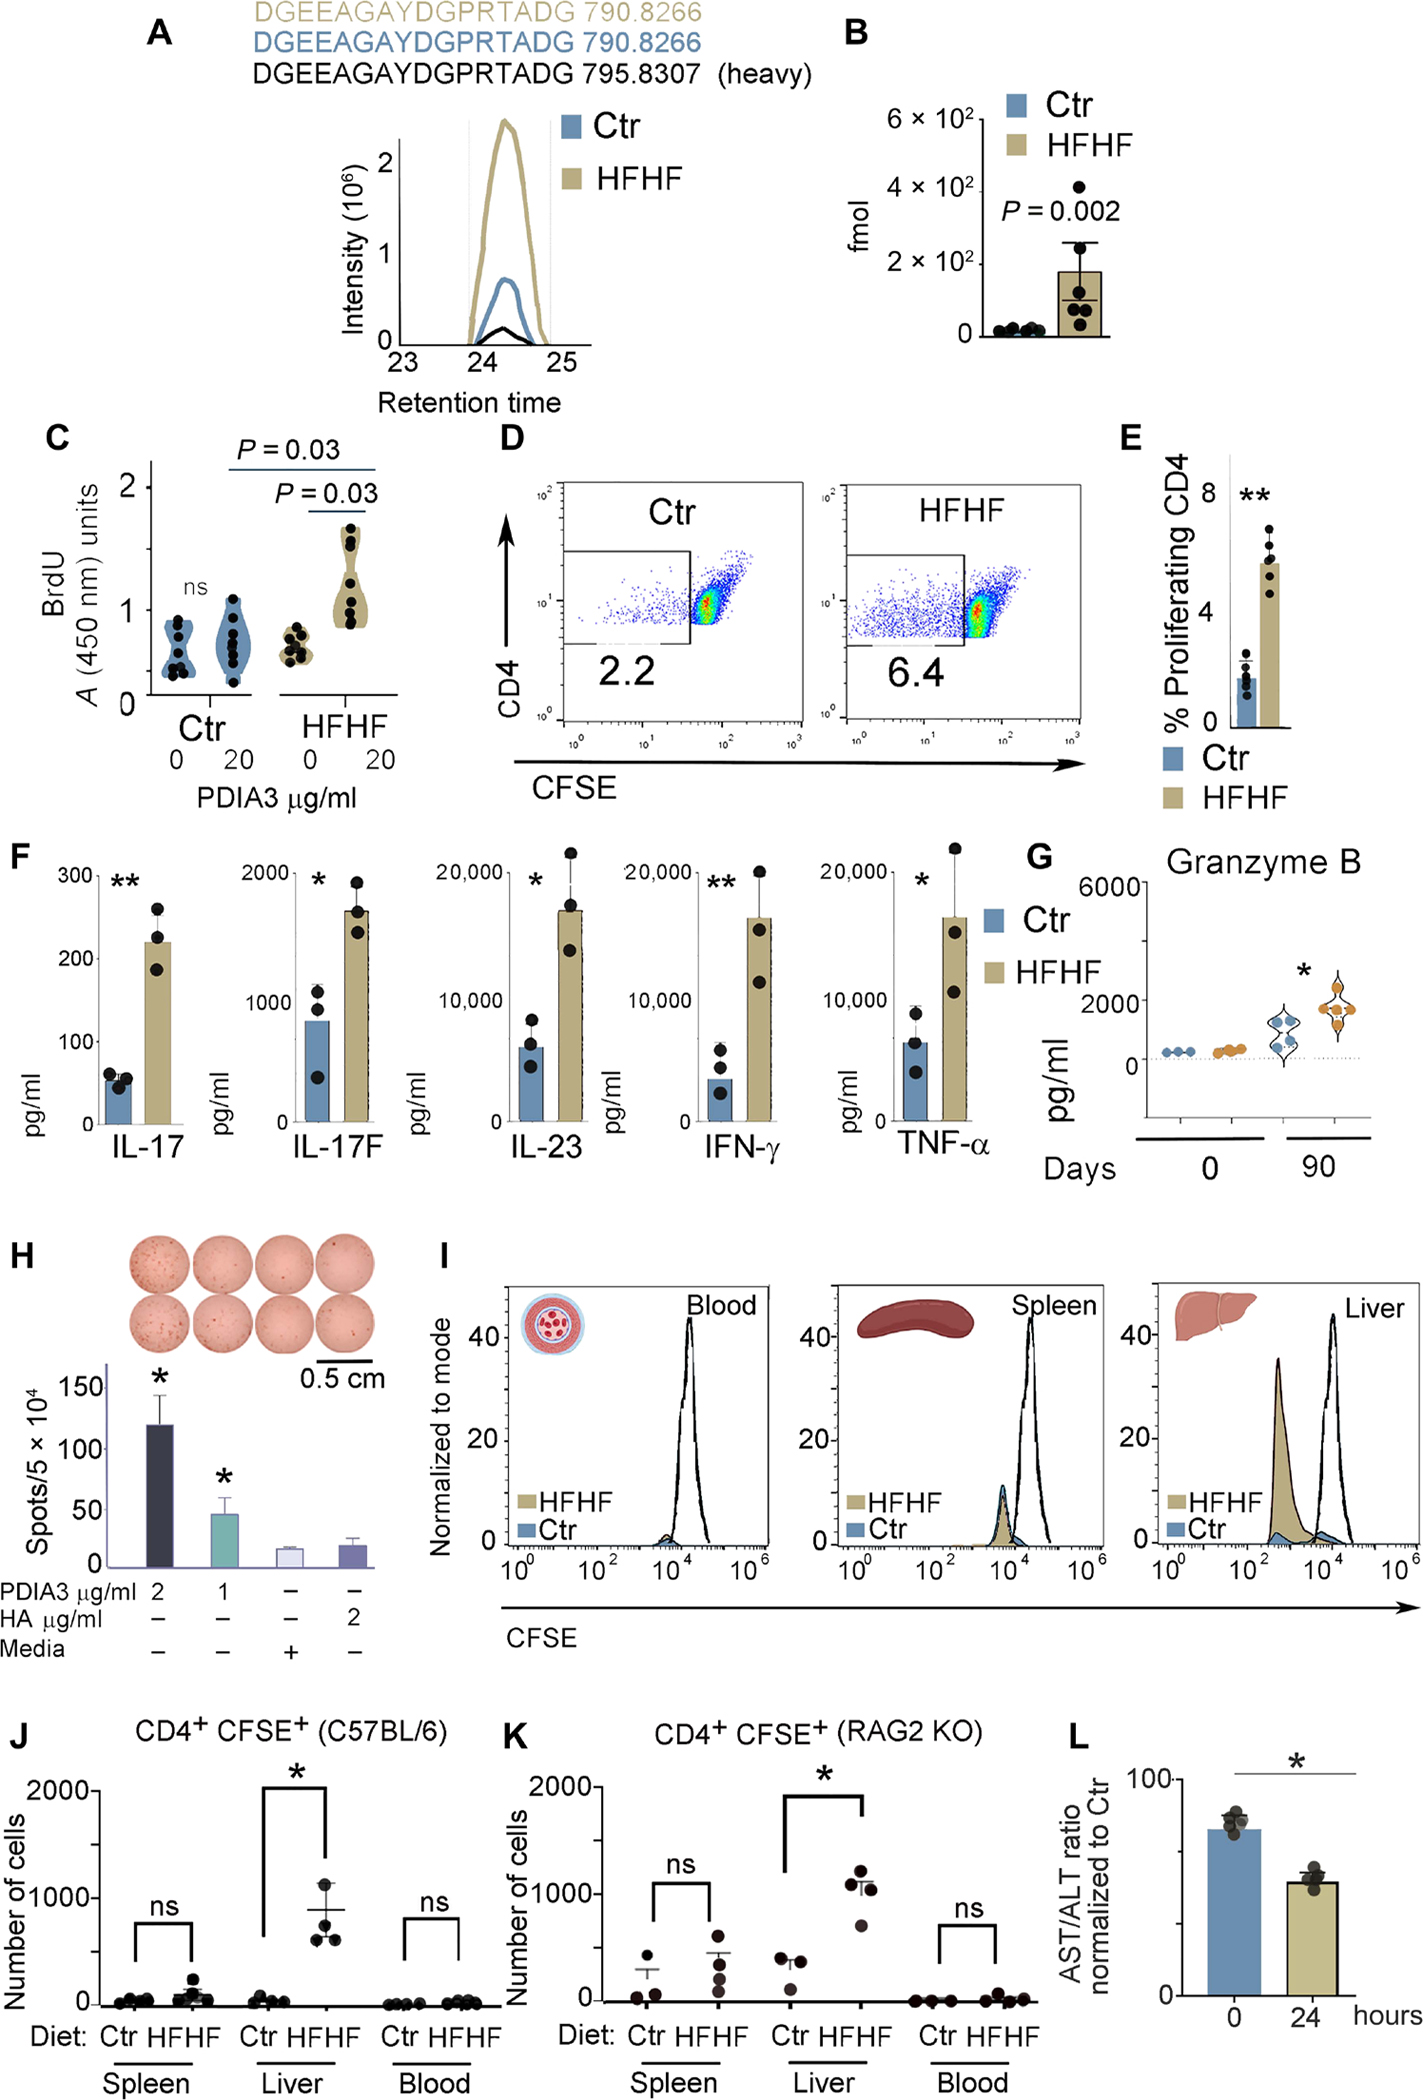
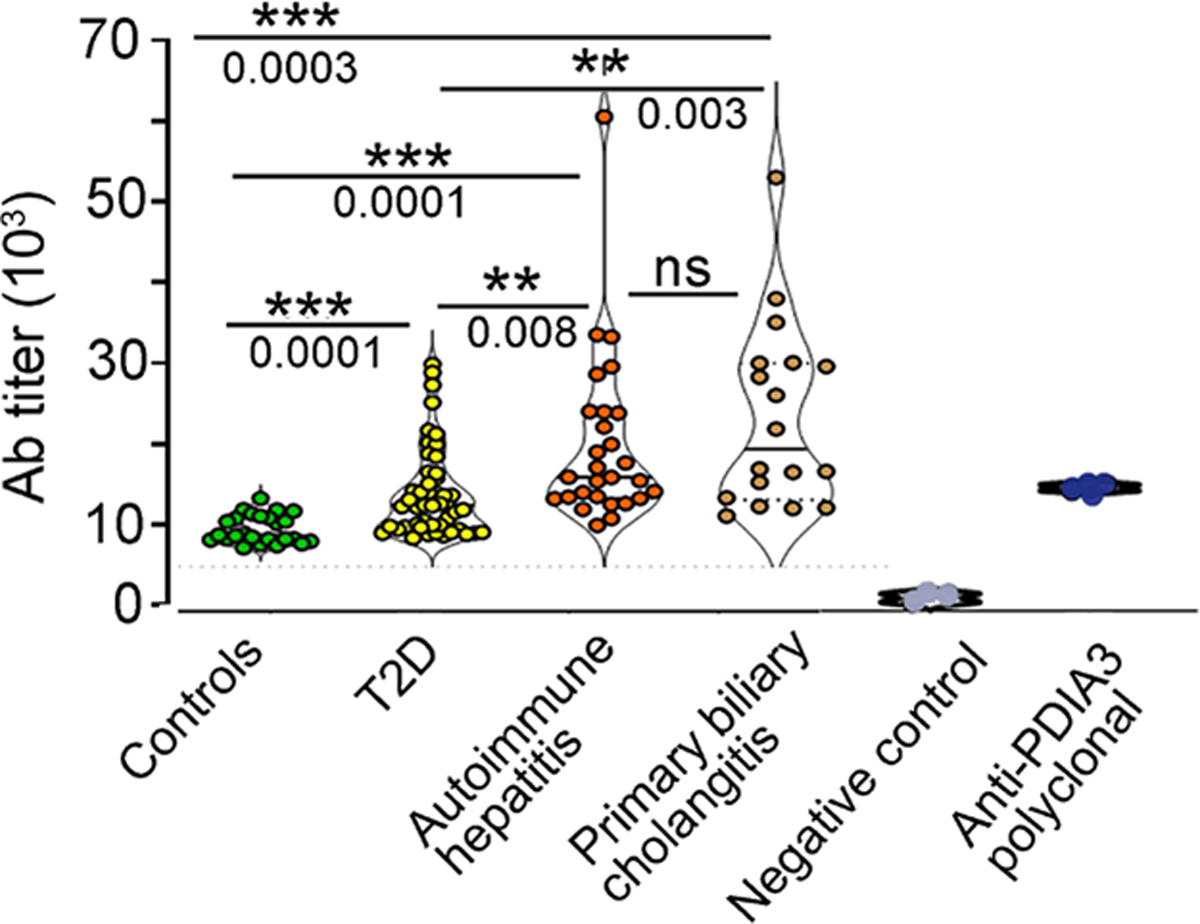
A diet rich in saturated fat and carbohydrates causes low-grade chronic inflammation in several organs, including the liver, ultimately driving nonalcoholic steatohepatitis. In this setting, environment-driven lipotoxicity and glucotoxicity induce liver damage, which promotes dendritic cell activation and generates a major histocompatibility complex class II (MHC-II) immunopeptidome enriched with peptides derived from proteins involved in cellular metabolism, oxidative phosphorylation, and the stress responses. Here, we demonstrated that lipotoxicity and glucotoxicity, as driven by a high-fat and high-fructose (HFHF) diet, promoted MHC-II presentation of nested T and B cell epitopes from protein disulfide isomerase family A member 3 (PDIA3), which is involved in immunogenic cell death. Increased MHC-II presentation of PDIA3 peptides was associated with antigen-specific proliferation of hepatic CD4+ immune infiltrates and isotype switch of anti-PDIA3 antibodies from IgM to IgG3, indicative of cellular and humoral PDIA3 autoreactivity. Passive transfer of PDIA3-specific T cells or PDIA3-specific antibodies also exacerbated hepatocyte death, as determined by increased hepatic transaminases detected in the sera of mice subjected to an HFHF but not control diet. Increased humoral responses to PDIA3 were also observed in patients with chronic inflammatory liver conditions, including autoimmune hepatitis, primary biliary cholangitis, and type 2 diabetes. Together, our data indicated that metabolic insults caused by an HFHF diet elicited liver damage and promoted pathogenic immune autoreactivity driven by T and B cell PDIA3 epitopes.


Conflict of interest statement

Competing interests: L.G. has been holding research contracts with Lytix Biopharma and Promontory; has received consulting/advisory honoraria from Boehringer Ingelheim, AstraZeneca, OmniSEQ, Onxeo, The Longevity Labs, Inzen, Sotio, Promontory, Noxopharm, EduCom, and the Luke Heller TECPR2 Foundation; and holds Promontory stock options. The other authors declare no competing interests.

Figures

Fig. 1.
Fig. 1.. Metabolic stress in Ob/Ob mice and mice on high-fat and high-fructose diet affects the DC proteome.
(A) Plasma concentrations of glucose, insulin, triglycerides (TG), nonesterified fatty acids (NEFA), and cholesterol in B6 (control), Ob/Ob mice, and B6 mice kept for 3 months on an HFHF diet. Each dot represents one biological sample. Values, from n = 14 biologically independent replicates, are reported as mean relative expression ± SD and were statistically analyzed using a two-tailed paired Student’s t test. Significance levels are reported as *P < 0.05, **P < 0.01 and ***P < 0.001. ns, nonsignificant. (B) Chart representing weight gain over a 3-month period in mice kept on a regular diet or HFHF diet. Values, from n = 14 biologically independent replicates, are reported as mean relative expression ± SD and were statistically analyzed using a two-tailed paired Student’s t test. (C) In vivo imaging of B6 (control), Ob/Ob, and HFHF mice using the In Vivo F PRO imaging system after intravenous injection with the oxidative stress detection reagent CellROX (excitation, 640 nm; emission, 664 nm). (D) Ex vivo imaging of spleen, gut, kidney, heart, and fat tissue samples collected from CellROX intravenously injected animals, imaged with the In Vivo F PRO imaging system. Samples were imaged for 3 min at excitation 610 nm/emission 700 nm using a built-in cooled charge-coupled device camera. Fluorescence intensity scale ranges from pink (lowest level) to red (highest level). (E) Representative fluorescence-activated cell sorting analysis of CellROX staining on CD11c+ DCs from the spleens of control, Ob/Ob, and HFHF mice, previously injected with CellROX as detailed in (C). (F) Bar graph of the MFI of CellROX as detected in CD11c+ DCs from the spleens of control, HFHF, and Ob/Ob mice; average and SD from four biological replicates (fig. S1). Values, from n = 6 biologically independent replicates, are reported as mean relative expression ± SD and were statistically analyzed using a two-tailed paired Student’s t test. (G) LFQ analysis of changes in the protein expression profiles induced by HFHF diet in primary murine DCs. The proteome was analyzed by nano-LC DIA, and the heatmap was generated in Scaffold DIA using the normalized DIA intensities. The normalized DIA intensities are summed over all identified and validated peptides from each protein group and are proportional to the relative abundance of each protein. A total of 948 target proteins were identified (0.9% FDR) across all 12 biological replicates from proteomic extracts of DCs from B6 on regular or HFHF diet, having at least three unique peptides (0.3% FDR). The complete proteomic dataset (including a total of 1487 proteins identified at a 2% FDR for proteins and 0.5% FDR for peptides) is presented in table S1. (H) Volcano plot generated using the normalized total DIA intensities from the proteomics data derived from n = 6 biological control and HFHF replicates depicts the proteins that are up- or down-regulated in HFHF mice as compared with controls. LFQ DIA analysis identified 902 differently expressed proteins (P < 0.027 for green and 0.05 > P > 0.027 for yellow hits, respectively, by ANOVA/t tests with Benjamini-Hochberg correction). (I) Regression analysis of normalized DIA intensities for the 948 target proteins (identified with FDR < 1% and at least three unique peptides) in the murine DC proteomes from HFHF and controls. The Pearson’s correlation score (0.92 and 0.97, respectively) indicates the high reproducibility among the proteomes extracted from DCs of mice on either HFHF or normal diet. In contrast, the differential proteomic expression profiles among the replicates from HFHF and regular diet murine DCs are reflected by a lower Pearson coefficient (r2 = 0.864). (J) IPA of the top-scoring cellular and physiological pathways, derived from the proteins with differential expression profiles between control and HFHF mice. IPA identified significant cellular and molecular functions (P < 0.05 by Fisher’s exact test with Benjamini-Hochberg correction) associated with the inflammatory reaction, organ injury, and metabolic changes present in the HFHF group as compared with controls. (K) Analysis of the pathways associated with the proteins undergoing significant fold changes, based on LFQ DIA analysis presented in (H) and (I). The IPA-mediated quantitative analysis indicates for each pathway the percentage of proteins that are up-regulated (red) or down-regulated (green) in HFHF mice as compared with controls. Metabolic pathways [tricarboxylic acid (TCA), glycolysis, amino acid degradation, and fatty acid oxidation, among others] are the most affected by the HFHF diet. (L) IPA-generated analysis displaying mitochondrial oxidative phosphorylation and the associated macromolecular complexes affected by the HFHF diet. (M) IPA-generated analysis of the Janus kinase (JAK)/signal transducer and activator of transcription (STAT) pathway(s) up-regulated in the HFHF group as compared with controls. Green colors depict proteins down-regulated, whereas red colors depict proteins up-regulated in the HFHF versus control mice. The color intensity directly correlates with fold changes, expressed as log2 (HFHF/control normalized DIA ratios). The complete proteomic dataset and IPA analysis are presented in tables S1 and S4.
Fig. 2.
Fig. 2.. The MHC-II immunopeptidome mirrors the changes observed in the DC proteome.
(A) Venn diagram reporting the total number of unique peptides identified by DDA nano-LC-MS/MS in the pooled of biological replicates of the I-Ab–eluted immunopeptidomes (n = 4 for HFHF diet, n = 5 for control diet, n = 2 for isotype control). The complete analysis of I-Ab immunopeptidomes is presented in table S2. (B) Length distribution of I-Ab peptides eluted from control and HFHF was similar, with a median length of ~14 amino acids (aa). (C) Correlation plots of the I-Ab peptides (MS1 area) eluted from HFHF or control mice. Left: Control biological replicates (n = 5). Middle: HFHF biological replicates (n = 4). Right: Combined HFHF versus the control biological replicates. The correlation plots together with the Pearson’s correlation scores are presented in table S2. (D) I-Ab–eluted peptides from control and HFHF DCs were analyzed using GibbsCluster 2.0 Server to identify binding motif and displayed using Seq2Logo. No differences were seen in the binding motives for control versus HFHF mice. (E) Analysis of the pathways associated with the proteins derived from the I-Ab–eluted peptides undergoing significant fold changes in HFHF versus controls. The IPA-mediated quantitative analysis indicates for each pathway the percentage of proteins that are up-regulated (red) or down-regulated (green) in Ob/Ob mice as compared with controls. The yellow symbols indicate the “ratio” corresponding to the number of proteins from the experimental dataset mapped to each pathway divided by the total number of proteins that map to the canonical pathway from the IPA knowledgebase. The ratio is transformed into the significance and scored as −log(P value) from Fisher’s exact test; the significance threshold was set to a value of 1.3 for this dataset. Metabolic and stress pathways are the most affected by the HFHF diet. (F) Fractional abundance for all the unique peptides eluted from control and HFHF mice. (G) Predicted IC50 for the I-Ab–eluted peptides from control and HFHF DCs.
Fig. 3.
Fig. 3.. Increased MHC-II presentation of peptides derived from metabolic stress–associated proteins including PDIA3.
(A to C) MS-based PRM for quantitative analysis of selected endogenous peptide epitopes derived from glycolytic enzymes (ALDOA, MDHM, and KPYM) in the eluted peptidomes of liver immune infiltrates from mice on a control or HFHF diet. Values from n = 6 biologically independent replicates are reported as mean relative expression ± SD. Values were statistically analyzed using two-tailed unpaired Student’s t tests. Significance levels are reported as *P < 0.05 and **P < 0.01. The complete transition list associated with the heavy and light (endogenous) peptides is presented in table S3. (D) Skyline-extracted MS2 (y and b ions) from MS-based PRM for absolute quantitation of the endogenous PDIA3 peptide, DGEEAGAYDGPRTADG, after spiking the I-Ab immunopeptidome samples of control and HFHF eluates with 2 fmol of heavy-labeled PDIA3 DGEEAGAYDGPR[+10]TADG. (E) Representative ion-extracted chromatogram of the MS1 precursors corresponding to the identified MS2 ions shown in the left panel: The spiked heavy peptide PDIA3 DGEEAGAYDGPR[+10]TADG is shown in blue, and the corresponding endogenous light peptide is shown either in red (control diet) or in blue (HFHF diet), coeluting in both cases with the heavy standard. (F) MS2-extracted monoisotopic peaks corresponding to the b and y fragment ions resulted from the fragmentation of the PDIA3 peptide DGEEAGAYDGPRTADG and analyzed by the PRM method. (G) PRM-derived quantitative analysis of endogenous DGEEAGAYDGPRTADG in the I-Ab immunopeptidome eluate samples from control and HFHF mice. Values, from n = 6 biologically independent replicates, are reported as mean relative expression ± SD. Values were statistically analyzed using a two-tailed unpaired Student’s t test. Significance levels are reported as *P < 0.05. The complete transition list associated with the heavy and light (endogenous) peptides is presented in table S3. (H to J) Violin plots depicting antibody (Ab) titers against MDHM, ALDOA, and PYKM using mouse recombinant proteins and ELISA assays performed on serially diluted sera collected from control and HFHF or OB (Ob/Ob) mice. Values, from n = 5 biologically independent replicates, are reported as mean relative abundance ± SD. Values were statistically analyzed using one-way analysis of variance (ANOVA) Kruskal-Wallis test for multiple comparison followed by uncorrected Dunn’s test. Significance levels are reported as *P < 0.05 and **P < 0.01. (K) Violin plot depicting the amount of autoantibodies against full-length PDIA3 protein using mouse recombinant protein and ELISA assays performed on 1:500 diluted sera collected from control and HFHF mice. Values, from n = 41 (control) and 36 (HFHF) biologically independent replicates, are reported as mean relative abundance. Each dot symbol is an average of technical quadruplicates. Values were statistically analyzed using a two-tailed unpaired Student’s t test. Significance levels are reported as **P < 0.01. (L) Violin plot depicting amounts of autoantibodies against a linear B cell PDIA3 epitope (IFRDGEEAGAYDGPRTADGIVSHLK). ELISA assays were performed on 1:100 diluted sera collected from control and HFHF mice. Values, from n = 10 (control) and 14 (HFHF) biologically independent replicates, are reported as mean relative abundance. Each dot symbol is an average of technical quadruplicates. Values were statistically analyzed using a two-tailed unpaired Student’s t test. Significance levels are reported as P < 0.0001.
Fig. 4.
Fig. 4.. High-fat and high-fructose diet induces liver inflammatory response.
(A) Surface staining of splenocytes, nodal immune cells, and hepatocytes for PDIA3 protein. (B) Normalized MFI of surface PDIA3 expressed on nodal immune cells, splenocytes, pancreatic cells, hepatocytes, liver immune infiltrates, cardiomyocytes, and adipocytes harvested from control and HFHF mice. A statistically significant difference in the PDIA3 HFHF/control ratio was observed. Values, from n = 4 biologically independent replicates, are reported as mean relative expression ± SD. Data were statistically analyzed using a two-tailed paired Student’s t test. Significance levels are reported as *P < 0.05. (C) Sequence of the linear autoantibody epitope (PDIA3 residues 104 to 128) shown in yellow mapped onto a surface representation of the PDIA3-tapasin complex crystal structure PDB.3F8U, with PDIA3 shown in magenta and tapasin shown in gray. (D to K) Livers were harvested from C57BL/6 mice on a regular diet or an HFHF diet for 3 months. Livers were fixed in formalin and stained to detect (D and E) steatosis (oil red staining), (F to I) hepatocyte injury and immune cell infiltration, and (J and K) proliferation. Steatosis, cellular infiltration and proliferation, lobular inflammation, and hepatocyte injury (ballooning) were all significantly up-regulated in HFHF mice as compared with controls. Values, from n = 6 biologically independent replicates, are reported as mean relative expression ± SD and were statistically analyzed using a two-tailed unpaired Student’s t test. (L and M) Increased ALT levels were seen in mice on a 3-month HFHF diet concomitantly with a decreased AST/ALT ratio (<1), which is indicative of NASH. Values from n = 13 biologically independent replicates are shown here, and data were statistically analyzed using a two-tailed unpaired Student’s t test.
Fig. 5.
Fig. 5.. High-fat and high-fructose diet induces PDIA3 antibody–mediated liver damage.
(A) ELISA quantification of antibody response to the PDIA3 peptide in mice at baseline or after 3 months following control or HFHF diet. Values, from n = 10 to n = 13 biologically independent replicates, are reported as mean relative expression ± SD and were statistically analyzed using a one-way ANOVA (α = 0.05) followed by Tukey’s multiple comparison test. Significance levels are reported as ****P < 0.0001. (B) Example of sera titration from one of the samples in (A), diluted 100-, 1000-, and 10,000-fold. (C) PDIA3 titer is reported for n = 9 biologically independent replicates. Data are reported as mean relative expression ± SD and were statistically analyzed using one-way ANOVA (α = 0.05) followed by Tukey’s multiple comparison test. Significance levels are reported as ****P < 0.0001 and ***P < 0.001. Significance levels are reported as **P < 0.01 and ***P < 0.001. (D) Sera from control and HFHF mice were purified on biotin-labeled PDIA3 peptide affinity columns, and the eluate was run on SDS-PAGE gel followed by silver staining. (E) Eluted antibodies were validated by immunoblotting using human recombinant His-tag PDIA3; representative immunoblotting (right) probed with HFHF-eluted antibodies shows the expected 58.5 to 60.0 kDa corresponding to the His-tag PDIA3 loaded at 2 and 5 μg, respectively, on an SDS-PAGE gel; left, Ponceau S staining after transfer. (F) Eluted antibodies were also validated by ELISA against the full-length PDIA3 protein. Values, from n = 4 biologically independent replicates, are reported as mean relative expression ± SD and were statistically analyzed using one-way ANOVA (α = 0.05) followed by Tukey’s multiple comparison test. Significance levels are reported as ****P < 0.0001 for the antibodies purified from sera of control and HFHF mice. (G) Isotype testing was performed on the PDIA3-purified antibody from sera of mice at baseline and after HFHF diet. Data are reported as normalization to the A450 nm reading for each specific isotype control. Mice are color-coded to visualize isotype amount in each mouse. Each dot represents the average of technical quadruplicates, and data are reported for n = 8 biological replicates with significance levels *P < 0.05 and **P < 0.01 (two-way ANOVA and multiple comparisons using Fisher’s LSD test). Applying the unpaired t test retrieved significant difference between the relative abundance of IgM fraction in the sera from control versus HFHF mice (P < 0.05). (H) Representative confocal images of infiltrating PDIA3-specific antibody (Cy5-tagged; yellow) in the liver of control and HFHF mice. Plasma membrane is stained with wheat germ agglutinin–Alexa Fluor 594 (red) and nuclei with DAPI (blue). Confocal images were collected in Z-stack of 5-mm thickness. (I) Representative three-dimensional (3D) view of confocal images of control and HFHF mouse liver collected as in (H). (J) Representative 3D confocal images of infiltrating PDIA3-specific antibody (Cy5-tagged; magenta) in the liver of control and HFHF mice binding to hepatocytes positive for active caspase 3 (green). Confocal images were collected in Z-stack of 5-mm thickness. (K) Fluorescence quantification for the PDIA3-specific antibody (Cy5-tagged; magenta) in the liver of control and HFHF mice after intravenous injection 24 hours before (n = 10 biological replicates). (L) Twenty thousand calcein-labeled liver cells (prepared from control or HFHF mice) were incubated with titrated amounts of the PDIA3 peptide–purified antibodies [as prepared in (C)] and incubated with 1 × 10⁵ nodal cells, also harvested from control and HFHF mice. After 6 hours, cultured cells were washed to eliminate dead cells and the remaining calcein-labeled cells were quantified by fluorescence (490-nm excitation and 520-nm emission filters). Data are reported as percentage of lysed cells. SDS-lysed cells were used as positive control (100% lysis), and untreated cells were used as negative control (no lysis). Values, from n = 10 to n = 14 biologically independent replicates, are reported as mean relative expression ± SD and were statistically analyzed using a two-tailed paired Student’s t test. Each dot symbol is an average of technical quadruplicates, and the data were statistically analyzed using one-way ANOVA and Tukey’s multiple comparisons test. Significance levels are reported as **P < 0.01 and ****P < 0.0001. (M) ALT quantification in control and HFHF sera before and after 24 and 48 hours from the injection of control and HFHF antibody (100 μg per mouse). Data are reported as mean concentration ± SD (normalized to control diet) and were statistically analyzed using a one-way ANOVA test followed by Dunnett’s multiple comparison test. Significance levels are reported as *P < 0.05. (N) Ratio between AST/ALT quantified in control and HFHF sera before and after 24 and 48 hours from the injection of control and HFHF purified antibody (100 μg per mouse). Data are reported as a ratio between the two enzymes, and values were normalized to control diet. Values of n = 5 biologically independent replicate is reported. Significance levels are reported as *P < 0.05.
Fig. 6.
Fig. 6.. High-fat and high-fructose diet induces T cell–mediated liver damage.
(A) MS-based PRM for absolute peptide quantitation and representative ion-extracted chromatogram of the MS1 precursors matching the 2 fmol of spiked heavy peptide DGEEAGAYDGPR[+10]TADG from PDIA3 (in black). The corresponding endogenous light peptides, found in the total peptidomes eluted from the liver immune infiltrates of control and HFHF mice, were coeluted with the spiked heavy standard. The complete transition list associated with the heavy and light (endogenous) peptide is presented in table S3. (B) PRM-derived quantitative analysis of endogenous DGEEAGAYDGPRTADG in the total peptidomes from the liver immune infiltrates of control and HFHF mice. Values, from n = 6 biologically independent replicates, are reported as mean relative expression ± SD and were statistically analyzed using an unpaired Mann-Whitney t test. Significance levels are reported as **P < 0.01. (C) Liver-infiltrating immune cells were cultured in the absence or presence of the PDIA3 peptide (20 μg/ml), and proliferating cells were quantified by 5-bromo-2′-deoxyuridine (BrdU) incorporation. Values, from n = 8 biologically independent replicates, are reported as mean relative expression ± SD and were statistically analyzed using multiple paired Student’s t test and Holm-Šídák method. Applying the unpaired t test retrieved a significant difference (P < 0.05) between the index proliferation of cells from control versus HFHF mice treated with PDIA3 peptide (20 μg/ml). (D and E) Immune infiltrates, separated as in (A), were labeled with CFSE and cultured with the PDIA3 peptide (20 μg/ml) for 3 days. Cells were then stained with CD4, and CFSElowCD4+ cells were quantified. Values, from n = 6 biologically independent replicates, are reported as mean relative expression ± SD and were statistically analyzed using a two-tailed unpaired Student’s t test. Significance levels are reported as **P < 0.01. (F) Total liver cell lysates harvested from control and HFHF mice were analyzed for inflammatory cytokines using the TH17 arrays as described in Materials and Methods. Values, from n = 3 biologically independent replicates, are reported as mean relative expression ± SD and were statistically analyzed using a two-tailed unpaired Student’s t test. Significance levels are reported as *P < 0.05 and **P < 0.01. (G) GZMB quantification by ELISA in liver immune infiltrates of control and HFHF mice prepared as in (E). Values, from n = 3 to n = 4 biologically independent replicates, are reported as mean relative expression ± SD and were statistically analyzed using ANOVA and Tukey’s multiple comparison test. Significance levels are reported as *P < 0.05 and **P < 0.01. (H) ELISPOT assay was performed on a PDIA3-specific T cell line prepared from lymph nodes isolated from HFHF-immunized mice. A statistically significant difference was observed for PDIA3 peptide (1 and 2 μg/ml) as compared with nonspecific hemagglutinin (HA) peptide and media alone. (I) Control and HFHF mice were injected with a CFSE-labeled PDIA3 T cell line; blood, spleen, and liver were harvested 24 hours after injection, and CD4+-CFSE+ cells were quantified. Representative histograms for control and HFHF mice. (J and K) Number of CD4+ CFSE+ cells harvested in each indicated organ from control and HFHF-injected mice. Experiments were performed in both C57BL/6 (K) and RAG2KO (L) mice kept for 3 months on a control or HFHF diet. Values from n = 3 or 4 biologically independent replicates are reported. Data were statistically analyzed by using two-tailed unpaired student’s t test. (L) AST/ALT ratio calculated from the sera of HFHF mice after injection of the PDIA3 T cell line. Data are normalized to control mice also injected with the PDIA3 T cell line. Values of n = 4 biologically independent replicates are reported. Data were statistically analyzed using one-way ANOVA followed by Dunnett’s multiple comparison test. Significance levels are reported as *P < 0.05.
Fig. 7.
Fig. 7.. Elevated anti-PDIA3 autoantibodies in the sera of patients diagnosed with T2D, autoimmune hepatitis, and autoimmune cholangitis.
Sera, collected from 25 healthy age- and sex-matched controls, 48 patients with a diagnosis of T2D, 28 subjects with a diagnosis of AIH, and 18 subjects with PBC, were tested in ELISA against the full-length human PDIA3 protein. Antibody titers were quantified in each subject, and each dot symbol represents the average of three technical replicates. Statistical analysis for each serum and the representative binding curves are presented in fig. S7 and table S7. The statistical significance was determined with one-way ANOVA including mixed-effects model restricted maximum likelihood (REML) followed by multiple comparisons performed with uncorrected Fisher’s LSD test (***P < 0.0001, **P < 0.001, and *P < 0.01). For specificity testing, commercially available polyclonal anti-PDIA3 antibody was used as positive control, whereas PBS buffer served as negative control.

Comment in

References

    1. Ahechu P, Zozaya G, Marti P, Hernandez-Lizoain JL, Baixauli J, Unamuno X, Fruhbeck G, Catalan V, NLRP3 inflammasome: A possible link between obesity-associated low-grade chronic inflammation and colorectal cancer development. Front. Immunol. 9, 2918 (2018). - PMC - PubMed
    1. Hotamisligil GS, Shargill NS, Spiegelman BM, Adipose expression of tumor necrosis factor-alpha: Direct role in obesity-linked insulin resistance. Science 259, 87–91 (1993). - PubMed
    1. Weisberg SP, McCann D, Desai M, Rosenbaum M, Leibel RL, Ferrante AW Jr., Obesity is associated with macrophage accumulation in adipose tissue. J. Clin. Invest. 112, 1796–1808 (2003). - PMC - PubMed
    1. Wu D, Molofsky AB, Liang HE, Ricardo-Gonzalez RR, Jouihan HA, Bando JK, Chawla A, Locksley RM, Eosinophils sustain adipose alternatively activated macrophages associated with glucose homeostasis. Science 332, 243–247 (2011). - PMC - PubMed
    1. Oh DY, Morinaga H, Talukdar S, Bae EJ, Olefsky JM, Increased macrophage migration into adipose tissue in obese mice. Diabetes 61, 346–354 (2012). - PMC - PubMed

Publication types