. 2022 Aug 23;119(34):e2120665119.
doi: 10.1073/pnas.2120665119. Epub 2022 Aug 19.

Turbulence tracks recurrent solutions

Affiliations

Turbulence tracks recurrent solutions

Christopher J Crowley et al. Proc Natl Acad Sci U S A. .

Erratum in

Abstract

Despite a long and rich history of scientific investigation, fluid turbulence remains one of the most challenging problems in science and engineering. One of the key outstanding questions concerns the role of coherent structures that describe frequently observed patterns embedded in turbulence. It has been suggested, but not proved, that coherent structures correspond to unstable, recurrent solutions of the governing equation of fluid dynamics. Here, we present experimental and numerical evidence that three-dimensional turbulent flow tracks, episodically but repeatedly, the spatial and temporal structure of multiple such solutions. Our results provide compelling evidence that coherent structures, grounded in the governing equations, can be harnessed to predict how turbulent flows evolve.

Keywords: coherent structures; nonlinear dynamics; prediction; turbulence.


Conflict of interest statement

The authors declare no competing interest.

Figures

Fig. 1.
Fig. 1.
Turbulence is visualized in a laboratory flow between concentric, independently rotating cylinders with radii ri, ro and corresponding angular velocities Ωi,Ωo. Fluid is confined between the cylinders and bounded axially by end caps corotating with the outer cylinder. The red–white–blue colors indicate the fluid’s deviation from the mean azimuthal velocity component at a fixed axial location equidistant (h/2) from the axial end caps.
Fig. 2.
Fig. 2.
Low-dimensional projections suggest that RPOs, i.e., solutions to the governing equations that recur indefinitely in time, are relevant to turbulence. (A) To demonstrate that RPOs are truly two-tori when rotational symmetry is not reduced, RPO2 is plotted over 80 periods using the coordinates shown, where uθ represents the azimuthal component of the flow velocity and · indicates a spatial average. Thus, uθ is the mean azimuthal speed, and uθsin(θ) [uθcos(θ)] is the imaginary (real) component of the leading spectral mode. (B) Cartoon depicting how a portion of a turbulent trajectory (solid red curve) shadows, i.e., follows, an RPO (light blue surface) for a period of time. Shown in dark blue is the trajectory belonging to the RPO, which is most similar to the turbulent trajectory. The orange arrow relates a point on the turbulent trajectory to the point closest to it on the torus. (C) Using energy E and energy dissipation rate D of the flow as projection coordinates, eight RPOs are represented by closed trajectories (shown in color). RPOs appear as closed curves in this projection because both coordinates are rotationally invariant. The chaotic behavior of turbulence is indicated by the distribution (shown in gray) of visits to particular regions of the projection (darker regions have higher likelihood of visitation).
Fig. 3.
Fig. 3.
Turbulence frequently shadows ECSs. In the graphic, black vertical lines indicate shadowing events—time intervals during which ECSs (RPO1 to RPO8) are being tracked by turbulence obtained from a numerical simulation (Materials and Methods, Shadowing Criteria). The duration of each shadowing event shown is at least one escape time γi1, computed from the unstable Floquet exponents of the corresponding ECS.
Fig. 4.
Fig. 4.
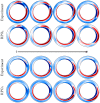
Experimental evidence that turbulence and RPOs, i.e., solutions to the governing equations that recur indefinitely in time, coevolve when our shadowing criteria are met. Turbulence closely follows RPO1 (Top) and, during a different time interval, tracks RPO7 (Bottom). In both cases, the color map shows the deviation in the azimuthal component of the velocity uθ from the mean; moreover, the time interval between successive turbulent snapshots is ∼3.5 s, which may be compared to the period, 52 (44) s, and escape time, 6.6 (9.1) s, of RPO1 (RPO7). The flow fields for the RPOs were chosen by first finding the optimal azimuthal orientation ϕ0 and temporal phase τ0 for the entire shadowing event; subsequently, the RPO was evolved in time while holding the azimuthal orientation fixed [i.e., ϕ(t)=ϕ0 and τ(t)=τ0+t].
Fig. 5.
Fig. 5.
A shadowing event for RPO1 in DNS. The distance metrics Dϕ (above) and Dτ (below) are shown over a time interval including the shadowing event, which corresponds to t/T(0.8,1.8).
Fig. 6.
Fig. 6.
The distance D(t) between a turbulent flow in DNS and RPO7, during an arbitrary interval, computed using the full, 3 dimensional, 3 components (3D-3C) flow field (solid blue) and the 2 dimensional, 2 components (2D-2C) flow field restricted to the midplane z = 0 (dashed red). Both signals were normalized to allow direct comparison. These normalized signals differ by less than 1% relative error over the interval t(0,60), indicating that the 2D-2C distance is a good proxy for 3D-3C distances. Here and in main text, time has been nondimensionalized using the timescale d2/ν, for cylinder gap width d and viscosity ν.
Fig. 7.
Fig. 7.
Turbulent behavior in all three velocity components is indicated by significant energy in a broad range of azimuthal mode numbers, as illustrated by the time-averaged magnitude of the azimuthal spectral coefficients from numerical simulations at Rei=500,Reo=200.
Fig. 8.
Fig. 8.
The distance between the turbulent DNS trajectory and the eight RPOs, computed using the 3D-3C Euclidean norm. Here, Di is the distance to solution ui and Σ is the radius of the chaotic set. The threshold Di/Σ=0.4 below which two flow states are considered close is designated with a dashed black line. While the full dataset spans t[0,60], only a portion of that interval is shown here, to better illustrate the behavior of the distances, Di.

References

    1. Kolmogorov A. N., The local structure of turbulence in incompressible viscous fluid for very large Reynolds numbers. Cr. Acad. Sci. URSS 30, 301–305 (1941).
    1. Taylor G. I., Statistical theory of turbulence. Proc. R. Soc. Lond. Ser. A Math. Phys. Sci. 151, 421–444 (1935).
    1. Schumacher J., et al., Small-scale universality in fluid turbulence. Proc. Natl. Acad. Sci. U.S.A. 111, 10961–10965 (2014). - PMC - PubMed
    1. Moody L. F., Friction factors for pipe flow. Trans. Asme 66, 671–684 (1944).
    1. Smits A. J., McKeon B. J., Marusic I., High–Reynolds number wall turbulence. Annu. Rev. Fluid Mech. 43, 353–375 (2011).

LinkOut - more resources