. 2022 Dec 1;140(22):2358-2370.
doi: 10.1182/blood.2022015668.

Noncanonical EZH2 drives retinoic acid resistance of variant acute promyelocytic leukemias

Affiliations

Noncanonical EZH2 drives retinoic acid resistance of variant acute promyelocytic leukemias

Mathilde Poplineau et al. Blood. .

Abstract

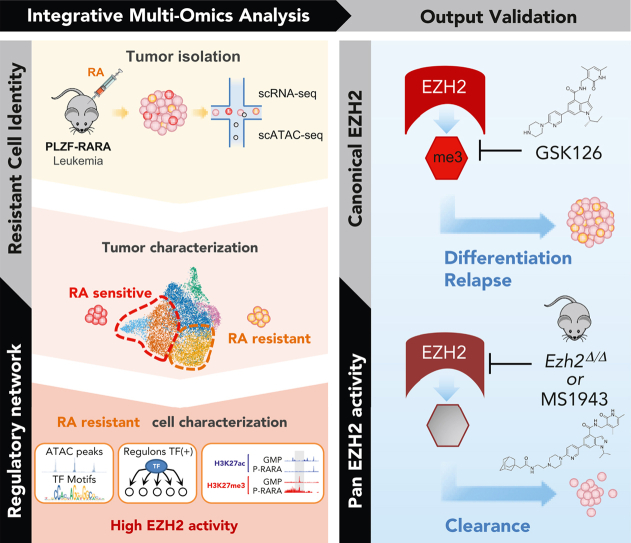
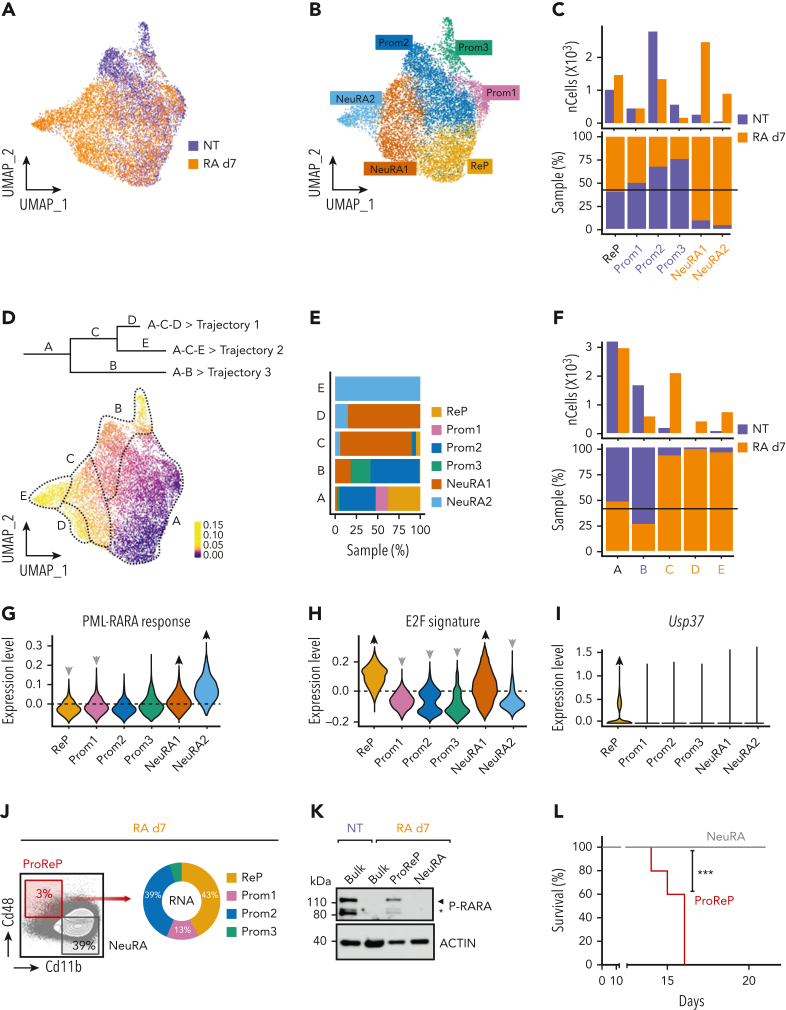
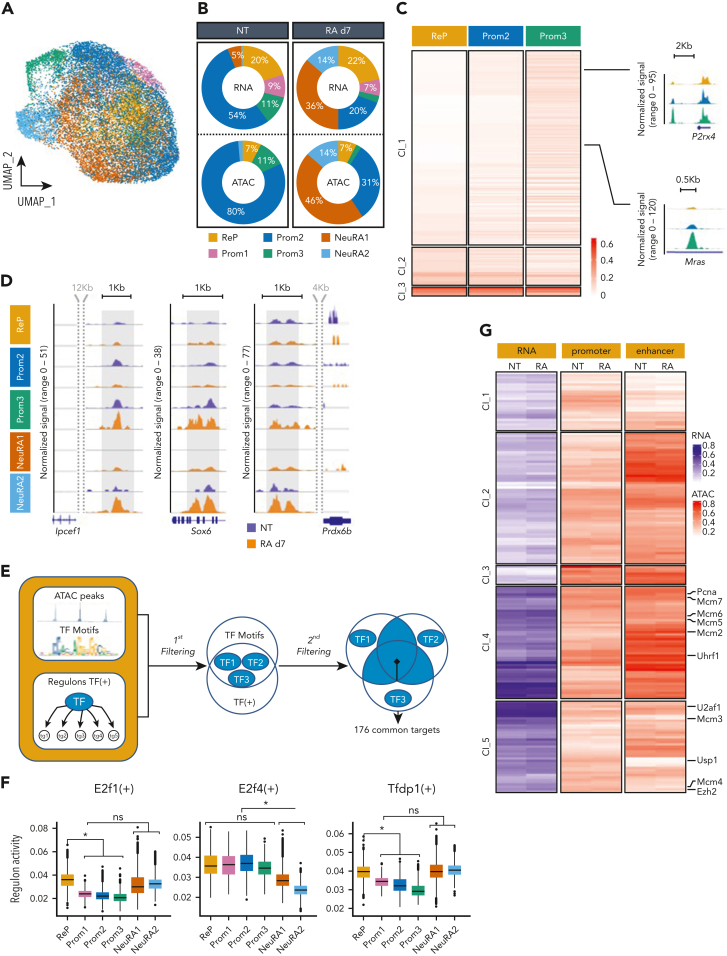
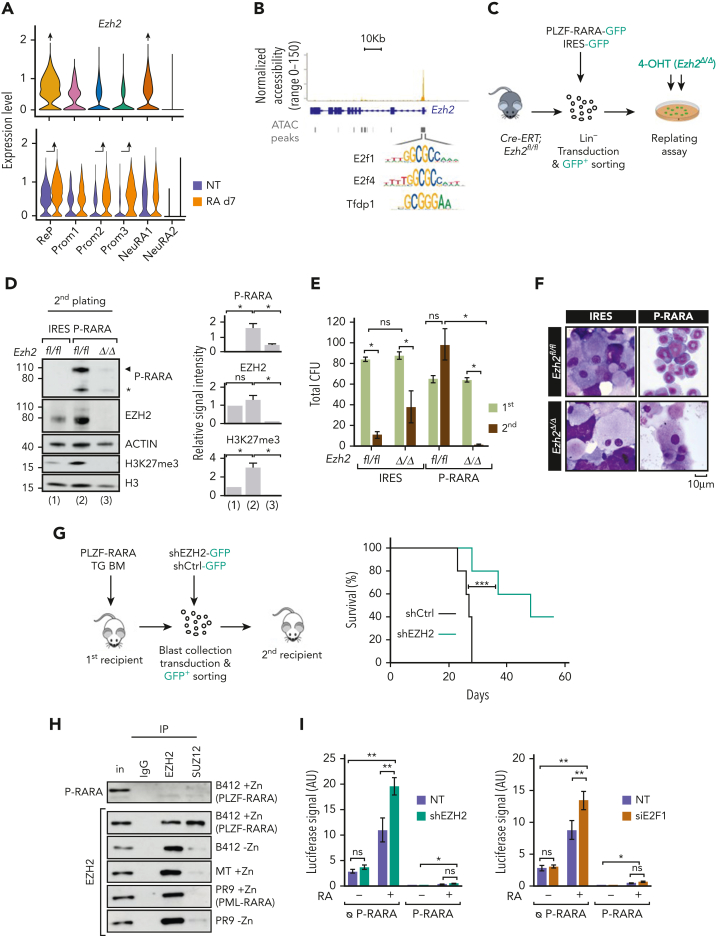
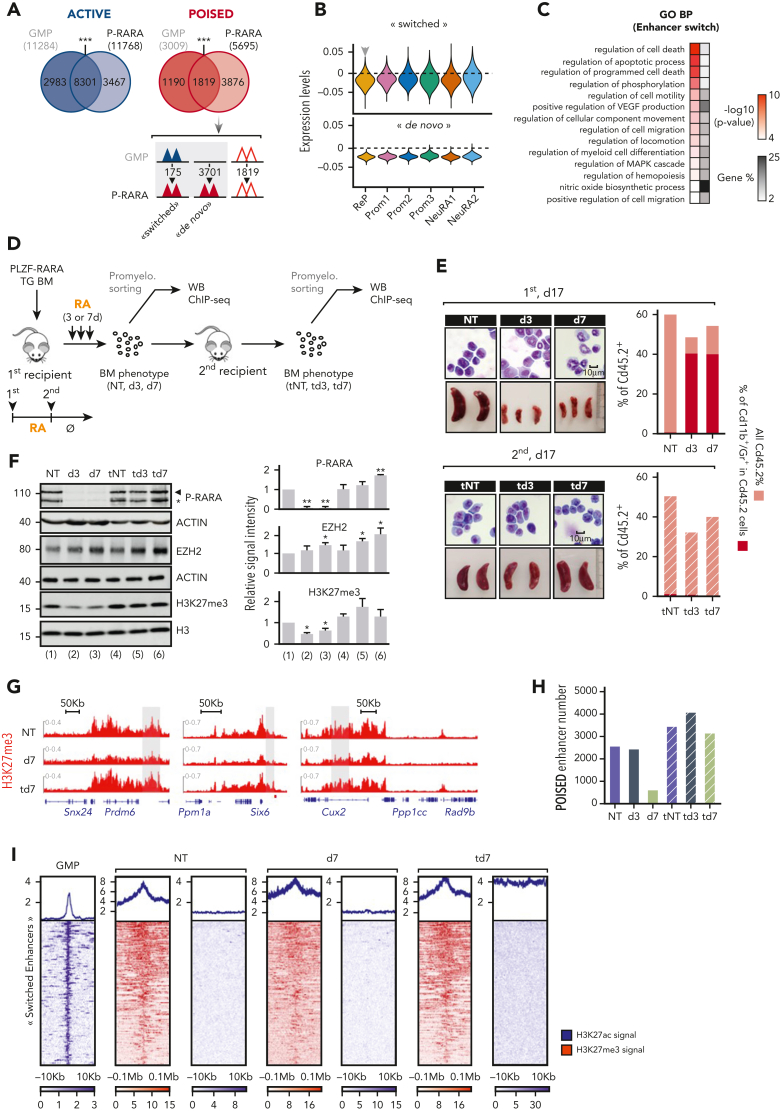
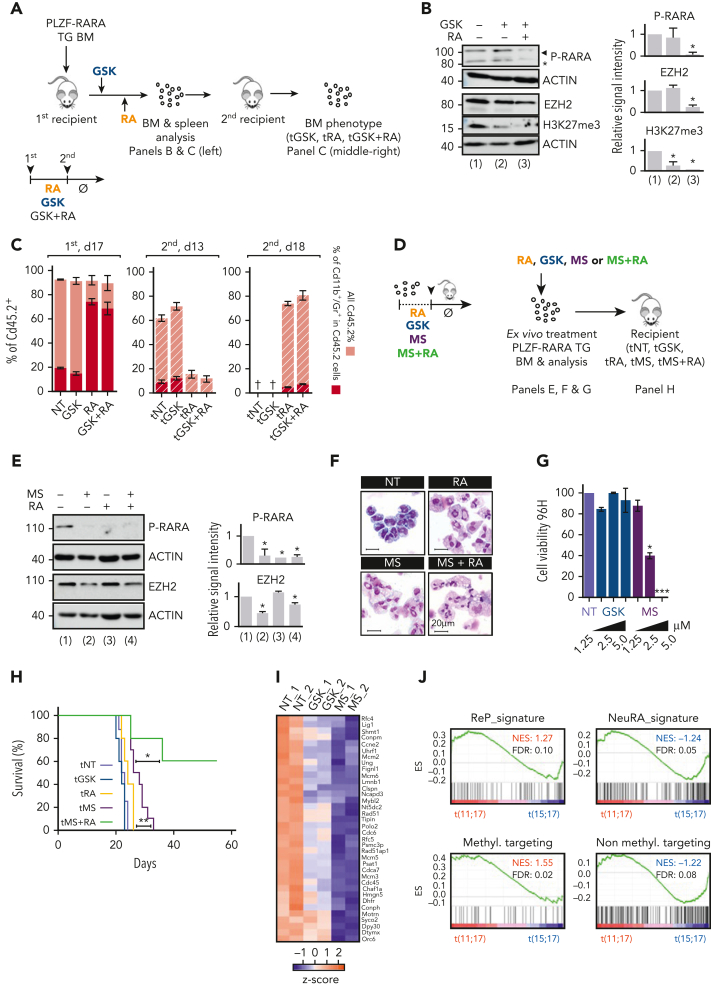
Cancer cell heterogeneity is a major driver of therapy resistance. To characterize resistant cells and their vulnerabilities, we studied the PLZF-RARA variant of acute promyelocytic leukemia, resistant to retinoic acid (RA), using single-cell multiomics. We uncovered transcriptional and chromatin heterogeneity in leukemia cells. We identified a subset of cells resistant to RA with proliferation, DNA replication, and repair signatures that depend on a fine-tuned E2F transcriptional network targeting the epigenetic regulator enhancer of zeste homolog 2 (EZH2). Epigenomic and functional analyses validated the driver role of EZH2 in RA resistance. Targeting pan-EZH2 activities (canonical/noncanonical) was necessary to eliminate leukemia relapse-initiating cells, which underlies a dependency of resistant cells on an EZH2 noncanonical activity and the necessity to degrade EZH2 to overcome resistance. Our study provides critical insights into the mechanisms of RA resistance that allow us to eliminate treatment-resistant leukemia cells by targeting EZH2, thus highlighting a potential targeted therapy approach. Beyond RA resistance and acute promyelocytic leukemia context, our study also demonstrates the power of single-cell multiomics to identify, characterize, and clear therapy-resistant cells.


Conflict of interest statement

Conflict-of-interest disclosure: The authors declare no competing financial interests.

Figures

None
Graphical abstract
Figure 1.
Figure 1.
Single-cell transcriptome analysis identifies a subset of RA-resistant PLZF-RARA leukemic cells with a specific signature. (A-B) Uniform Manifold Approximation and Projection (UMAP) visualization of the scRNA-seq data set colored by (A) condition (NT and RA day 7 [d7]) and by (B) cluster (total integrated cells: 11 900). Six clusters were identified: ReP, DNA repair/Replication/Proliferation; Prom1-3, Promyelocyte (Neutrophil) 1-3; NeuRA1-2, Neutrophil RA1-2. (C) (Bottom) NT and RA cell distribution in each cluster. The black line indicates expected NT and RA cell proportions according to the data set size. (Top) Absolute cell number per cluster and per condition. Names of the clusters for which the proportion of NT or RA cells is significantly higher than expected (P < .01) are purple for NT cells and orange for RA cells. (D) Differentiation trajectory. (Top) Schematic representation of the different states (A-E) in each trajectory (trajectory 1: A-C-D, trajectory 2: A-C-E, trajectory 3: A-B). (Bottom) UMAP is colored according to the pseudotime value of each cell. (E) Cluster distribution in each state of the pseudotime. (F) NT and RA cell distribution (bottom: percentage; top: absolute) in each state of the pseudotime. (C and F) Names of the clusters for which the proportion of NT or RA cells was significantly higher than expected (P < .01) are purple for NT cells and orange for RA cells. (G) Violin plots showing PML-RARA response and (H) E2f signature scores in each cluster. (G and H) The signature score represents the global expression of annotated genes for the selected signature. Gray/black arrows pointing down/up: significant lower/higher expression in the cluster against all the others (average score difference > 0.02 and adjusted P < .05). (I) Violin plot showing Usp37 expression in each cluster. Black arrows pointing up: significant higher expression in the cluster against all the others (average log2|FC|> .1 and adjusted P < .05). (J) Gating strategy for isolating ProReP cells (Prom1-3 and ReP) and NeuRA (NeuRA1-2). The donut plot represents the proportion of Prom1-3 and ReP cells into the ProReP population according to the scRNA-seq analysis. (K) PLZF-RARA (black arrow: full length; black star: degraded form) levels in untreated (NT) and treated promyelocytes (RA d7). Actin is used as loading control. (L) Survival rate of mice transplanted with ProReP or NeuRA cells. Each cohort contains at least 5 mice. ∗∗∗P < .001.
Figure 2.
Figure 2.
Single-cell integrative multiomics analysis highlights chromatin genes as responsible for RA resistance in PLZF-RARA–expressing cells. (A) UMAP visualization of integrated scRNA-seq (11 900 cells) and scATAC-seq (7367 cells) data set colored by cluster. (B) Donut plots showing the distribution of scRNA- and scATAC-seq cells in each cluster for NT and RA d7 conditions. (C) (Left) Heat map showing the ATAC signal in the NT condition on the differentially accessible peaks between ReP and Prom2-3 clusters. Hierarchical clustering is done according to the ReP data set. (Right) Coverage plot of ATAC signal at selected genes. (D) Coverage plot of ATAC signal per condition in each cluster associated with Ipcef1, Sox6, and Prdx6b genes. (E) Computational scheme to identify key regulon targets in the ReP cluster. The first filtering consists to select TFs with high activity in the ReP cluster by considering the accessibility of their DNA motifs in this cluster. TF motif accessibility scores are calculated with Signac, and TF motif markers are identified for each cluster (supplemental Table 2A). Selected ReP TFs are cross-referenced with master transcriptional regulators identified from scRNA-seq data using SCENIC (supplemental Table 2B). After this filtering, 3 TFs remain. Target genes shared at least by 2 TFs are taken into account for further filtering (second filtering). Target genes considered are: (i) found in all pySCENIC run, (ii) linked with positive regulons, and (iii) filtered based on the sum of normalized importance (>0.35). One hundred seventy-six genes are conserved (supplemental Table 3). (F) Box plots showing E2f1, E2f4, and Tfdp1 (TFs obtained after the first filtering) regulon activity in each cluster. ∗P < .05. (G) Heat map showing the mRNA expression (left), the promoter accessibility (middle, ±3 kb from the TSS), and the enhancer accessibility (right, ±50 kb from the TSS minus the ±3-kb promoter region) of the 176 target genes in the ReP cluster (obtained after the second filtering). Results are expressed as normalized log (mean gene activity). Hierarchical clustering is done according to the NT data set.
Figure 3.
Figure 3.
EZH2 relevance in PLZF-RARA APL. (A) Violin plot showing Ezh2 expression per cluster (top) and in NT or RA-treated cell conditions per cluster (bottom). The black arrow pointing up indicate significant higher expression in the cluster against all the other clusters (average log2|FC| > .25 and adjusted P < .05). (B) Coverage plot of ATAC signal on Ezh2 gene in the ReP cluster. E2f1, E2f4, and Tfdp1 motifs are detected under the highlighted peak. (C) Experimental scheme to ascertain whether Ezh2 activity is required for PLZF-RARA transformation. Lineage negative (Lin) cells purified from Cre-ERT;Ezh2fl/fl are purified and transduced with an empty-IRES-GFP (IRES) or a PLZF-RARA-IRES-GFP (P-RARA) retroviral construct. Lin green fluorescent protein (GFP)–positive cells are purified by FACS and Ezh2 deletion in Lin-GFP positive cells is obtained by adding 150 nM 4-hydroxytamoxifen (4-OHT) in the methylcellulose. (D) (Left) Global levels of PLZF-RARA (black arrow: full length, black star: degraded form), Ezh2 and H3K27me3 detected by western blotting after 4-OHT-induced Ezh2 deletion in the second round of plating. Actin and H3 are used as loading controls. (Right) Bar plots representing the signal intensity of PLZF-RARA (P-RARA), EZH2, and H3K27me3 normalized to the loading control (for P-RARA) and to the IRES condition (for EZH2 and H3K27me3). ns, not significant. ∗P < .05 (2 replicates). (E) Replating efficiency is monitored by counting the total colony-forming units (CFU) of nontransformed (IRES) and PLZF-RARA–transformed (P-RARA) cells in presence (fl/fl) or absence (Δ/Δ) of Ezh2. Results are expressed as a mean standard deviation of 3 experiments (n = 3). ∗P < .05. (F) Cell morphology of P-RARA or IRES-transduced cells in presence (fl/fl) or absence (Δ/Δ) of Ezh2. Representative colonies of indicated conditions after 2 rounds of plating. Cells are cytospun and observed after May-Grünwald Giemsa (MGG) staining. Magnification 64×; bar 10 μm. (G) (Left) Experimental scheme to ascertain whether Ezh2 activity is required for PLZF-RARA leukemia development in vivo. PLZF-RARA TG BM is transduced with an shCtrl-GFP or an shEZH2-GFP retroviral construct. GFP-positive cells are purified by FACS and reinjected into recipient mice. (Right) Survival rate of mice transplanted with shCtrl (gray curve) or shEZH2 cells (green curve). Each cohort contains 5 mice. ∗∗∗P < .001. (H) Nuclear extracts of U937 cells treated or not with ZnSO4 (Zn) immunoprecipitated with anti-immunoglobulin G, anti-EZH2, or anti-SUZ12 antibodies. Immunoprecipitations (IPs) are immunoblotted with anti-PLZF (top) or anti-EZH2 antibodies (bottom). Inputs (in) represent 2% of samples processed in each IP. U937 B412: PLZF-RARA Zn-inducible; U937 MT: parental cells; U937 PR9: PML-RARA Zn-inducible. (I) Relative luciferase intensity monitored in HEK293T transduced or not (NT) with a shEZH2 (left) or transfected with a siE2F1 or siCtrl (NT) (right). Cells were transfected with the RARE-Luc and with a GFP (ᴓ P-RARA) or PLZF-RARA (P-RARA) construct. Cells are treated or not for 48 hours with RA (1 μM). AU, arbitrary units. ∗P < .05, ∗∗P < .01 (n = 6).
Figure 4.
Figure 4.
PLZF-RARA-induced H3K27me3 level at specific enhancers genes that marks RA relapse-initiating cells. (A) Enhancer distribution in PLZF-RARA promyelocytes and normal GMPs. Overlap of Active (left) and Poised enhancers (right) in GMP and PLZF-RARA (P-RARA) conditions. ∗∗∗P < .001. The Poised enhancer dynamics upon PLZF-RARA expression is schematized below. Triangles represent enhancers; colors indicate their activity (Active: blue, Poised: red). Empty triangles: no change in enhancer activity between the 2 conditions. (B) Violin plots showing “switched” and “de novo” Poised signature scores per cluster. Signature score represents the global expression of annotated genes for the signature identified by scRNA-seq. Gray arrow pointing down: significantly lower expression in the cluster against all the others (average score difference > 0.005 and adjusted P < .05). (C) GO analysis of enhancer nearby genes. Gene %, number of genes observed/total number of genes within each GO term, BP, biological processes. (D) Experimental scheme to assess chromatin events associated with RA resistance. PLZF-RARA TG BM is transplanted into recipient mice. Ten days after, mice are injected with corn oil (NT) or with RA for 3 or 7 days (d3 and d7) and sacrificed. Treated BMs are immunophenotyped and reinjected into new recipient mice (tNT, td3, td7). Secondary transplanted mice are not treated (Ø) and sacrificed at day 17 posttransplantation. (E) Leukemia evolution analyzed by MGG staining (magnification 64×), spleen size (bar in centimeter), and FACS (Cd45.2, Cd11b, and Gr1 are monitored). (Top) Impact of RA on PLZF-RARA leukemia (NT, d3, d7). (Bottom) Leukemia relapse evaluation of transplanted untreated (tNT) and RA-treated BM (td3, td7). (F) (Left) Global levels of PLZF-RARA (black arrow: full length, black star: degraded form), EZH2, and H3K27me3. Actin and H3 are used as loading controls. Signal intensity is normalized according to the loading control and to the NT. (Right) Bar plots representing the signal intensity of PLZF-RARA (P-RARA), EZH2, and H3K27me3 normalized to the loading control and to the NT condition. ∗P < .05, ∗∗P < .01 (2 biological replicates). (G) Representative integrative genomics viewer (IGV) tracks of H3K27me3 in NT, d7, and td7 conditions. The gray box underlines enhancer coordinates. (H) Total number of poised enhancers in each condition. (I) Plot heat map of H3K27ac (blue) and H3K27me3 (red) signals in GMP, NT, d7, and td7 conditions at switched enhancers. Signals are plotted 10 Kb (for H3K27ac) and 0.1 Mb (for H3K27me3) upstream and downstream the enhancer center.
Figure 5.
Figure 5.
Impact of targeting EZH2 on APL progression. (A) Experimental scheme of the analysis of RA, GSK, or combination-treated BM. PLZF-RARA TG BM is transplanted into recipient mice. Seven days after, mice are injected for 3 days with GSK or with corn oil (NT) followed by 7 consecutive days of RA (RA). After treatments (NT: corn oil, GSK, RA, GSK and RA) mice are sacrificed, and treated BM are immunophenotyped and reinjected into new recipient mice (tNT, tGSK, tRA, tGSK+RA). At this time treatments are stopped (Ø). Mice are sacrificed 15 to 20 days after the secondary transplantation. (B) (Left) Global levels of PLZF-RARA (black arrow: full length, black star: degraded form), Ezh2, and H3K27me3. Actin is used as loading control. (Right) Bar plots representing the signal intensity of PLZF-RARA (P-RARA), EZH2, and H3K27me3 normalized to the loading control and to the NT condition. ∗P < .05 (3 biological replicates). (C) (Left) Impact of GSK, RA, and combo treatments on PLZF-RARA leukemia at day 17 after the first transplantation (NT, GSK, RA, GSK+RA). (Middle and right) Evaluation of leukemia relapse monitored by FACS analysis (Cd45.2, Cd11b, and Gr1 markers are monitored) at day 13 (d13) and day 18 (d18) after the secondary transplantation (tNT, tGSK, tRA, tGSK+RA). (D) Scheme resuming the protocol to evaluate the effect of MS treatment on PLZF-RARA BM. (E) (Left) Global levels of PLZF-RARA and Ezh2 after RA (0.1 μM) and/or MS (1.25 μM) treatments. Actin is used as loading controls. (Right) Bar plots representing the signal intensity of PLZF-RARA (P-RARA) and EZH2 normalized to the loading control and to the NT condition. ∗P < .05 (2 biological replicates). (F) Cell morphology analyzed by MGG staining (magnification 64×; bar 20 μm). (G) Cell viability of PLZF-RARA TG cells upon GSK or MS treatments monitored by bioluminescence. Results are expressed by percent of living cells and normalized to the untreated condition (NT). Results are expressed as the mean standard deviation of 3 independent experiments (n = 3). ∗P < .05, ∗∗∗P < .001. (H) Survival rate of mice transplanted with untreated (tNT, gray curve, 8 mice) GSK (tGSK, 2.5 μM, blue curve, 5 mice), RA (tRA, 0.1 μM, 5 mice), MS (tMS, 2.5 μM, purple curve, 10 mice), MS and RA (tMS+RA, 1.25 μM MS and 0.1 μM RA, green curve, 5 mice) pretreated PLZF-RARA TG BM. ∗P < .05, ∗∗P < .01. (I) RNA-seq (2 biological replicates) performed on promyelocytes purified from PLZF-RARA TG mice and treated or not (NT) with MS (MS, 2.5 μM), or GSK (2.5 μM) (in vitro treatments). Impact of MS (MS) and GSK on the expression of the most differentially overexpressed genes in the ReP cluster compared with the other clusters. Results are expressed as gene counts z score. (J) Gene set enrichment analysis of t(11;17) APL patients (PLZF-RARA) compared with t(15;17) APL patients (PML-RARA). ReP, NeuRA, the targeting of nonmethyltransferase activities of EZH2 (Non methyl.targeting) and the targeting of methyltransferase activities of EZH2 (Methyl. targeting) enrichment signatures (ESs) are computed. FDR, false discovery rate; NES, normalized enrichment score.

Comment in

  • APL: Nemo finds its sea anemone.
    Wang QF, Zhu HH. Wang QF, et al. Blood. 2022 Dec 1;140(22):2311-2312. doi: 10.1182/blood.2022018020. Blood. 2022. PMID: 36454593 No abstract available.

Similar articles

Cited by

References

    1. Dos Santos GA, Kats L, Pandolfi PP. Synergy against PML-RARa: targeting transcription, proteolysis, differentiation, and self-renewal in acute promyelocytic leukemia. J Exp Med. 2013;210(13):2793–2802. - PMC - PubMed
    1. Di Croce L. Chromatin modifying activity of leukaemia associated fusion proteins. Hum Mol Genet. 2005;14(Spec No 1):R77–R84. - PubMed
    1. Grignani F, De Matteis S, Nervi C, et al. Fusion proteins of the retinoic acid receptor-alpha recruit histone deacetylase in promyelocytic leukaemia. Nature. 1998;391(6669):815–818. - PubMed
    1. Huang ME, Ye YC, Chen SR, et al. Use of all-trans retinoic acid in the treatment of acute promyelocytic leukemia. Blood. 1988;72(2):567–572. - PubMed
    1. de The H, Chen Z. Acute promyelocytic leukaemia: novel insights into the mechanisms of cure. Nat Rev Cancer. 2010;10(11):775–783. - PubMed

Publication types

MeSH terms