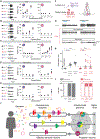
. 2022 Aug 18;185(17):3104-3123.e28.
doi: 10.1016/j.cell.2022.07.024.

Non-canonical odor coding in the mosquito

Affiliations

Non-canonical odor coding in the mosquito

Margaret Herre et al. Cell. .

Abstract

Aedes aegypti mosquitoes are a persistent human foe, transmitting arboviruses including dengue when they feed on human blood. Mosquitoes are intensely attracted to body odor and carbon dioxide, which they detect using ionotropic chemosensory receptors encoded by three large multi-gene families. Genetic mutations that disrupt the olfactory system have modest effects on human attraction, suggesting redundancy in odor coding. The canonical view is that olfactory sensory neurons each express a single chemosensory receptor that defines its ligand selectivity. We discovered that Ae. aegypti uses a different organizational principle, with many neurons co-expressing multiple chemosensory receptor genes. In vivo electrophysiology demonstrates that the broad ligand-sensitivity of mosquito olfactory neurons depends on this non-canonical co-expression. The redundancy afforded by an olfactory system in which neurons co-express multiple chemosensory receptors may increase the robustness of the mosquito olfactory system and explain our long-standing inability to disrupt the detection of humans by mosquitoes.

Keywords: Aedes aegypti; mosquito; odor coding; olfaction; snRNA-seq.


Conflict of interest statement

Declaration of interests The authors declare no competing interests.

Figures

Figure 1.
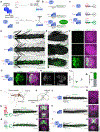
Figure 1.. Mismatch in chemosensory receptor and olfactory glomerulus number
(A) Ae. aegypti female sensory structures (yellow boxes). (B) Approximate number of antennal lobe glomeruli per left brain hemisphere innervated by the indicated sensory structure, quantified from 12 brains in (I–J) and Figure S1, S2, and S3. (C and D) Cartoons of insect chemosensory gene families (C) and canonical olfactory system organization (D). (E–G) Stacked bar plots of chemosensory gene number in the Ae. aegypti genome (E), and number expressed above indicated TPM thresholds in antenna (F) and maxillary palp (G). (H) Two models of non-canonical olfactory system organization. (I) Maximum-intensity projections of confocal z stacks of left antennal lobes of the indicated genotype with immunofluorescent labeling of GFP (green) and the nc82 monoclonal antibody, which recognizes the synaptic marker Brp (magenta). Scale bar: 50 μm. Orientation: d, dorsal; m, medial. (J) 2D representation of the boundary of each glomerulus in (I) that is GFP positive or GFP negative. See also Figures S1, S2, and S3. (K) Cartoon of antennal lobe regions receiving projections from OSNs expressing the indicated chemosensory receptor.
Figure 2.
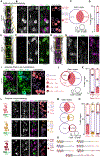
Figure 2.. Genetic evidence for widespread Orco and Ir25a co-expression
(A) Schematic of the Split-QF2 system (left) and Orco and Ir25a gene loci with exons (gray boxes), introns (gray lines) and CRISPR-Cas9 gRNA site (arrowhead) used to insert T2A-QF2-AD (light blue) and T2A-QF2-DBD (medium blue). AD and DBD gene maps are not to scale. (B and C) Schematic of Split-QF2 system (B) and gene expression in indicated genotypes (C). (D and E) Maximum-intensity projections of confocal z stacks of female antennae (D) and female maxillary palps (E) of indicated genotypes showing intrinsic dTomato fluorescence, transmitted light overlay. See also Figure S4. (F and G) Maximum-intensity projections of confocal z stacks of antennal lobes from the indicated genotype with immunofluorescent labeling of dTomato (green) and Brp (magenta). See also Figure S4. (H and I) 2D representation of each glomerulus in (G) that is GFP positive or GFP negative (H) and quantification (I). Data are mean ± SEM, n = 3. See also Figure S4A. (J) Ae. aegypti male with sensory structures (arrows). (K) Cartoon of the brain including antennal lobe glomeruli and suboesophageal zone. (L–U) Maximum-intensity projections of confocal z stacks of male antennae (L, N, P, R, and T) and male brains (M, O, Q, S, and U) of the indicated genotype with immunofluorescent labeling of dTomato (green) and Brp (magenta). Scale bars: 50 μm. Orientation: proximal left (D, E, L, N, P, R, and T), medial left (F and G); d, dorsal; v, ventral; m, medial.
Figure 3.
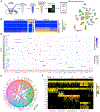
Figure 3.. Extensive chemosensory co-receptor co-expression in the antenna
(A) Maximum-intensity projection of whole-mount wild-type female antennae with immunofluorescent labeling of Orco and Ir25a. (B) Enlarged view of the yellow rectangle in (A) with cartoon indicating cell identity (right). (C and D) Quantification of wild-type antennal cells expressing Orco and Ir25a presented as Euler diagrams with area scaled to mean cells/region (C) and stacked bar plots (D). Data are mean ± SEM, n = 7 antennal segments, 48–61 cells/region. (E and G) Maximum-intensity projection of whole-mount Orco16/16 mutant (E) and Ir25aBamHI/BamHI mutant (G) female antennae with immunofluorescent labeling of Orco and Ir25a. (F and H) Enlarged view of the yellow rectangles in (E and G). (I) RNA in situ hybridization in wild-type antennae. Probes indicated. (J and K) Euler plots of wild-type antennal cells expressing the indicated genes with area scaled to mean cells/region (J) and stacked bar plots (K). Data are mean ± SEM, n = 4 antennal segments, 45–63 cells/region. (L) Maximum-intensity projection of whole-mount Orco and GFP immunofluorescence in female antennae of the indicated genotypes with cartoon schematic indicating cell identity (right). (M and N) Euler plots of antennal cells of the indicated genotypes co-expressing Orco protein and GFP, area scaled to mean cells/region (M) and stacked bar plots (N). Data are mean ± SEM, n = 6–8 antennal segments, 34–68 cells/region. (O) Cartoon schematic of OSN populations identified in this figure. Scale bars: 10 μm.
Figure 4.
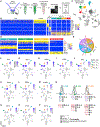
Figure 4.. Antennal snRNA-seq reveals complex chemosensory receptor co-expression
(A) Female antenna snRNA-seq workflow. (B) Heatmap of antenna cells within clusters that express cell-type markers according to normalized expression (unit for normalized expression in antenna data is ln(sctransform-adjusted UMI), see STAR Methods) (see Figure S5H). (C) t-distributed stochastic neighbor embedding (t-SNE) plot of antennal neurons annotated by cluster (see Figure S5I). (D) Dot plot illustrating mean scaled expression (Z score) of chemosensory receptor expression within each cluster. Note that presence of two chemoreceptor genes expressed in the same cluster does not always indicate that they are co-expressing in the same cells (see Figures S5L-S5M and S6A). Clusters marked with an asterisk exhibit co-clustering without co-expression of some or all of illustrated genes. Genes marked with a triangle may be lower- or sparsely expressed genes that exhibited specific expression to that cluster, but may have not met our defined criteria for expression or co-expression. (E) Chord plot of co-expressed pairs of chemosensory receptors that meet co-expression criteria for ligand-specific receptors: both genes present in over 10 cells at a sctransform-adjusted UMI value of 2 or greater. (For non-sctransform-adjusted UMIs, see Figure S5J.) Note: normalized expression value of 1 corresponds to sctransform-adjusted UMI of 2 or greater. (F) Heatmap of all cells within neuron population expressing Or82 above a normalized expression value of 1. Receptors are indicated in rows and cells indicated in columns. Cluster assignment of cells indicated above heatmap. “Others” denotes small groups of cells that belonged to 12 other clusters apart from the ones labeled. nompC included for non-quantitative reference of potential background signal. Heatmap colors represent normalized expression. Visually identified cell types are offset with brackets listing the chemosensory receptors expressed in that cell type. See also Figures S5 and S6.
Figure 5.
Figure 5.. Coordinated co-expression of chemosensory receptors in the maxillary palp
(A) Maxillary palp capitate-peg sensillum with A, B, and C cells. (B) Maxillary palp expression of Orco in the fourth maxillary palp segment revealed by whole-mount RNA in situ hybridization. Orientation: proximal up. (C) Maxillary palp (green) and three glomeruli that it innervates. (D) 3D antennal lobe reconstruction. (E–J) Single confocal sections through the center of Glomerulus 1 (top) or Glomerulus 2 and 3 (bottom) in left antennal lobes of the indicated genotypes. Sections are taken from z stacks in Figure 2G (E) and Figure 1I (F–J). (K) Schematic of sensory neuron gene expression and glomerular convergence based on (E–J). (L–P) Whole-mount maxillary palp RNA in situ hybridization with indicated probes, cartoon schematic indicating cell identity, and quantification of co-expression shown as Euler diagrams, area scaled to mean. n = 5 maxillary palps, 26–65 cells/dorso-lateral maxillary palp. See also Figure S3. Scale bars: 50 μm (B), 25 μm (E–J and L–P). Orientation: d, dorsal; m, medial; p, posterior.
Figure 6.
Figure 6.. Maxillary palp snRNA-seq reveals unanticipated neuronal complexity
(A) Female maxillary palp snRNA-seq workflow. (B) Heatmap of cells in the antenna within clusters that express cell type markers according to normalized expression (unit for normalized expression in maxillary palp data is ln(UMI of gene*10,000/total UMI of cell+1)) (see Figure S7E). (C) t-SNE plot of maxillary palp nuclei. Identified neuron clusters (1–4) are labeled with color (see Figures S7F and S7G). (D) Heatmap of normalized expression of selected genes in four identified neuron clusters. See also Figure S7E. (E) Chord plot of chemosensory receptors (excluding Orco, Ir25a, and Gr3) for which there are at least 10 cells of both genes above a normalized expression value of 1. (F–P) Normalized expression (ln(UMI of gene*10,000/total UMI of cell+1)) of indicated chemoreceptor genes mapped onto t-SNE plots. (Q) Summary of chemosensory receptor expression in the maxillary palp based on all experimental data in this study (RNA FISH, fluorescent RNA in situ hybridization).
Figure 7.
Figure 7.. Functional consequences of chemosensory receptor co-expression
(A–E) Left, sample traces from maxillary palp single sensillum recordings in indicated genotypes for (A) CO2, (B) acetone, (C) 1-octen-3-ol, (D) hexyl amine, and (E) triethyl amine. Stimulus delivery: cyan bar. Middle and right, spikes/sec in the A cell (middle) and B cell (right) for indicated concentration of the stimulus. Data are mean ± SEM, n = 4–16 recordings from separate sensilla. (F) Schematic of an individual sensillum and receptor odorant pairings for the B neuron. The identity of the ligand-selective IrX subunit is unknown. (G) Sample traces for +/+LVP (top) and Ir25aBamHI/BamHI (bottom) with each indicated stimulus. Stimulus delivery: cyan bar. (H and I) Dot plots (H) and stacked bar plots (I) showing the percent of total recordings from each genotype that responded to the stimulus (filled circles) and those that did not (open circles), with 30 spikes/s defined as response threshold. Data are mean ± SEM, n = 17 (+/+LVP) and n = 23 Ir25aBamHI/BamHI recordings from separate sensilla; n.s., not significant (p = 0.1453 for hexyl amine and p = 0.1642 for triethyl amine), ****p < 0.0001, one-way ANOVA with Kruskal-Wallis test for multiple comparisons. (J) A revised model of chemosensory coding in Ae. aegypti based on this study.

Comment in

References

    1. Abuin L, Bargeton B, Ulbrich MH, Isacoff EY, Kellenberger S, and Benton R (2011). Functional architecture of olfactory ionotropic glutamate receptors. Neuron 69, 44–60. 10.1016/j.neuron.2010.11.042. - DOI - PMC - PubMed
    1. Acree F Jr., Turner RB, Gouck HK, Beroza M, and Smith N (1968). L-Lactic acid: a mosquito attractant isolated from humans. Science 161, 1346–1347. 10.1126/science.161.3848.1346. - DOI - PubMed
    1. Allan SA, Day JF, and Edman JD (1987). Visual ecology of biting flies. Annu. Rev. Entomol 32, 297–314. 10.1146/annurev.en.32.010187.001501. - DOI - PubMed
    1. Bashkirova E, and Lomvardas S (2019). Olfactory receptor genes make the case for inter-chromosomal interactions. Curr. Opin. Genet. Dev 55, 106–113. 10.1016/j.gde.2019.07.004. - DOI - PMC - PubMed
    1. Basrur NS, De Obaldia ME, Morita T, Herre M, von Heynitz RK, Tsitohay YN, and Vosshall LB (2020). Fruitless mutant male mosquitoes gain attraction to human odor. Elife 9, e63982. 10.7554/elife.63982. - DOI - PMC - PubMed

Publication types