. 2022 Aug 18;185(17):3201-3213.e19.
doi: 10.1016/j.cell.2022.07.010.

Structure of a fully assembled tumor-specific T cell receptor ligated by pMHC

Affiliations

Structure of a fully assembled tumor-specific T cell receptor ligated by pMHC

Lukas Sušac et al. Cell. .

Abstract

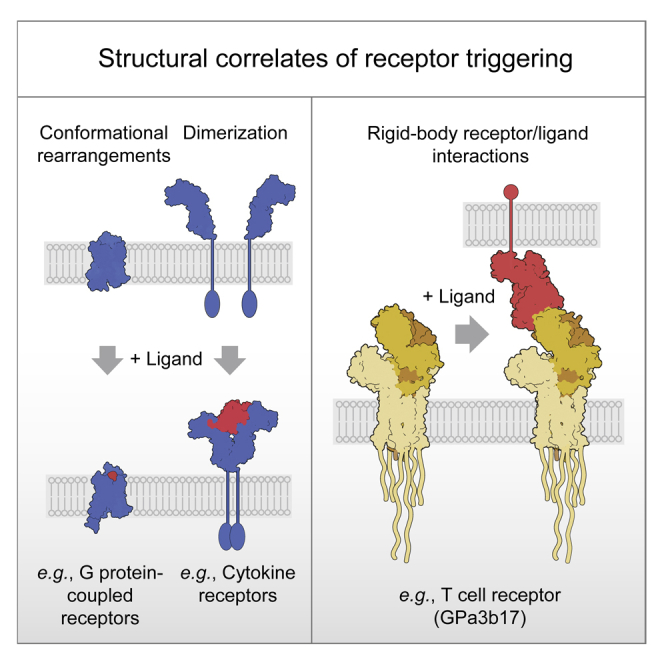
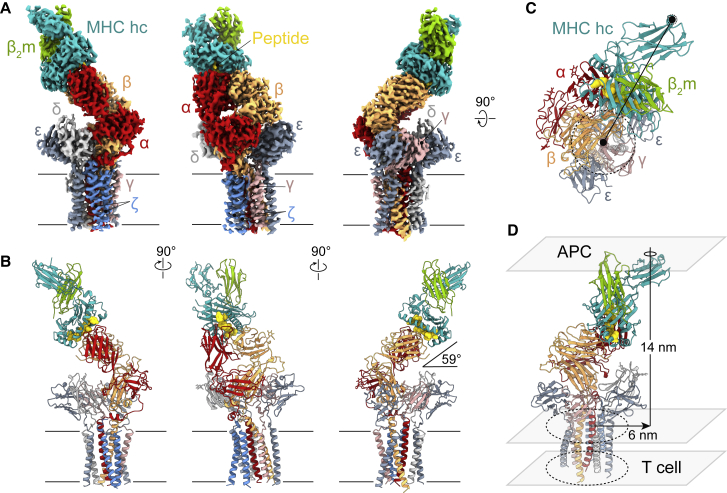
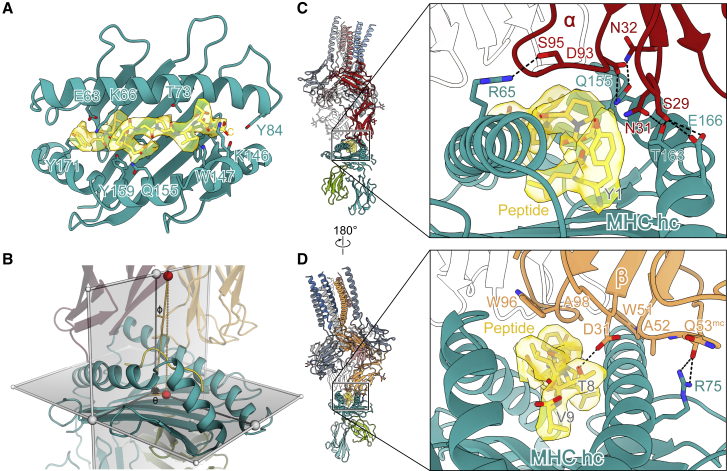
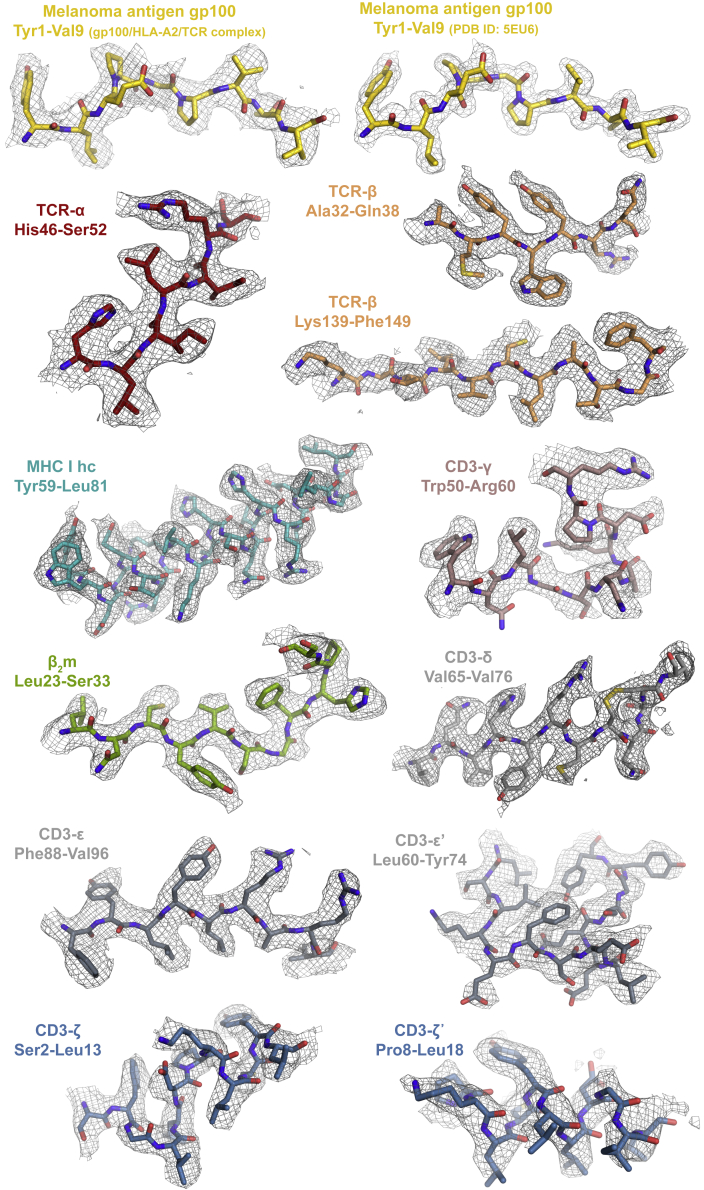
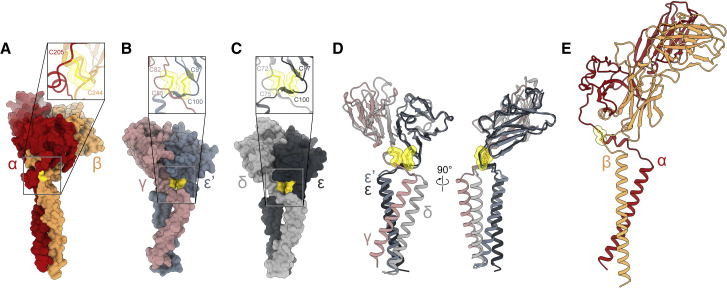
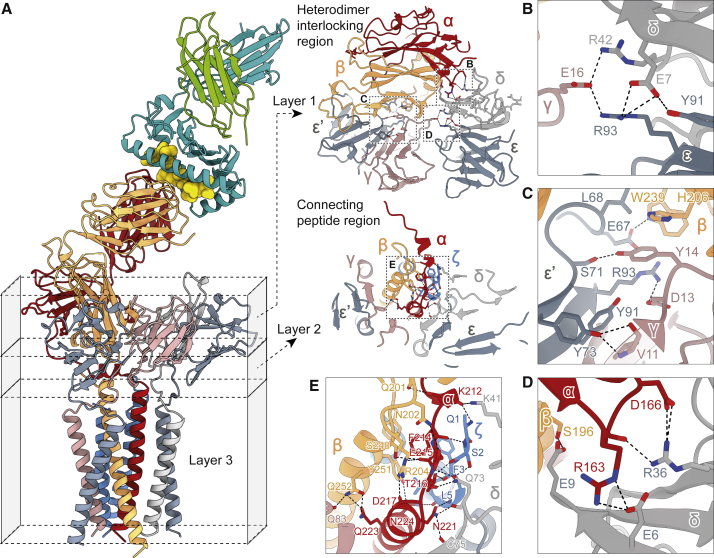
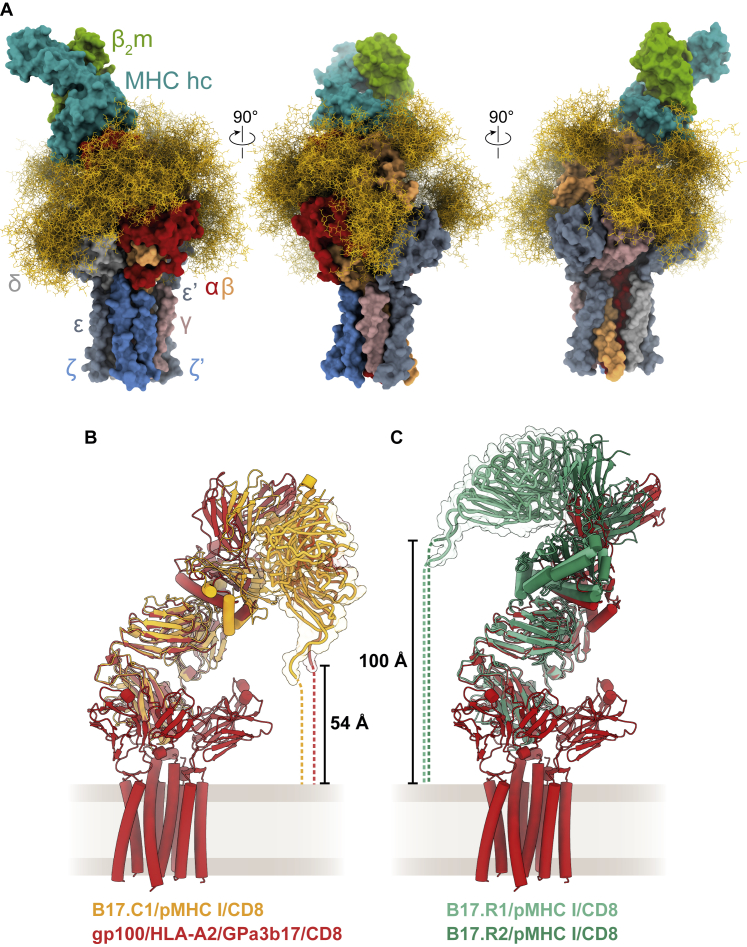
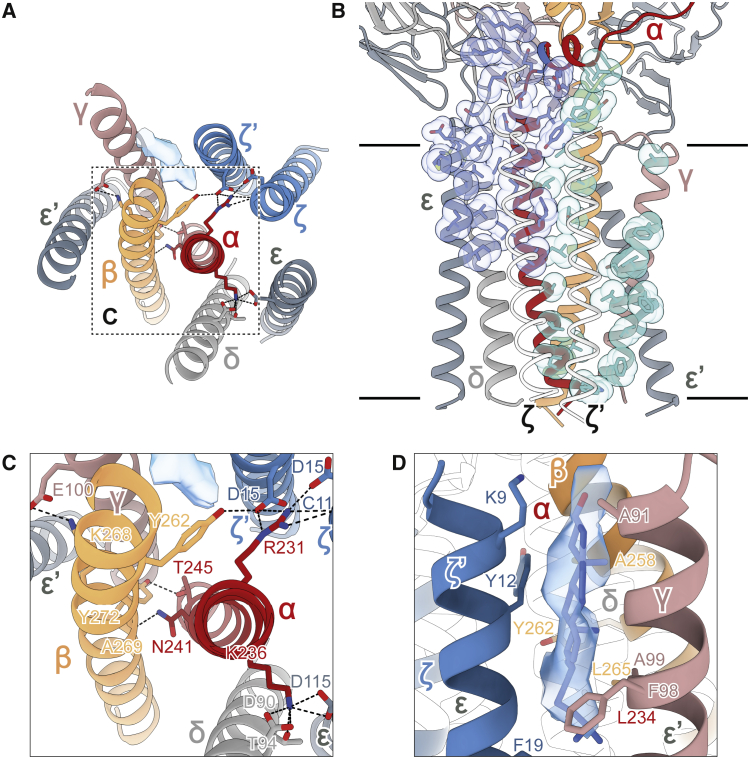
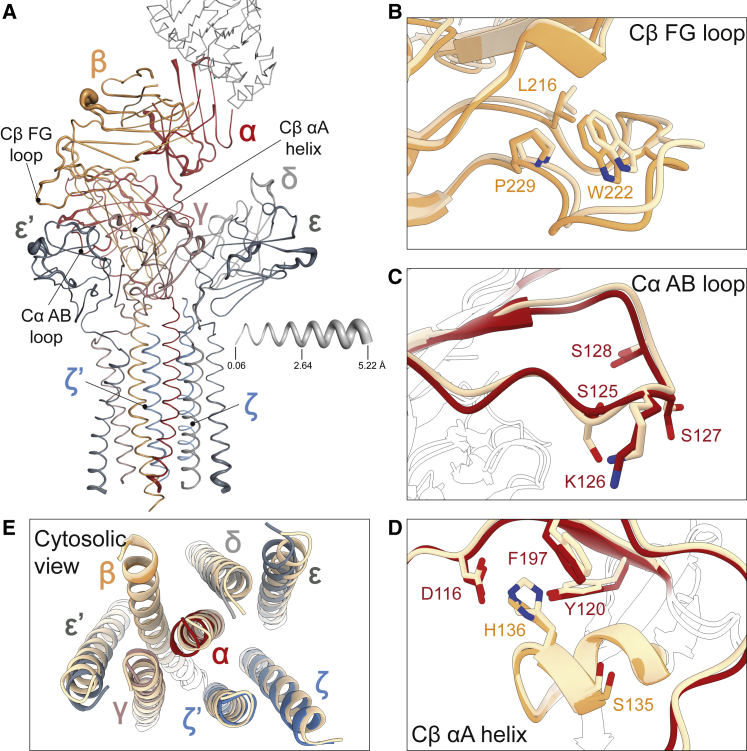
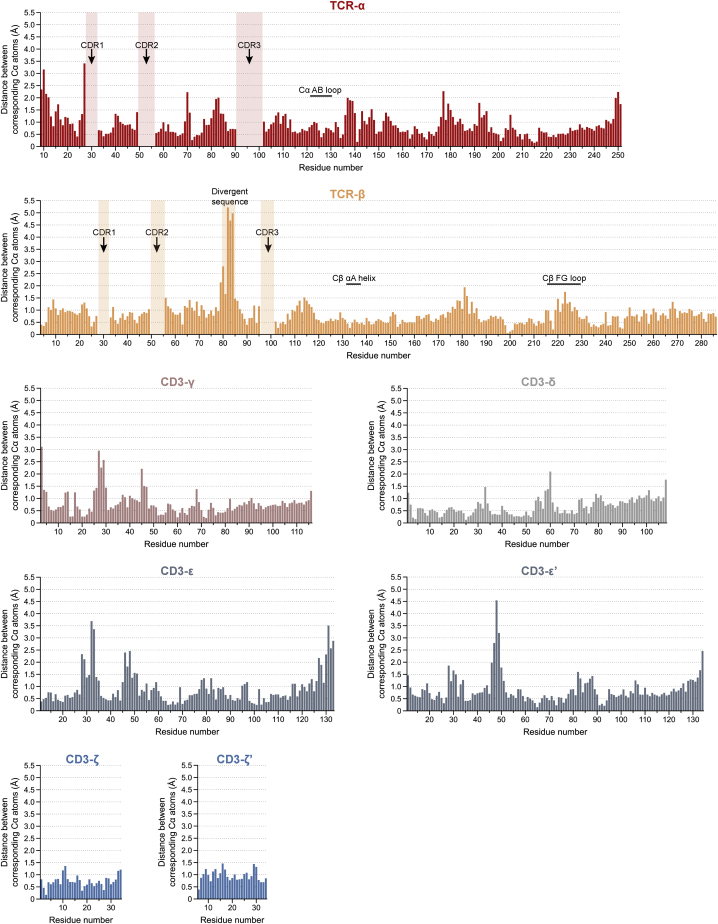
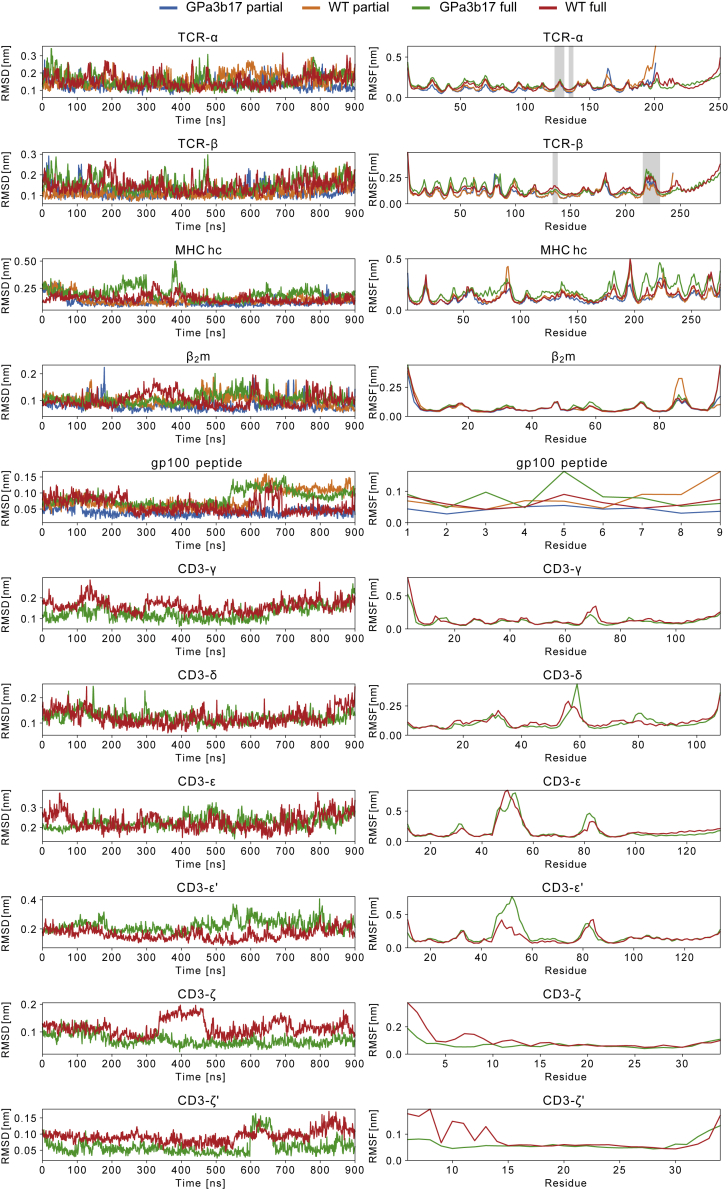
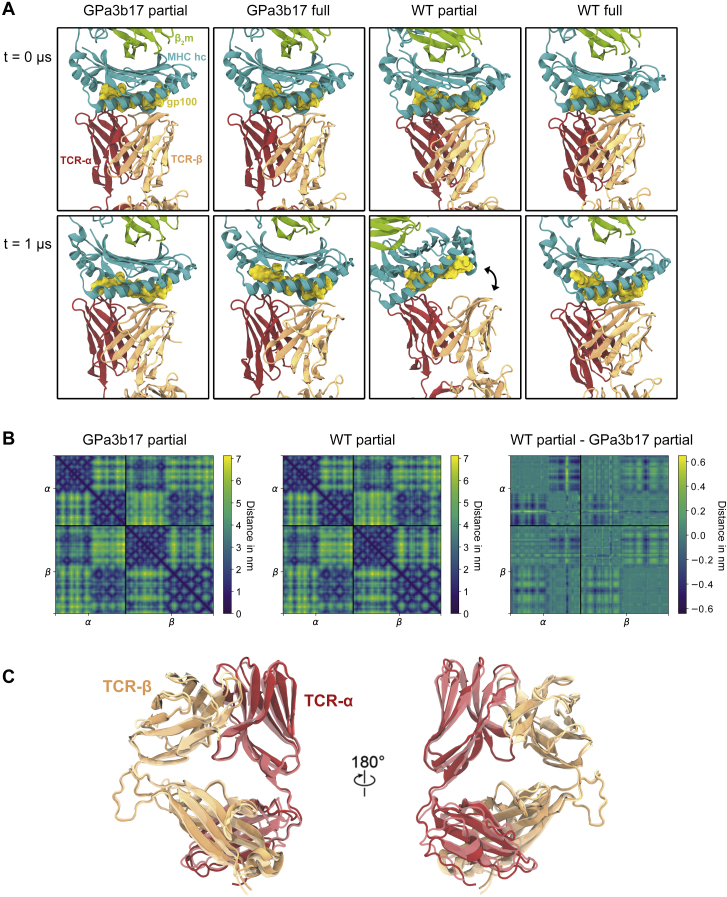
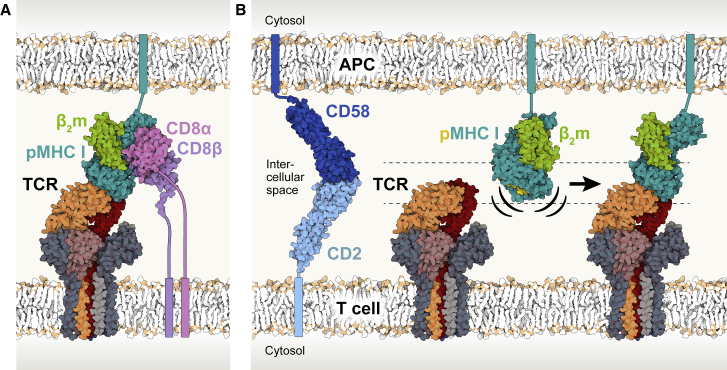
The T cell receptor (TCR) expressed by T lymphocytes initiates protective immune responses to pathogens and tumors. To explore the structural basis of how TCR signaling is initiated when the receptor binds to peptide-loaded major histocompatibility complex (pMHC) molecules, we used cryogenic electron microscopy to determine the structure of a tumor-reactive TCRαβ/CD3δγε2ζ2 complex bound to a melanoma-specific human class I pMHC at 3.08 Å resolution. The antigen-bound complex comprises 11 subunits stabilized by multivalent interactions across three structural layers, with clustered membrane-proximal cystines stabilizing the CD3-εδ and CD3-εγ heterodimers. Extra density sandwiched between transmembrane helices reveals the involvement of sterol lipids in TCR assembly. The geometry of the pMHC/TCR complex suggests that efficient TCR scanning of pMHC requires accurate pre-positioning of T cell and antigen-presenting cell membranes. Comparisons of the ligand-bound and unliganded receptors, along with molecular dynamics simulations, indicate that TCRs can be triggered in the absence of spontaneous structural rearrangements.

Keywords: adaptive immunity; antigen presentation; electron microscopy; membrane proteins; receptor triggering; structural cell biology; supramolecular complexes.


Conflict of interest statement

Declaration of interests The authors declare no competing interests.

Figures

None
Graphical abstract
Figure S1
Figure S1
Signaling capacity, expression, and isolation of stoichiometrically defined TCR-CD3/pMHC complexes, related to STAR Methods (A) Calcium signaling on SLBs. Jurkat T cells, with endogenous TCR genes inactivated using CRISPR-Cas9, were transfected with cDNA encoding the αβ subunits of the tumor-reactive, affinity-matured GPa3b17 TCR (KD = 13 pM; Liddy et al., 2012). The 1G4 TCR binds to the 9V variant of the NY-ESO antigen complexed with HLA-A2 with an affinity (KD = 7.2 μM) more typical of pMHC/TCR interactions (Chen et al., 2005). Cell lines were generated that expressed the TCR at wild-type (WT) levels, i.e., comparable to Jurkat cells (GPa3b17: 11,262 ± 1,532 TCRs/cell; 1G4: 17,141 ± 5,616 TCRs/cell) and low (Lo) levels (GPa3b17: 236 ± 181 TCRs/cell; 1G4: 488 ± 252 TCRs/cell). The cells were allowed to form contacts with nickelated SLBs presenting gp100/HLA-A2 or 9V/HLA-A2 monomers. Calcium responses were monitored using Fluo-4 AM fluorescence as a readout. Inactivation of ZAP70 and the TCR using CRISPR-Cas9 confirmed that the responses were TCR dependent. Data are presented as means ± SD, n = 3–4 biological replicates; the example shown is representative of two experiments. (B) Tests of CD69 upregulation induced by GPa3b17 TCR signaling. Jurkat T cells expressing wild-type amounts of GPa3b17 TCRs were incubated overnight with wild-type THP-1 cells and THP-1 cells whose expression of β2-microglobulin was prevented using CRISPR-Cas9, in the presence and absence of 100 μM gp100 peptide. CD69 expression was analyzed by flow cytometry. Data are presented as means ± SEM, n = 3 biological replicates; the example shown is representative of two experiments. Notably, while signaling was peptide- and pMHC-dependent (p < 0.05, Student’s t test), the GPa3b17 TCR was also triggered in the absence of the gp100 peptide. (C) Schematic showing the design of the expression constructs. DNA sequences encoding GPa3b17 TCR-αβ and CD3 proteins including a GFP2-tagged CD3-δ chain were cloned into three lentiviral expression vectors used to stably transduce CHO cells. The lentiviral constructs, named after the subunits they encoded, were called αγεζ, βεζ, and δ-GFP2. Where necessary, viral 2A sequences (blue arrows) were used to allow expression of multiple proteins by a single virus. Kozak sequences and stop codons are indicated by green and red circles. (D) SDS-PAGE analysis of purified gp100/HLA-A2/TCR, gp100/HLA-A2/TCR/UCHT1 (1/1/2 equiv), and UCHT1 Fab (2 equiv) under reducing (R, left) and non-reducing conditions (NR, right). (E) Binding of UCHT1 Fab to gp100/HLA-A2/TCR assessed by blue native PAGE. The gp100/HLA-A2/TCR was mixed with UCHT1 Fab at the indicated molar ratios prior to loading on the gel. (F) SEC analysis of the TCR in the absence and presence of UCHT1 Fab (3 equiv). For reference, the black trace shows the SEC trace for 1 equiv of UCHT1 Fab alone. (G) Titration of gp100/HLA-A2/TCR and UCHT1 Fab monitored by SEC, demonstrating that two UCHT1 Fab molecules can be bound per gp100/HLA-A2/TCR complex. (H) Flow cytometric analyses of GFP fluorescence (left), UCHT1-Phycoerythrin (PE, middle), and Alexa Fluor 647-labeled gp100/HLA-A2 (pMHC, right) staining of untransduced CHO cells (black), and CHO cells transduced with the following lentivirus combinations: δ-GFP2/αγεζ/βεζ (green), δ-GFP2/αγε/βεζ (orange), and δ-GFP2/αγε/βε (cyan). The median fluorescence intensities following pMHC staining were 4,555 (no virus), 134,852 (δ-GFP2/αγεζ/βεζ), 143,808 (δ-GFP2/αγε/βεζ), and 115,801 (δ-GFP2/αγε/βε). Expression of a gp100/HLA-A2 binding form of the GPa3b17 TCR was not strictly reliant on CD3-ζ.
Figure S2
Figure S2
Cryo-EM analysis of the gp100/HLA-A2/TCR complex, related to STAR Methods (A) Typical cryo-EM micrograph on graphene monolayer grids. (B) Cryo-EM data processing workflow. Maps highlighted by green or red dashed boxes served as “good” or “junk” references, respectively, for subsequent rounds of classification/refinement. (C) 3DFSC analysis of the final cryo-EM map (Tan et al., 2017). (D) FSC plot, generated in CryoSPARC (Punjani et al., 2017). The black solid line denotes the FSC = 0.143 cutoff used for resolution determination. (E) Euler angle distribution heatmap for the particles included in the final 3D refinement. The most frequent views are colored in red. (F) Local-resolution estimation computed in CryoSPARC. (G) Reference-free 2D classification of the gp100/HLA-A2/TCR particles. Selected 2D class averages of the gp100/HLA-A2/TCR complex are shown. Green and white arrows indicate densities consistent with GFP2 and UCHT1 Fab, respectively. Scale bar, 100 Å.
Figure 1
Figure 1
Overall structure of the fully assembled gp100/HLA-A2/TCR complex reveals tilted ligand-binding geometry (A and B) (A) EM density map and (B) atomic model of the fully assembled gp100/HLA-A2/TCR complex viewed parallel to the membrane plane. In (B), protein subunits are depicted in ribbon representation, the tumor-associated gp100 peptide antigen is shown as a space-filling model, and the N-acetylglucosamine moieties are represented by sticks. In (A) and (B), unique polypeptides are individually color-coded, and membrane boundaries are indicated by black lines. The 59° tilt between the gp100/HLA-A2 and TCR extracellular domains and the plasma membrane is denoted. (C) The gp100/HLA-A2/TCR structure viewed from the extracellular space along the membrane normal. Positions of TCR and pMHC transmembrane (TM) anchoring regions are each indicated by black dashed lines with filled black circles at the respective centers. (D) Inter-membrane distance between T cell and antigen-presenting cell (APC), and lateral displacement between the TM centers of TCR and pMHC, as determined from the gp100/HLA-A2/TCR structure. See also Figure S4.
Figure 2
Figure 2
Molecular recognition of tumor-associated gp100/HLA-A2 by the TCR (A) Melanoma antigen gp100 (YLEPGPVTV, yellow sticks) presented in the peptide-binding groove of the MHC I heavy chain (teal ribbon). Peptide-coordinating residues of the MHC I are shown in stick format. The peptide region of the cryo-EM map is depicted as a transparent yellow surface. (B) Geometry of TCR binding to gp100/HLA-A2, characterized in a spherical coordinate system by a rotation angle (Θ) of 93°, a tilt angle (Φ) of 7°, and a distance between the TCR Vα/Vβ center of mass (upper red sphere) and its projection on the horizontal plane (lower red sphere) of 27 Å (dotted line; Singh et al., 2020). (C) Polar interactions (dashed black lines) between residues of TCR-α and gp100/HLA-A2. TCR-β is shown as a colorless cartoon. (D) Details of the interface between TCR-β and gp100/HLA-A2. Hydrogen bonds are depicted as dashed black lines. TCR-α is shown as a colorless cartoon. See also Figure S3.
Figure S3
Figure S3
Extracted exemplary regions for each polypeptide chain in the cryo-EM map of the gp100/HLA-A2/TCR complex, related to Figures 1 and 2 In the top row, the cryo-EM map of the fully assembled gp100/HLA-A2/TCR complex at a local resolution of ∼2.6 Å (this work, left) is compared with the electron density for the complex of the soluble PMEL17 TCR-αβ ectodomain bound to gp100/HLA-A2 at 2.0 Å (PDB: 5EU6, right; Bianchi et al., 2016), in the region of the bound heteroclitic peptide.
Figure 3
Figure 3
Stabilization of the TCR-αβ and CD3 heterodimer linker regions by the connecting peptides (A) The linker region of the TCR-αβ heterodimer. The TCR-α CP helix fills the space underneath the Cβ domain, stabilizing the linker region. The close-up view shows the intermolecular disulfide bridge (yellow), securing the position of the CP helix. The cystine is represented as sticks, with the atomic van der Waals radii as transparent spheres. (B and C) The rigidity of the CD3-ε′γ (B) and CD3-εδ (C) heterodimers is reinforced by the tight packing of their connecting peptide regions, and most notably by a pair of interacting cystines. The close-up views show the cystines as sticks, with their atomic van der Waals radii as transparent spheres. Chemically identical subunits at different positions in the TCR assembly are distinguished by the prime symbol. (D) Superimposing CD3-ε′γ and CD3-εδ on CD3-ε′ and CD3-ε reveals the remarkably similar architecture of the two heterodimeric CD3 assemblies as putative docking modules. (E) The marked tilt in the ectodomain of the TCR-αβ heterodimer imposed by the linker region, for comparison with similarly tilted ectodomains of the CD3-ε′γ and CD3-εδ heterodimers in (D). The topologies of the heterodimers likely facilitate ectodomain docking and the simultaneous close association of their TM regions.
Figure 4
Figure 4
Conformational stabilization of the TCR through a network of interlocking, multivalent interactions (A) From the constant regions of TCR-αβ to the membrane, the TCR inter-subunit contacts can be divided into three layers: the folded ectodomains (layer 1), the connecting peptide region (layer 2), and the TM domains (layer 3). (B–D) Close-up views of interactions in layer 1. (E) Close-up view of the interaction network in the connecting peptide region (layer 2). Hydrogen bonds and salt bridges in (B)–(E) are depicted by black dashed lines. See also Figure S4A.
Figure S4
Figure S4
Glycosylation sites of the liganded TCR and influence of the pMHC I/TCR docking polarity on the CD8-binding sites, related to Figures 2 and 4 (A) The different subunits of the gp100/HLA-A2-bound GPa3b17 TCR are shown with their solvent-excluded surfaces. N-linked glycans ((NeuNAc-Gal-GlcNAc)2Man3(Fuc)(GlcNAc)2) were modeled using the molecular dynamics (MD) software pipeline GlycoSHIELD (Gecht et al., 2022) and are depicted as tan-colored sticks. For each glycosylation site, 50 conformers are shown. The cryo-EM map contained clear “density” only for the Asn-linked GlcNAc moieties, suggesting that N-glycans are not involved in any protein interfaces. (B) The canonical TCR/pMHC I docking polarity, as exemplified by the structures of B17.C1/pMHC I (PDB: 7JWJ) and gp100/HLA-A2/GPa3b17 TCR complexes, places the binding site of the membrane-anchored CD8 in a position that is more accessible than in the reversed TCR/pMHC I docking polarity (C), as observed for B17.R1/pMHC I (PDB: 5SWZ) and B17.R2/pMHC I (PDB: 7JWI). The CD8αβ heterodimers (PDB: 3DMM) are depicted as tubes with their surfaces as transparent envelopes. The distances that must be traversed between the C terminus of the CD8β subunit and the membrane are shown as dashed lines.
Figure 5
Figure 5
Transmembrane assembly including the contribution of sterol lipid (A) Extracellular view of the transmembrane domain (layer 3). (B) The two CD3-ζ chains (shown in white) are positioned in very different environments within the CD3 TM assembly. The view is related to Figure 4A by a 165° rotation around the longest axis of the complex. Residues interacting with CD3-ζ (blue) and CD3-ζ′ (cyan) were identified using the program PISA (Krissinel and Henrick, 2007) and are shown as sticks and with their atomic van der Waals radii as transparent spheres. (C) Tight associations in the outer leaflet portions of the TCR-α and TCR-β TMs with CD3-εδ and CD3-ε′γ, respectively, enable the intra-membrane neutralization of positive charges in TCR-α and TCR-β. Hydrogen bonds and salt bridges in (A) and (C) are depicted by black dashed lines. (D) Extra non-protein density (transparent blue surface) was observed in the outer leaflet between the TM helices of CD3-ζ′ and CD3-γ, likely matching a cholesterol molecule.
Figure 6
Figure 6
Structural rigidity of the TCR membrane complex (A) Structural differences between the gp100/HLA-A2-bound GPa3b17 TCR and unliganded complex (Dong et al., 2019) mapped onto the gp100/HLA-A2-bound TCR. Thickness of the putty cartoon representation corresponds to the distance between equivalent Cα atoms after superposition of the two structures. Distances vary between 0.06 and 5.22 Å. The gp100/HLA-A2 structure is shown as gray ribbon. (B–E) Structural differences between gp100/HLA-A2-bound and unliganded (light wheat color) TCR in regions previously postulated to be sites of pMHC-induced allosteric regulation, including the Cβ FG loop (B), Cα AB loop (C), Cβ αA helix (D), and the C termini of TM helices (E). Selected residues are shown as sticks. See also Figure S5, Figure S6, Figure S7.
Figure S5
Figure S5
Structural comparison of gp100/HLA-A2-bound and unliganded TCR, related to Figure 6 The structures of gp100/HLA-A2-bound GPa3b17 TCR and the unliganded receptor (Dong et al., 2019) were superimposed, and the Cα atomic distance for each residue in all subunits was calculated. Notable regions previously implicated in allosteric mechanisms of signaling are marked. Note that the highly divergent CDR motifs were not included in the analysis and are indicated by pale-colored rectangles.
Figure S6
Figure S6
Comparison of the GPa3b17 and parental WT TCR complexes, related to Figure 6 RMSD (left) and RMSF (right) values of the individual subunits with respect to their mean structure are reported for the four simulation systems: gp100/HLA-A2-bound GPa3b17 TCR comprising the soluble TCR-αβ subunits (“GPa3b17 partial,” blue lines), gp100/HLA-A2-bound WT TCR comprising the soluble TCR-αβ subunits (“WT partial,” orange lines), gp100/HLA-A2-bound GPa3b17 fully assembled TCR (“GPa3b17 full,” green lines), and gp100/HLA-A2-bound WT fully assembled TCR (“WT full,” red lines). Residues of the Cβ FG loop (residues 216–231), Cα AB loop (residues 134–137), and around the Cβ αA helix (residues 134–137 of TCR-α and 134–138 of TCR-β) are shaded in gray.
Figure S7
Figure S7
Gp100/pMHC/TCR-αβ interface, TCR-αβ distance matrices, and mean TCR structures from simulation, related to Figure 6 (A) Renders of first (t = 0 μs) and last (t = 1 μs) simulation snapshots of the gp100/HLA-A2/TCR-αβ interface from simulations of the partial and fully assembled GPa3b17 (left) and WT (right) TCRs. (B) Distance matrices reported for mean TCR-αβ simulation structures of partial GPa3b17 and WT TCRs bound to gp100/HLA-A2. The distance map (WT partial − GPa3b17 partial) reveals that only subtle changes in the internal organization of TCR-αβ are associated with the GPa3b17 mutations. (C) Renders of the partial (TCR-αβ) mean simulation structures. Darker colors identify the gp100/HLA-A2-bound partial GPa3b17 TCR, and lighter colors the gp100/HLA-A2-bound partial WT TCR. The proteins were rendered with visual molecular dynamics (VMD) v1.9.3 (Humphrey et al., 1996).
Figure 7
Figure 7
Overall geometry of the TCR membrane complex and implications for co-receptor binding and antigen recognition (A) Following pMHC binding, the co-receptor CD8αβ can readily dock onto the α3 domain of the MHC heavy chain to augment TCR signaling. (B) Productive pMHC/TCR binding requires membrane proximity, which is facilitated by CD2 and CD58 adhesion molecules on the T cell and APC, respectively. Rigid-body motion of the pMHC suffices to enable TCR binding, leading to signaling. See also Figures S4B and S4C.

References

    1. Abraham M.J., Murtola R., Schulz R., Páil S., Smith J.C., Hess B., Lindathl E. GROMACS: high performance molecular simulations through multi-level parallelism from laptops to supercomputer. SoftwareX. 2015;1–2:19–25. doi: 10.1016/j.softx.2015.06.001. - DOI
    1. Arnett K.L., Harrison S.C., Wiley D.C. Crystal structure of a human CD3-epsilon/delta dimer in complex with a UCHT1 single-chain antibody fragment. Proc. Natl. Acad. Sci. USA. 2004;101:16268–16273. doi: 10.1073/pnas.0407359101. - DOI - PMC - PubMed
    1. Beddoe T., Chen Z., Clements C.S., Ely L.K., Bushell S.R., Vivian J.P., Kjer-Nielsen L., Pang S.S., Dunstone M.A., Liu Y.C., et al. Antigen ligation triggers a conformational change within the constant domain of the alphabeta T cell receptor. Immunity. 2009;30:777–788. doi: 10.1016/j.immuni.2009.03.018. - DOI - PubMed
    1. Bepler T., Morin A., Rapp M., Brasch J., Shapiro L., Noble A.J., Berger B. Positive-unlabeled convolutional neural networks for particle picking in cryo-electron micrographs. Nat. Methods. 2019;16:1153–1160. doi: 10.1038/s41592-019-0575-8. - DOI - PMC - PubMed
    1. Berendsen H.J.C., Postma J.P.M., van Gunsteren W.F., DiNola A., Haak J.R. Molecular dynamics with coupling to an external bath. J. Chem. Phys. 1984;81:3684–3690.

Publication types

MeSH terms

Substances