. 2022 Sep 1;185(18):3408-3425.e29.
doi: 10.1016/j.cell.2022.07.013. Epub 2022 Aug 18.

Sustained deep-tissue voltage recording using a fast indicator evolved for two-photon microscopy

Affiliations

Sustained deep-tissue voltage recording using a fast indicator evolved for two-photon microscopy

Zhuohe Liu et al. Cell. .

Abstract

Genetically encoded voltage indicators are emerging tools for monitoring voltage dynamics with cell-type specificity. However, current indicators enable a narrow range of applications due to poor performance under two-photon microscopy, a method of choice for deep-tissue recording. To improve indicators, we developed a multiparameter high-throughput platform to optimize voltage indicators for two-photon microscopy. Using this system, we identified JEDI-2P, an indicator that is faster, brighter, and more sensitive and photostable than its predecessors. We demonstrate that JEDI-2P can report light-evoked responses in axonal termini of Drosophila interneurons and the dendrites and somata of amacrine cells of isolated mouse retina. JEDI-2P can also optically record the voltage dynamics of individual cortical neurons in awake behaving mice for more than 30 min using both resonant-scanning and ULoVE random-access microscopy. Finally, ULoVE recording of JEDI-2P can robustly detect spikes at depths exceeding 400 μm and report voltage correlations in pairs of neurons.

Keywords: GEVI; JEDI-2P; fly vision; genetically encoded voltage indicator; high-throughput screening; pairwise voltage correlations; random-access microscopy; starburst amacrine cells; two-photon fluorescence microscopy; voltage imaging.


Conflict of interest statement

Declaration of interests F.S.-P. holds a US patent for a voltage sensor design (patent #US9606100 B2). F.S.-P., Z.L., and J.L. have filed a US patent for the SPOTlight screening method. S.D. and P.B. have ownership shares in Karthala Systems, a commercial supplier of RAMP microscopes.

Figures
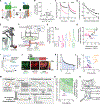
Figure 1.
Figure 1.. Significance, design, and deployment of a multiparametric two-photon voltage indicator screening platform
(A) We optimized indicators in which a circularly permuted green fluorescent protein (cpGFP, green) is inserted into a voltage-sensing domain (VSD, gray/red). Depolarization (right) results in conformational changes that reduce cpGFP brightness. (B–D) 1PM properties of fluorescent proteins and sensors do not always predict their performance under 2PM. (B) Fluorescent protein absorption under 1PM and 2PM are poorly correlated. Pearson’s r = 0.28. Data are from Drobizhev et al. (2011). (C) Relative mean photobleaching rates under widefield 1PM (left) are not always predictive of those under laser-scanning 2PM (right). Gray, ASAP1-N124V-R406K. Pink, ASAP2s-T207H. Shaded areas denote the 95% CI. n = 6/condition. (D) ASAP3 produces different mean response amplitudes to 1-s voltage steps under our 1PM and 2PM imaging conditions. Error bars, 95% CI. n = 9 (1PM) or 7 (2PM) HEK293A cells. p < 0.0001 for all comparisons (t test with Holm-Šídák correction). (E) Rendering of the motorized electrode assembly. (F) Schematic of the automated 2PM GEVI screening system. The boxed area shows the stimulation protocol. (G) Mean responses to 1-ms electric field stimulations. The response of each GEVI was measured in a separate experiment. ASAP1-EGFP is a control with no sensitivity to voltage. Shaded areas denote the 95% CI. n = 6/GEVI. (H) GEVI responses to 1-ms field stimulation pulses are highly correlated with their responses to neuronal-like spike waveforms at room temperature (100-mV height, 2-ms width). Pearson’s r2 = 0.998. Dashed line is the intercept-free linear fit. Error bars are the 95% CI. n = 6/independent transfections per GEVI (electric field stimulation) or 4–7 HEK293A cells (spike waveforms). (I) Schematic showing that single-parameter or hierarchical screening of GEVIs can miss variants with overall better performance across multiple metrics (yellow star) and variants that did not meet the threshold for the first parameter but display high performance in other properties (blue square). (J) GEVIs were fused to a red-emitting reference FP (cyOFP1) to measure brightness independently of variations in expression level. Top, screening cassette schematic. Bottom, similar green/red ratios were observed for cells with different expression levels. Scale bar, 10 μm. (K) Photostability was quantified as the area under the curve (blue), as shown in this representative screening time course. (L) Three GEVIs form distinct clusters. Data were normalized to the mean values of ASAP2s. n = 32/GEVI. (M) GEVI screening workflow. (N) Multiparametric evaluation of new GEVIs. Gray circles are screening intermediates. Data were normalized to the mean values of ASAP2s. n = 6/GEVI. (O) In silico model of ASAP2s showing the locations of the 6 mutations in JEDI-2P compared with ASAP2s (green). 16 other residues were also screened (blue). In all panels, unless otherwise noted, the sample size (n) represents independent transfections and shaded areas and error bars denote the 95% CI. See also Figures S1, S2, and S3 and Table S1.
Figure 2.
Figure 2.. JEDI-2P displays improved sensitivity, off-kinetics, brightness, and photostability under 2PM in vitro
(A–C) JEDI-2P produces larger steady-state responses to step depolarizations under 2PM than ASAP3 and ASAP2s. Voltage was modulated by whole-cell voltage clamp. n = 5 (ASAP2s), 7 (ASAP3), and 6 (JEDI-2P) HEK293A cells. (A) Mean fluorescence responses to voltage steps. Traces were smoothed by a 24-ms moving average. (B) Quantification of (A). For statistics, see Data S2. (C) JEDI-2P produces larger peak steady-state responses to 100-mV voltage steps from a resting potential of −70 mV. p < 0.0001 (ANOVA). (D–F) JEDI-2P produces larger and faster responses to a spike waveform under 2PM than ASAP3 and ASAP2s. n = 5 (ASAP2s) and 7 (ASAP3 & JEDI-2P) HEK293A cells. To mimic the properties of layer 2/3 cortical neurons at room temperature, the waveform had a 2-ms full width at half maximum (Hedrick and Waters, 2012). (D) Mean responses to a single spike waveform (left) and a 100-Hz spike train (right). (E and F) Quantification of the peak response amplitude (E) and full width at half maximum (F) of the GEVI responses to single spike waveforms. Black lines indicate means. ANOVA p < 0.0001 (E) and p < 0.01 (F). (G–I) JEDI-2P is more photostable and brighter than ASAP3 and ASAP2s under 2PM. Assays were conducted at a polarized potential (~−77 mV) by expressing GEVIs in HEK293-Kir2.1 cells. (G) Normalized mean fluorescence as a function of time. Dashed lines highlight mark half-lives. n = 3 independent transfections per GEVI. (H) Relation of photobleaching half-life versus excitation power both shown in a linear scale or logarithmic scale (inset). n = 3 independent transfections per condition. For statistics, see Data S2. (I) Brightness JEDI-2P is brighter than ASAP3 and ASAP2s under 2P at 920 nm. Black bars denote the means of n = 6 independent transfections per GEVI. p < 0.0001 ANOVA. (J) 2PM excitation spectra in HEK293-Kir2.1 cells. JEDI-2P has a red-shifted peak (940 nm) compared with ASAP2s (930 nm) and EGFP (930 nm) spectra were normalized to their respective peaks. Laser pulses were not pre-compensated for dispersion in the microscope optical path. Lines show the mean of n = 18 (ASAP2s), 13 (EGFP), and 38 (JEDI-2P) fields of view, each with >100 cells. (K) JEDI-2P targets efficiently to the plasma membrane in the soma and dendrites, as shown in this confocal image of a representative DIV13 cortical neuron dissociated from an E18 rat brain and imaged by confocal microscopy. The overall image and dendrite zoom-in are from the maximal projection of the z stack, whereas the soma image is a single slice. Scale bars, 10 μm. All panels: **** p < 0.0001; *** p < 0.001; ** p < 0.01; * p < 0.05; n.s. p > 0.05, Tukey’s HSD multiple comparison test. Error bars or shaded areas denote the 95% CI. All tests were conducted at room temperature. For statistics for (B) and (H), see Data S2. For (C), (E), (F), and (I), black lines indicate means. See also Figure S4; Table S1, Table S2, and Data S2.
Figure 3.
Figure 3.. JEDI-2P captures voltage responses to changes in visual stimuli frequency and contrast in isolated mouse retina
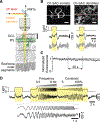
(A) Experimental setup schematic. JEDI-2P was expressed in starburst amacrine cells (SAC, green). GCL, ganglion cell layer and IPL, inner plexiform layer. Visual stimuli were presented to the photoreceptors in the retina. Scale bar, 20 μm. (B) Top, representative images of “on” SACs expressing JEDI-2P. Scale bars, 5 μm. The optical traces are the mean voltage responses to n = 20 trials (black line) and 3 representative single trials (gray, bottom traces) recorded from somata (left) and dendrites (right). Shaded areas are the 95% CI. Fluorescence was recorded at 1 kHz with line scans (white lines) and resampled at 40 Hz. The pixels used for analysis are shown in red. The white arrow indicates the cell analyzed in somatic recordings. s.d. is the standard deviation of the baseline variation across all trials. (C) JEDI-2P reports membrane voltage with high photostability. Laser power, 9–12 mW (measured after the objective). The black line denotes the mean fluorescence normalized using the mean fluorescence of the first 2 s of each recording. Shaded areas are the 95% CI and may be too small to see. n = 4 independent fields of view from 2 mice. (D) JEDI-2P captures dendritic voltage responses to visual stimuli frequency and contrast. The optical trace is the mean dendritic voltage response, and shaded areas are the 95% CI. Fluorescence was recorded at up to 1 kHz and resampled to 40 Hz. A stimulus frequency of 2 Hz was used when changing contrast. Bottom, zoomed-in sections of the stimulus and responses. 2 SD is equivalent to 34% ΔF/F0. n = 3 independent fields of view from 2 mice. For all panels except for (C), fluorescence traces were baseline corrected. See also Table S1.
Figure 4.
Figure 4.. JEDI-2P reports light-evoked axonal voltage transients with large response amplitude, rapid kinetics, and high photostability
(A) We imaged the axonal projections of L2 cells, non-spiking neuron postsynaptic to photoreceptors (R1–R6). Bottom, representative field of view showing groups of axonal termini of four neighboring cells expressing JEDI-2P. Scale bar, 5 μm. (B) Schematic of our experimental setup. (C) We presented 20-ms light and dark flashes from a mean gray background (top graph and light gray shading in graphs below) and measured light-evoked fluorescence responses. Colored lines are the mean of n = 47 cells from 4 flies (JEDI-2P) and 40 cells from 4 flies (ASAP2f). (D) Quantification of the responses in (C). JEDI-2P reported depolarizations with a larger response amplitude than ASAP2f (left) and with similar or faster response kinetics (right). Mean values are shown. *** p = 0.000015; ** p = 0.0054; n.s. not significant (t test with Bonferroni correction). (E) JEDI-2P is more photostable than ASAP2f. Laser power, 16 mW (measured after the objective). Mean fluorescence values are shown, normalized to the fluorescence at t = 0. To better visualize the photobleaching time course, light-evoked responses were minimized using a 520-ms rolling average. n = 43 cells (JEDI-2P) and 29 cells (ASAP2f), each from 4 flies. (F) JEDI-2P robustly reports voltage responses over the course of 20 min. We displayed alternating 300 ms light (unshaded areas) and dark flashes (gray shaded areas) throughout the entire recording. Mean JEDI-2P responses (dark green traces) during the first minute of recording (middle) and during the 19th minute of recording (bottom) were comparable. Gray traces show stimulus-evoked averages of the response over 1 min for each of the n = 6 cells from the same fly. Traces in all panels except (E) were baseline corrected. All shaded areas and error bars denote the SEM. See also Figure S5 and Table S1.
Figure 5.
Figure 5.. JEDI-2P enables long-lasting 2P imaging of voltage dynamics in mice using resonant-scanning microscopy
(A) Experimental setup schematic. Data were collected while the mouse was presented with visual stimuli consisting of Gaussian noise with coherent orientation and motion. Mice were head fixed and free to behave on a non-motorized circular treadmill. Recordings were acquired in layer 2/3 cells of the visual cortex. Imaging was conducted at 440 Hz unless otherwise noted. (B) All experiments used JEDI-2P with a soma-localization tag. Top, representative image of soma-targeted JEDI-2P in the visual cortex. Bottom left and middle, zoomed-in images of the cells highlighted in the white boxes. Bottom right, fluorescence image of a neuron being simultaneously patched and imaged. The position of the pipette is outlined in white. Green fluorescence is from JEDI-2P, and red is from the dye Alexa Fluor 594 present in the pipette. Scale bars, 20 μm. (C–F) Simultaneous optical and loose-patch juxtacellular recordings in anesthetized animals. (C) Example recording. Vertical lines indicate spikes identified in the electrophysiological recording (black) or predicted from the optical trace using VolPy (green). The dashed box shows a zoomed-in section. (D) Distribution of the optical responses to spikes. Data are shown as violin plots with the black bars denoting the mean. n = 4 cells from 2 mice. (E) JEDI-2P’s optical response to spikes (top) closely tracked the underlying electrical waveform (bottom). Waveforms were averaged from 1,358 spikes (identified from the electrophysiological trace) from the same cell. The shaded area (small) denotes the SEM. (F) Global UP-DOWN states can be monitored by voltage imaging. Top, electrophysiological recording. Bottom, JEDI-2P responses from a single cell (arrow) were recorded at 150 Hz. JEDI-2P recordings at 150 Hz (green) tracked the electrophysiological changes monitored 1 mm from the site of optical recording. The optical trace was recorded from a single cell (arrow). Scale bar, 20 μm. (G–I) Optical-only recordings in awake behaving mice. Cells were between 170 and 225 μm from the surface of the brain. (G) JEDI-2P is photostable under resonant-scan 2PM. Laser power was 34 mW (measured after the objective). Fluorescence was normalized to values at t = 0. The thick line denotes the mean, and shaded areas are the 95% CI. n = 4 cells from the same animal. (H) Example of a 30-min optical recording in an awake behaving mouse at a depth of 170 μm. Vertical lines are VolPy-predicted spikes. (I) JEDI-2P can report directional tuning of individual neurons. For each direction of motion, fluorescence responses were averaged over the entire trace and thus include spikes, subthreshold potentials, and periods with no voltage changes. Acquisition frequency was 233 Hz to capture a larger field of view than at 440 Hz. Green lines indicate the data fitted by a von Mises function (Reimer et al., 2014). Error bars are the 95% CI. n = 20 trials. Traces in all panels except (G) were baseline corrected and a.u. denotes arbitrary units. See also Figures S6 and S7 and Table S1.
Figure 6.
Figure 6.. Sustained high-fidelity 2P voltage recordings in cortical layers 2/3 and 5 using JEDI-2P and ULoVE microscopy
(A) During voltage recording, the head-fixed mouse is free to behave on a non-motorized wheel. (B) Representative YZ projection (left) and single XY plane (right) showing sparsely expressed JEDI-2P in the visual cortex. Images were acquired by 2P point scanning. The XY plane shows ring-like patterns of expression because all ULoVE experiments used GEVIs appended with a soma-localization tag. Scale bars, 50 μm. (C) A ULoVE excitation pattern overlaid onto a slice of a single cell. To cover both halves of a cell, we rapidly alternated between two patterns (Figure S8A). (D–F) Representative optical recording of a layer 2/3 neuron. (D) Left, point-scanning 2PM image of the neuron acquired before ULoVE recording. Scale bar, 10 μm. Right, Fluorescence from more than >40 min of continuous ULoVE optical recording. Heatmap below indicates the wheel speed. (E) Zoomed-in traces of the fluorescence signal from (D). The last row shows the fluorescence signal (gray) overlaid with MLspike-extracted spikes (red) and slow voltage changes (blue). (F) Average optical spike waveforms from the 1-min time windows indicated in (D). (G) Amplitude versus repolarization kinetic (τ) of the optical response to APs from n = 23 (ASAP3) (Villette et al., 2019) and 36 (JEDI-2P) neurons in layer 2/3 of the visual cortex. The crosshair marks indicate mean ± SD. *** p = 3.8E–11 (response amplitude) and 4.4E–13 (τ), two-sample Kolmogorov-Smirnov test. (H–J) Representative optical recording of a layer 5 pyramidal neuron. (H) Top left, Point-scanning 2PM image of the neuron acquired before ULoVE recording. Scale bar, 10 μm. Right, fluorescence signal during behavior. Heatmap below indicates the wheel speed. (I) Zoomed-in trace from (H) (dashed box), with the fluorescence signal shown in gray. MLspike-extracted spikes (red) and slow voltage changes (blue) are overlaid. The dashed boxed (right) shows a zoomed-in view of a spike burst. (J) Average optical spikes from the four cells recorded in layer 5; different shades of gray indicate different cells. Traces in all panels were baseline corrected. See also Figures S8 and S9 and Table S1.
Figure 7.
Figure 7.. ULoVE optical recording of JEDI-2P enables long-lasting recording of pairwise voltage correlations during behavior
(A) Baseline-corrected fluorescence signals from two neurons of layer 2/3 recorded simultaneously for 15.4 min. Heatmap below indicates the wheel speed. Traces were smoothed with a 1-ms Gaussian kernel for display only. Top left, point-scanning 2PM image of the neurons acquired before ULoVE recording. Scale bar, 10 μm. (B) Zoomed-in traces of the fluorescence signal in (A) (box) but overlaying the two cell traces. Note the subthreshold co-modulation. (C) Voltage cross-correlation of the cell pair from (A) calculated over the entire recording. (D) The pairwise voltage cross-correlation is highly variable but not significantly affected by the distance between the neurons. Pearson’s r = −0.22, p = 0.41 (linear regression t test). The color code represents the significance (Z score) of the cross-correlation, as obtained from a bootstrap evaluation. n = 17 cell pairs. (E–F) Locomotion increased or decreased voltage cross-correlation in different cell pairs. (E) Representative cell pairs showing opposite modulation of their voltage cross-correlation by locomotion. Cell pair (a) is the pair shown in (A)–(C). (F) Normalized peak voltage cross-correlation during locomotion and rest epochs for the n = 12 cell pairs analyzed. Color code represents the significance (Z score) of the difference between rest and locomotion cross-correlations, relative to randomly chosen episodes of the same durations. (a) and (b) correspond to the two pairs of neurons shown in (E). The black diagonal line indicates identical cross-correlation values between rest and locomotion epochs. (G) The modulation of voltage cross-correlation by locomotion was not correlated with the degree of spike-rate modulation by locomotion of the two cells of each pair. Pearson’s r = 0.11, p = 0.73 (linear regression t test). Data points are the average of each pair. For all experiments, the soma-localized variant of JEDI-2P was used. See also Figure S10 and Table S1.

References

    1. Abdelfattah AS, Farhi SL, Zhao Y, Brinks D, Zou P, Ruangkittisakul A, Platisa J, Pieribone VA, Ballanyi K, Cohen AE, and Campbell RE (2016). A bright and fast red fluorescent protein voltage indicator that reports neuronal activity in organotypic brain slices. J. Neurosci. 36, 2458–2472. 10.1523/JNEUROSCI.3484-15.2016. - DOI - PMC - PubMed
    1. Adhikari DP, Biener G, Stoneman MR, Badu DN, Paprocki JD, Eis A, Park PS-H, Popa I, and Raicu V (2021). Comparative photophysical properties of some widely used fluorescent proteins under two-photon excitation conditions. Spectrochim. Acta A Mol. Biomol. Spectrosc. 262, 120133. 10.1016/j.saa.2021.120133. - DOI - PubMed
    1. Ankri L, Ezra-Tsur E, Maimon SR, Kaushansky N, and Rivlin-Etzion M (2020). Antagonistic Center-surround mechanisms for direction selectivity in the retina. Cell Rep. 31, 107608. 10.1016/j.celrep.2020.107608. - DOI - PMC - PubMed
    1. Baden T, Berens P, Franke K, Román Rosón M, Bethge M, and Euler T (2016). The functional diversity of retinal ganglion cells in the mouse. Nature 529, 345–350. 10.1038/nature16468. - DOI - PMC - PubMed
    1. Behrens C, Yadav SC, Korympidou MM, Zhang Y, Haverkamp S, Irsen S, Schaedler A, Lu X, Liu Z, Lause J, et al. (2022). Retinal horizontal cells use different synaptic sites for global feedforward and local feedback signaling. Curr. Biol. 32, 545–558.e5. 10.1016/j.cub.2021.11.055. - DOI - PMC - PubMed

Publication types