. 2022 Sep 26;32(18):4025-4039.e3.
doi: 10.1016/j.cub.2022.07.054. Epub 2022 Aug 18.

Intrinsic maturation of sleep output neurons regulates sleep ontogeny in Drosophila

Affiliations

Intrinsic maturation of sleep output neurons regulates sleep ontogeny in Drosophila

Naihua N Gong et al. Curr Biol. .

Abstract

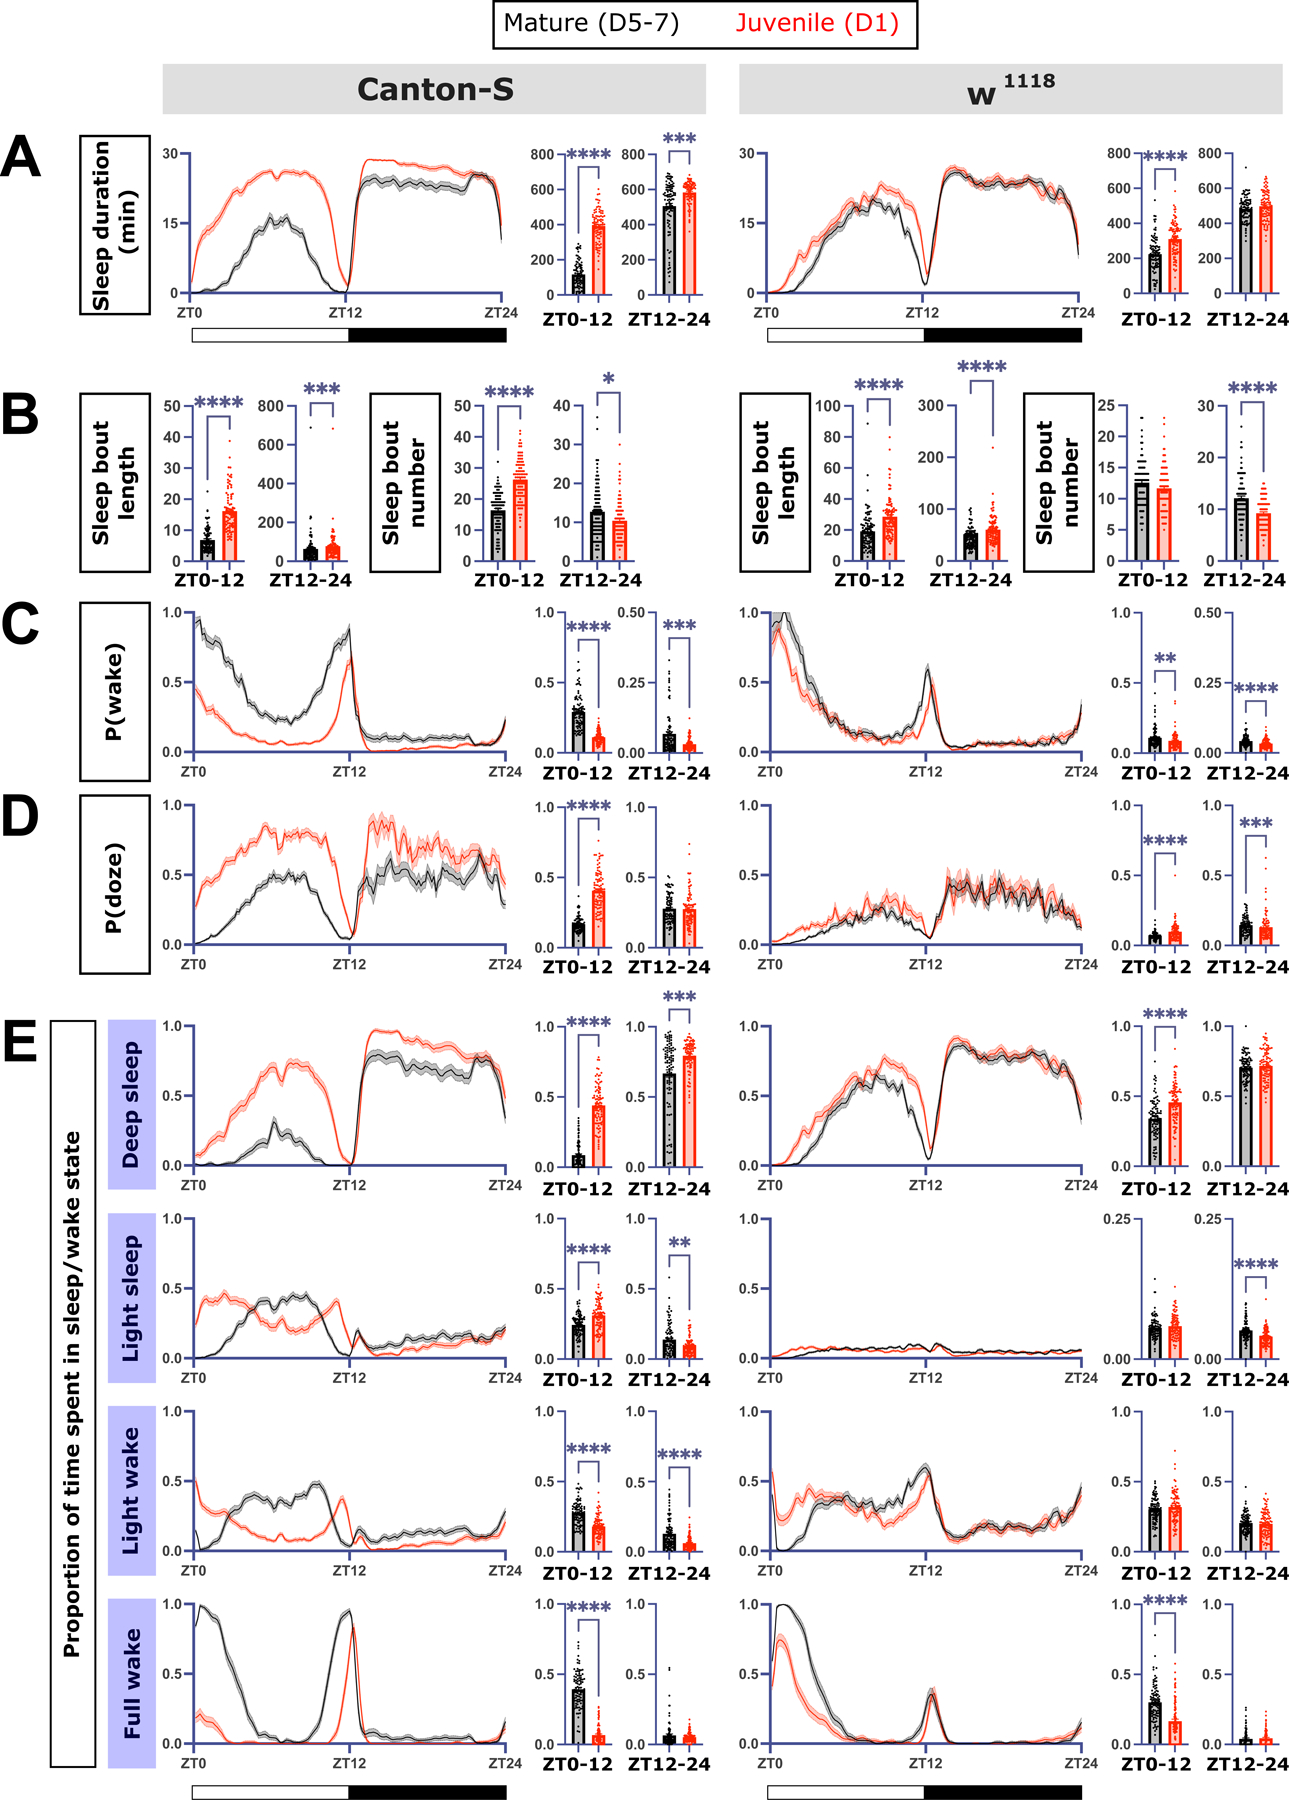
The maturation of sleep behavior across a lifespan (sleep ontogeny) is an evolutionarily conserved phenomenon. Mammalian studies have shown that in addition to increased sleep duration, early life sleep exhibits stark differences compared with mature sleep with regard to sleep states. How the intrinsic maturation of sleep output circuits contributes to sleep ontogeny is poorly understood. The fruit fly Drosophila melanogaster exhibits multifaceted changes to sleep from juvenile to mature adulthood. Here, we use a non-invasive probabilistic approach to investigate the changes in sleep architecture in juvenile and mature flies. Increased sleep in juvenile flies is driven primarily by a decreased probability of transitioning to wake and characterized by more time in deeper sleep states. Functional manipulations of sleep-promoting neurons in the dorsal fan-shaped body (dFB) suggest that these neurons differentially regulate sleep in juvenile and mature flies. Transcriptomic analysis of dFB neurons at different ages and a subsequent RNAi screen implicate the genes involved in dFB sleep circuit maturation. These results reveal that the dynamic transcriptional states of sleep output neurons contribute to the changes in sleep across the lifespan.

Keywords: Drosophila; central complex; development; dorsal fan-shaped body; ontogeny; ringer; sleep; sleep architecture.


Conflict of interest statement

Declaration of interests The authors declare no competing interests.

Figures

Figure 1:
Figure 1:. Excess deep sleep in juvenile flies results from decreased probability of transitioning from sleep to wake.
A) Sleep duration, B) average bout length, C) average bout number, D) P(wake), and E) P(doze) in mature (black, n = 87) vs juvenile (red, n = 82) iso31 flies. Left: sleep metric traces. Right: Quantification of sleep metrics across the lights-on (ZT0–12) or lights-off (ZT12–24) periods. F) Deep sleep (brown), light sleep (blue), light wake (green), and full wake (purple) traces in juvenile (left) and mature (right) iso31 flies. G) Quantification of proportion of time spent in each sleep stage across the lights-on or lights-off periods (Mann Whitney-U tests for all graphs in this figure). For this and all subsequent figures, sleep metric traces are generated from a rolling 30-minute window sampled every 10 minutes unless otherwise specified. See also Figure S1, S2, S3, S4, S5, and Table S1.
Figure 2:
Figure 2:. Ontogenetic changes in P(wake) and deep sleep are conserved across genetic backgrounds.
A) Sleep duration, B) average bout length and number, C) P(wake), and D) P(doze) in mature (black) vs juvenile (red) CS (left; n = 95 for mature and n = 93 for juvenile flies) and w1118 flies (right; n = 96 for mature and n = 95 for juvenile flies). (E) Proportion of time spent in deep sleep, light sleep, light wake, and full wake in juvenile and mature CS (left) and w1118 flies (right) Left: sleep metric traces. Right: Quantification of sleep metrics across the lights-on (ZT0–12) or lights-off (ZT12–24) periods (Mann Whitney tests for all graphs in this figure). See also Table S1.
Figure 3:
Figure 3:. The juvenile sleep state is distinct from homeostatic sleep rebound in mature flies.
A) Schematic of deprivation period and period of recorded rebound sleep in mature flies. B) Sleep duration, C) P(wake), D) P(doze), and proportion of time spent in E) deep sleep, F) light sleep, G) light wake, and H) full wake in non-deprived iso31 mature flies (black, n = 85), juvenile iso31 flies (red, n = 90), and rebounding mature iso31 flies (blue, n = 90) (Kruskal-Wallis test with post-hoc Dunn’s multiple comparison test). For figures B-H, data shown is from ZT0–24 after previous overnight ZT12–24 deprivation. Left: sleep metric traces. Right: quantification of sleep metrics binned into 3-hour windows across ZT0–24. See also Figure S6 and Table S1.
Figure 4:
Figure 4:. Activation of R23E10-GAL4+ neurons in mature flies does not fully recapitulate the juvenile sleep state.
A) Sleep duration, B) P(wake), and C) P(doze) sleep traces in R23E10-GAL4>UAS-TrpA1 (red, n = 53) flies and genetic controls (black, n = 51 and gray, n = 53). Gray bars at the top denote periods at 22°C, while red bars denote periods at 31°C. D) Formula used to calculate changes in sleep metrics. To account for differences in baseline sleep metrics at 22°C, changes in sleep metrics for individual flies was calculated. Change in E) sleep duration, F) average sleep bout length, G) sleep bout number, H) P(wake), and I) P(doze) across ZT0–12 and ZT12–24. Changes in the proportion of time spent in J) deep sleep, light sleep, light wake, and full wake in the setting of thermogenetic R23E10-GAL4 neuron activation (Kruskal-Wallis with post-hoc Dunn’s multiple comparison test). See also Table S1.
Figure 5:
Figure 5:. dFB inhibition decreases sleep duration in juvenile flies but does not recapitulate mature fly sleep architecture.
A) Formula used to calculate normalized sleep metric. Sleep was recorded in juvenile flies one day post-eclosion, and sleep metrics were normalized to the average of the baseline at 22°C. Sleep duration traces of B) juvenile and G) mature tubGAL80ts; R23E10-GAL4>UAS-Kir2.1 (blue) vs genetic controls (black and gray) at 22°C (left) and 31°C (right). Normalized C) sleep duration, D) P(wake), E) P(doze), and F) time spent in each sleep state in juvenile flies and mature flies (H, I, J, K, respectively). For juvenile flies, n = 75, 60, 54 from left to right. For mature flies, n = 28, 56, 58 from left to right (Kruskall-Wallis with post-hoc Dunn’s multiple comparison test). See also Table S1.
Figure 6:
Figure 6:. Ontogenetic changes in sleep architecture are lost in the setting of Pdm3 knockdown.
A) Sleep duration in mature (black) and juvenile (orange) in genetic controls and elav-GAL4>UAS-pdm3 RNAi flies (left to right) during ZT0–24, ZT0–12, and ZT12–24. B) Average sleep bout length and C) number during ZT0–12 and ZT12–24. D) P(wake), E) P(doze), and (F) proportion of time spent in deep sleep, light sleep, light wake, and full wake in genetic controls compared to elav-GAL4>UAS-pdm3 RNAi flies. From left to right, n = 46, 35, 101, 76, 103, 94 (Two-way ANOVA with post-hoc Sidak’s multiple comparison test). See also Table S1.
Figure 7:
Figure 7:. Ringer is involved in behavioral sleep maturation and the development of sleep-promoting dFB neurons.
A) DEGs based on published datasets. Purple: genes that are more highly expressed in juvenile vs mature flies, green: genes that are more highly expressed in mature vs juvenile flies, red: ringer expression in mature vs juvenile flies, based on an adjusted p-value cut-off (p-adj > 0.1). B) Total sleep duration, bout length, D) bout number, E) P(wake), F) P(doze), and G) proportion of time spent in deep sleep, light sleep, light wake, and full wake between ZT0–12 and ZT12–24 in R23E10-GAL4>UAS-ringer RNAi (red, n = 63) compared to R23E10-GAL4>UAS-mCherry RNAi (black, n = 64) and +; UAS-ringer RNAi controls (gray, n = 63) (Kruskall Wallis with post-hoc Dunn’s multiple comparison tests for B-G). H) Representative images of maximum intensity projections of z-stacks used to quantify R23E10-GAL4 projection volume in the dFB in R23E10-GAL4>UAS-mCherry RNAi controls (top) and R23E10-GAL4>UAS-ringer RNAi. White outlines on the right denote the borders of dFB projections in R23E10-GAL4>; UAS-mCherry RNAi control flies. I) Representative optical sections used to quantify dFB activity in 104y-GAL4>CaLexA; UAS-mCherry RNAi controls (left) and 104y-GAL4>CaLexA; UAS-ringer RNAi flies (right). Quantified dFB J) volume and K) activity in controls (black) and in the setting of ringer knockdown (red). For J and K, from left to right n = 24, 28, 17, 14 brains (Mann-Whitney tests for J and K). Scale bars = 20 µm. See also Figure S7, Table S1, Table S2, and Table S3.

Similar articles

Cited by

References

    1. Kayser MS, and Biron D (2016). Sleep and Development in Genetically Tractable Model Organisms. Genetics 203, 21–33. - PMC - PubMed
    1. Kayser MS, Yue Z, and Sehgal A (2014). A critical period of sleep for development of courtship circuitry and behavior in Drosophila. Science (New York, N.Y.) 344, 269–274. - PMC - PubMed
    1. Dilley LC, Vigderman A, Williams CE, and Kayser MS (2018). Behavioral and genetic features of sleep ontogeny in Drosophila. Sleep 41. - PMC - PubMed
    1. Roffwarg HP, Muzio JN, and Dement WC (1966). Ontogenetic Development of the Human Sleep-Dream Cycle. Science 152, 604–619. - PubMed
    1. Jouvet-Mounier D, Astic L, and Lacote D (1969). Ontogenesis of the states of sleep in rat, cat, and guinea pig during the first postnatal month. Developmental Psychobiology 2, 216–239. - PubMed

Publication types

Substances

LinkOut - more resources