. 2022 Sep 13;17(9):1959-1975.
doi: 10.1016/j.stemcr.2022.07.016. Epub 2022 Aug 18.

Rapid tissue prototyping with micro-organospheres

Affiliations

Rapid tissue prototyping with micro-organospheres

Zhaohui Wang et al. Stem Cell Reports. .

Abstract

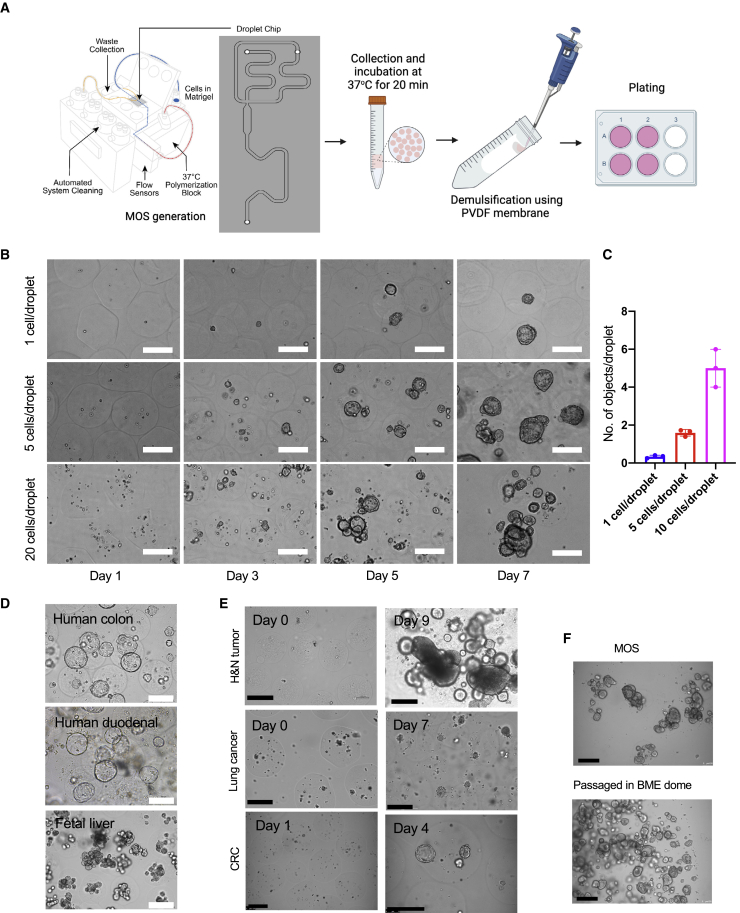
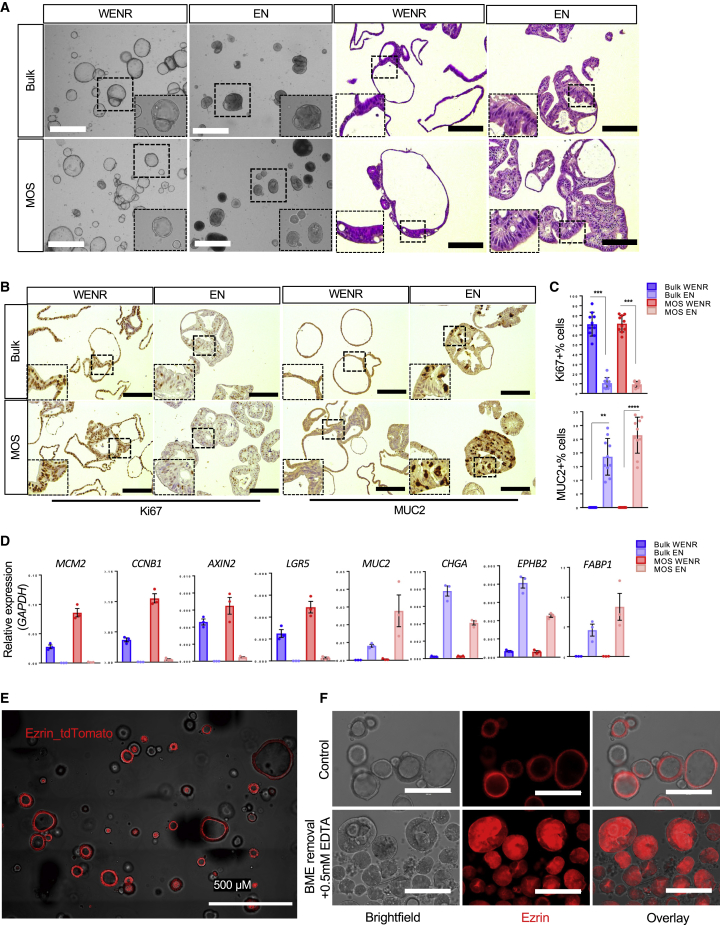
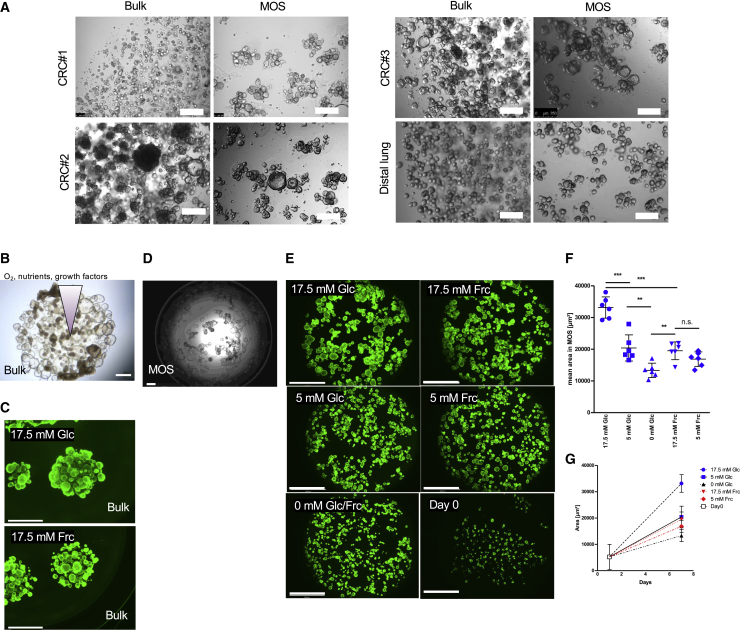
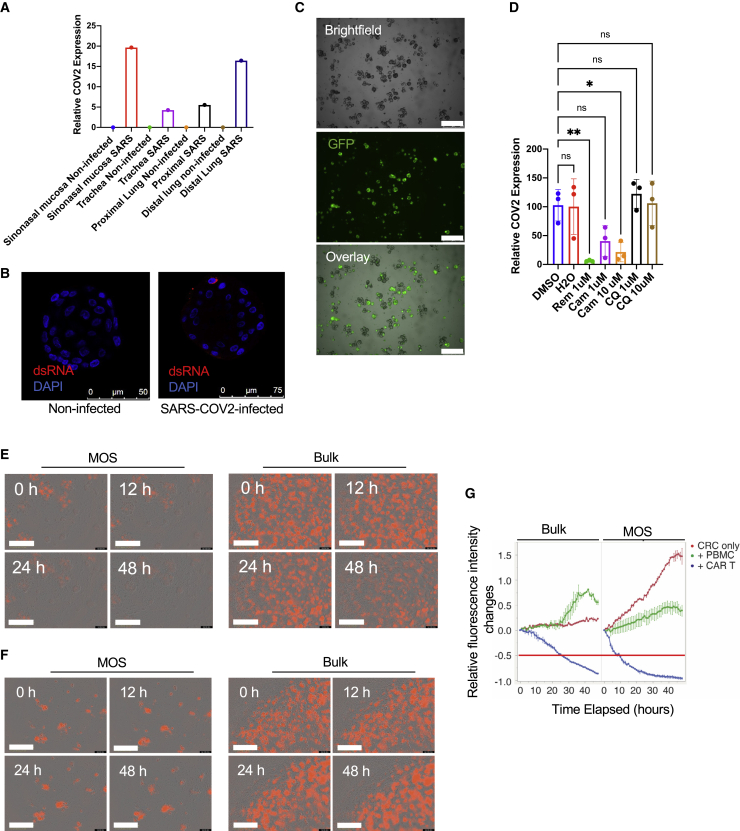
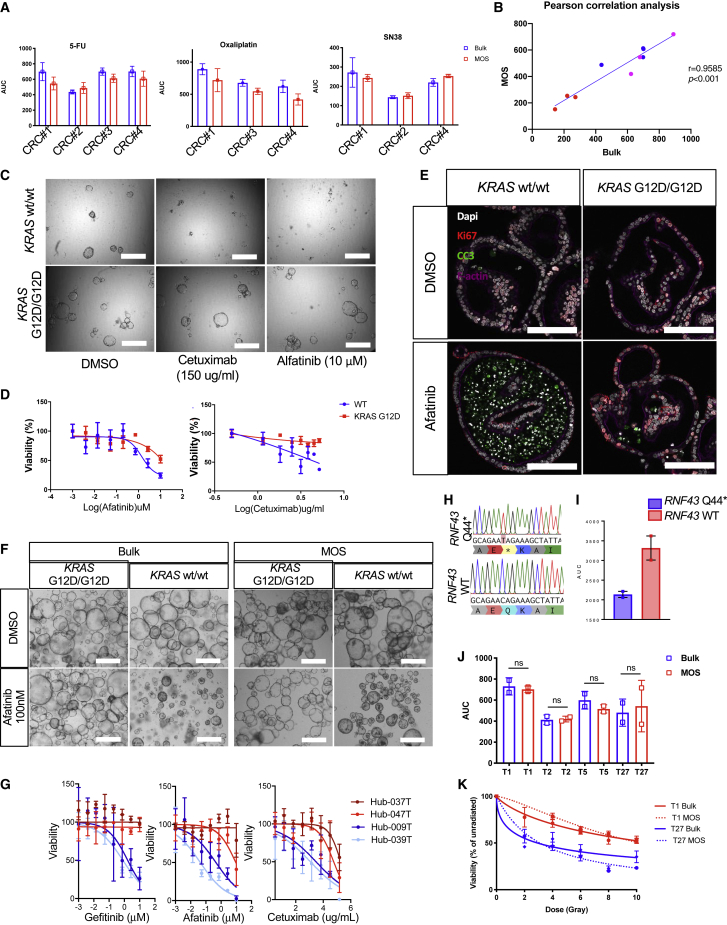
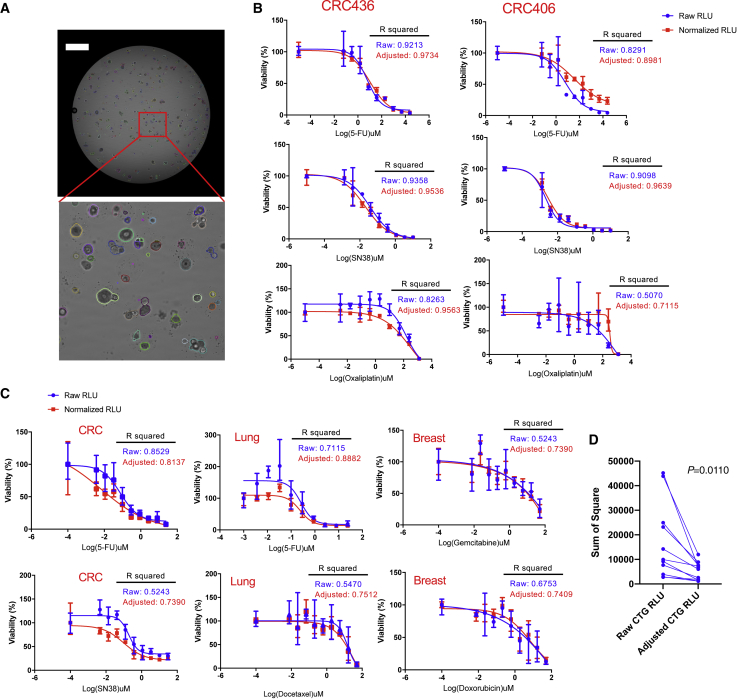
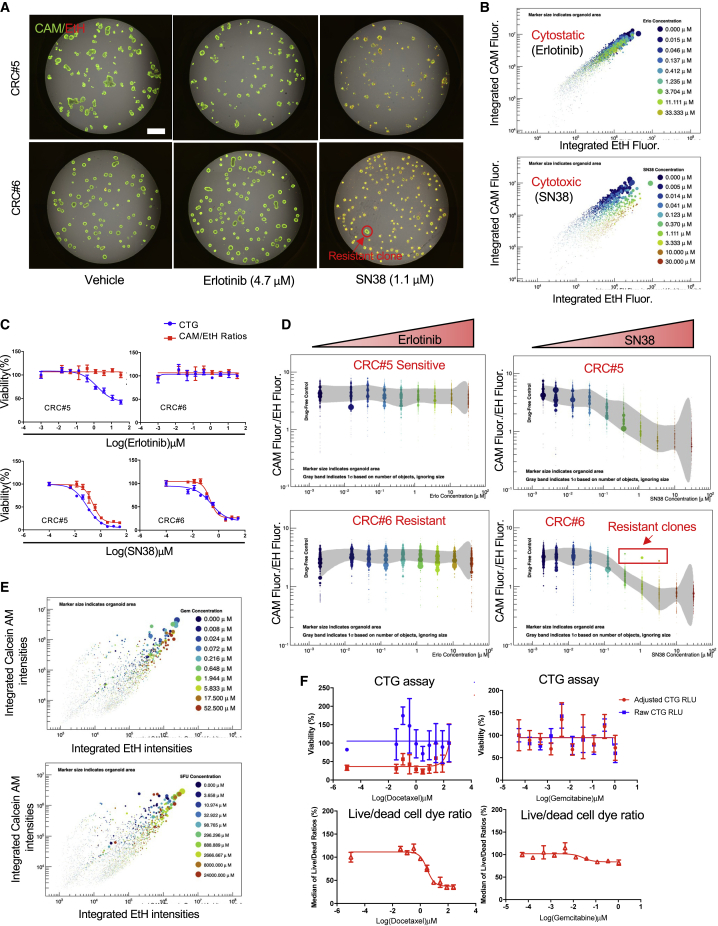
In vitro tissue models hold great promise for modeling diseases and drug responses. Here, we used emulsion microfluidics to form micro-organospheres (MOSs), which are droplet-encapsulated miniature three-dimensional (3D) tissue models that can be established rapidly from patient tissues or cells. MOSs retain key biological features and responses to chemo-, targeted, and radiation therapies compared with organoids. The small size and large surface-to-volume ratio of MOSs enable various applications including quantitative assessment of nutrient dependence, pathogen-host interaction for anti-viral drug screening, and a rapid potency assay for chimeric antigen receptor (CAR)-T therapy. An automated MOS imaging pipeline combined with machine learning overcomes plating variation, distinguishes tumorspheres from stroma, differentiates cytostatic versus cytotoxic drug effects, and captures resistant clones and heterogeneity in drug response. This pipeline is capable of robust assessments of drug response at individual-tumorsphere resolution and provides a rapid and high-throughput therapeutic profiling platform for precision medicine.

Keywords: CAR-T; SARS-COV-2; cytostatic; cytotoxic; deep learning; demulsification; drug resistant; micro-organospheres; organoid; patient derived organoid.


Conflict of interest statement

Conflicts of interest X.S., D.H., and H.C. are co-founders of Xilis, Inc. X.S. left Duke and joined Terasaki Institute and Xilis on November 9, 2021. H.C. is also a member of the board of directors of Roche. H.C.’s full disclosure is given at https://www.uu.nl/staff/JCClevers/. Z.W. recently left Duke University and joined Xilis, Inc. as a full-time employee. Patents WO2020242594, US 2021/0285054, and US 2022/006279 are related to this work.

Figures

Figure 1
Figure 1
Establishment of MOS (A) The schematic of MOS generator, chip design, and the workflow of the PVDF-based demulsification. (B) Representative images of CRC MOS at different cell seeding densities over the course of a week (scale bar: 200 μm). (C) The bar graphs showing the comparisons of the average number of tumorspheres per droplet established from three different initial cell densities. (D) Representative images of established MOSs derived from human colon, human duodenal, and fetal liver lines (scale bar: 200 μm). (E) Representative images of MOSs derived from human H&N tumor tissue, lung cancer, and CRC liver metastasis core needle biopsy (scale bar: 200 μm). (F) Representative images of MOSs before and after passaging into BME dome (scale bar: 200 μm). Scale bars: 200 μm.
Figure 2
Figure 2
Characterization of MOSs (A) Representative bright-field images of human colon bulk organoids and MOSs in expansion (WENR) and differentiation (EN) medium accompanied by H&E images of the same cultures (scale bar: 100 μm). (B) Representative staining of Ki67 and MUC2 for human colon bulk organoids and MOSs cultured in WENR and EN medium. (C) Bar graphs showing the quantification of the MUC2 and Ki67 staining (bars show the mean ± SEM of n = 10 different images). (D) Bar graphs representing gene expression of selected markers for MOS and bulk cultures in WENR versus EN medium (bars show the mean ± SEM of n = 3). (E) Representative confocal image of Ezrin reporter MOS (scale bar: 500 μm). (F) Representative images of the Ezrin reporter MOS under normal culture condition (top) or after BME removal (bottom) (scale bar: 200 μm).
Figure 3
Figure 3
MOSs enable uniform nutrient accessibility (A) Representative images of CRC#1, CRC#2, CRC#3, and a distal lung line growing in bulk organoid cultures or as MOSs (scale bar: 200 μm). (B) Duodenum organoids in BME dome in presence of 17.5 mM glucose (scale bar: 500 μm). (C) Duodenum organoids cultured in BME domes were stained with CAM (scale bar: 2,000 μm). (D) Duodenum organoids cultured in MOS in presence of 17.5 mM glucose (scale bar: 500 μm). (E) Representative images of duodenum MOSs after 0 or 7 days of treatment with different glucose (Glc) or fructose (Frc) concentrations (scale bar: 2,000 μm). MOSs were stained with CAM. (F and G) Image-based quantification of the green area visualized for each condition as mean values ± SD (n = 6 from two biological replicates) after 7 days (F) or over time (G).
Figure 4
Figure 4
MOS-based assays for viral infections and assessing CAR-T cell-mediated cytotoxicity (A) qRT-PCR measures the SARS-CoV-2 expression in the airway MOSs after 48 h of infection. (B) Representative images of double-strand RNA (dsRNA) immunofluorescence (IF) staining of non-infected and SARS-CoV-2-infected airway MOSs. (C) Representative images of airway MOSs after influenza infection for 24 h. GFP-positive spots indicate the influenza-infected MOSs (scale bar: 500 μm). (D) qRT-PCR measures the SARS-CoV-2 expression in sinonasal MOSs in response to the treatments of remdesivir, camostat, or CQ. p < 0.05; ∗∗p < 0.01; ns, not significant (bars show the mean ± SEM of n = 3 biological replicates). One-way ANOVA was used to determine the statistical significance. (E) Representative images from co-culture of HER2+ CRC MOSs (left) or bulk organoids (right) with anti-HER2 CAR-T cells over a 48 h period (scale bar: 500 μm). (F) Representative images from co-culture of HER2+ CRC MOSs (left) or bulk organoids (right) with PBMCs over a 48 h period (scale bar: 500 μm). (G) Time-course data from IncuCyte S3 for red fluorescent signal with bulk organoid comparison. The red horizontal line indicates the 50% decrease of red fluorescence intensities compared with time 0.
Figure 5
Figure 5
Response to chemo-, irradiation, and targeted therapy (A) AUCs of the CRC organoid cultures generated as bulk organoids or MOSs after being exposed to increasing dosages of 5-FU, oxaliplatin, and SN38 in CRC lines (error bars show the mean ± SEM, n = 3). (B) The linear correlations of the AUC detected from bulk and MOS treated conditions. Red dots, SN38; blue dots, 5-FU; magenta dots, oxaliplatin. (C) Representative images of the paired KRAS isogeneic lines treated with vehicle or cetuximab and afatinib (scale bar: 100 μm). (D) The dose-dependent drug response curves of the paired KRAS isogenic lines in response to the treatments of cetuximab and afatinib; (error bars show the mean ± SEM, n = 3). (E) Ki67 and cleaved caspase 3 (CC3) co-staining showing decreased proliferation and increased apoptosis for KRAS wild-type (WT) MOSs treated with 100 nM afatinib for 3 days (scale bar: 100 μm). (F) Bright-field images of bulk organoids and MOSs treated with 100 nM afatinib for 3 days (scale bar: 100 μm). (G) The dose-dependent drug response curves of four CRC PDO cultures generated as MOSs after exposure to increasing dosages of cetuximab, afatinib, and gefitinib (bars show the mean ± SEM, n = 3). (H) Targeted sequencing of a portion of the exon 1 of RNF43 showing one sample with a C>T transition resulting in a Q44 mutation. (I) Bar graphs showing the AUCs calculated for the IWP2 drug screen performed on RNF43 WT and RNF43 mutant lines, the latter of which is highly sensitive to the compound (bars show the mean ± SEM of two independent biological replicates). (J) AUC of four PDOs generated as MOSs (red) or bulk organoids (blue) after exposure to increasing dosages of irradiation. (K) Dose-response curves displaying viability of two PDOs generated as bulk organoid (solid line) or MOSs (dotted line) exposed to increasing dosages of irradiation. PDOs were originally generated from patients with HNSCC that relapsed (red) or did not relapse (blue) clinically to treatment with irradiation. Bars show the mean ± SD. n = 3, and each experiment was repeated twice. Paired t test was used to determine no significance (ns).
Figure 6
Figure 6
MOS coupled with machine learning enables a tSA-based normalization strategy for improving the robustness of bulk drug assay (A) A representative image of a whole-well scanning and a zoom-in view showing the segmented objects detected by in-house machine-learning algorithm (scale bar: 1,000 μm). (B) Comparisons of drug response curves measured by CTG assay before and after normalization with day 0 tSA in two established CRC PDO lines. CRC406 and CRC436 MOS were treated with SN38, 5-FU, and oxaliplatin for 3 days. The blue curve shows the unnormalized data points, and the red curve shows the data points after normalization. The error bars indicate the ranges of the data derived from three independent replicates. (C) Comparisons of drug response curves measured by CTG assay before and after normalization with day 0 tSA in lung, CRC, and breast cancer primary tissue-derived MOSs. The lung MOS line was treated with 5-FU or docetaxel for 3 days. The CRC MOS line was treated with 5-FU or SN38 for 3 days, and the breast MOS line was treated with gemcitabine or doxorubicin for 3 days. The blue curve shows the unnormalized data points, and the red curve shows the data points after normalization. The error bars indicate the ranges of the data derived from three replicate wells. (D) Comparison of the difference between the means; each point of data is indicated by the sum of square after normalization (p = 0.011, paired two-tailed t test).
Figure 7
Figure 7
An orthogonal AI-based analysis approach to differentiate the cytostatic/cytotoxic drug effects and capture heterogeneous drug response at individual-tumorsphere/organoid resolution (A) Representative images of two CRC MOS treated with vehicle, erlotinib, or SN38, co-stained with live cell dye (CAM) and dead cell dye (EtH). The red circle highlights a resistant clone discovered in CRC#6 treated with SN38 (scale bar: 1,000 μm). (B) Scatterplots show the differential drug responsive patterns of CRC#5 treated with of erlotinib (cytostatic) or SN38 (cytotoxic) respectively at the individual organoid resolution. The size of each dot reflects the relative surface area of the individual segmented object. (C) The drug response curves of two CRC MOS models treated with erlotinib or SN38. Blue curves were plotted based on CTG assay and red curves were plotted based on the median ratios of CAM/EtH dye integrated intensities. (D) Scatterplots show the dose-dependent changes of the ratios of CAM/EtH dye integrated intensities of CRC#6 and CRC#5 treated with erlotinib or SN38, respectively. The red rectangle highlights the drug-resistant clones identified in the CRC#6 treated with SN38. The x axis indicates the range of drug concentrations. The size of each dot reflects the relative surface area of the individual segmented object. Gray band indicates 1σ based on number of objects, ignoring size. (E) Scatterplots show how the individual tumorspheres responded to 3 days of gemcitabine or 5-FU treatment in a primary lung tumor-derived MOS. (F) The comparisons of drug response curves measured by CTG assay (top panel) versus median of live/dead cell dye ratios (bottom panel) in a sarcoma primary tissue-derived MOS.

Similar articles

Cited by

References

    1. Allazetta S., Lutolf M.P. Stem cell niche engineering through droplet microfluidics. Curr. Opin. Biotechnol. 2015;35:86–93. doi: 10.1016/j.copbio.2015.05.003. - DOI - PubMed
    1. Artegiani B., Hendriks D., Beumer J., Kok R., Zheng X., Joore I., Chuva de Sousa Lopes S., van Zon J., Tans S., Clevers H. Fast and efficient generation of knock-in human organoids using homology-independent CRISPR–Cas9 precision genome editing. Nat. Cell Biol. 2020;22:321–331. doi: 10.1038/s41556-020-0472-5. - DOI - PubMed
    1. Beumer J., Artegiani B., Post Y., Reimann F., Gribble F., Nguyen T.N., Zeng H., Van den Born M., Van Es J.H., Clevers H. Enteroendocrine cells switch hormone expression along the crypt-to-villus BMP signalling gradient. Nat. Cell Biol. 2018;20:909–916. doi: 10.1038/s41556-018-0143-y. - DOI - PMC - PubMed
    1. Boretto M., Maenhoudt N., Luo X., Hennes A., Boeckx B., Bui B., Heremans R., Perneel L., Kobayashi H., Van Zundert I., et al. Patient-derived organoids from endometrial disease capture clinical heterogeneity and are amenable to drug screening. Nat. Cell Biol. 2019;21:1041–1051. doi: 10.1038/s41556-019-0360-z. - DOI - PubMed
    1. Bose S., Clevers H., Shen X. Promises and challenges of organoid-guided precision medicine. Med. 2021;2:1011–1026. doi: 10.1016/j.medj.2021.08.005. - DOI - PMC - PubMed

Publication types

Substances