. 2022 Sep 14;30(9):1295-1310.e8.
doi: 10.1016/j.chom.2022.07.015. Epub 2022 Aug 18.

Faecalibaculum rodentium remodels retinoic acid signaling to govern eosinophil-dependent intestinal epithelial homeostasis

Affiliations

Faecalibaculum rodentium remodels retinoic acid signaling to govern eosinophil-dependent intestinal epithelial homeostasis

Y Grace Cao et al. Cell Host Microbe. .

Abstract

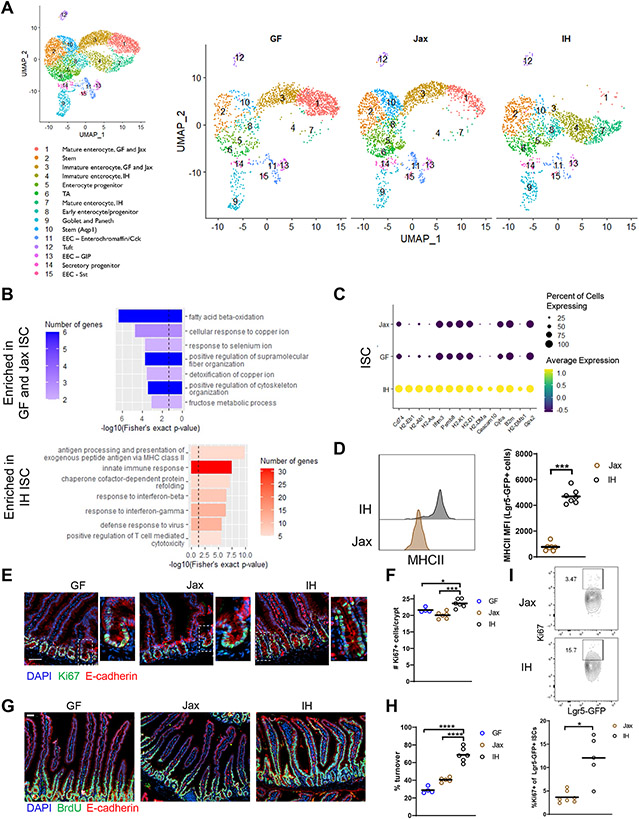
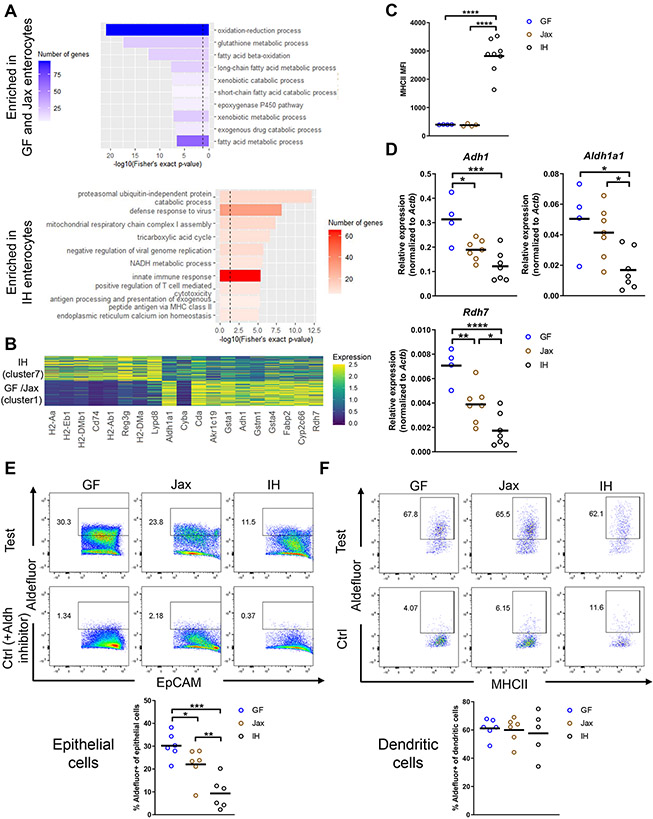
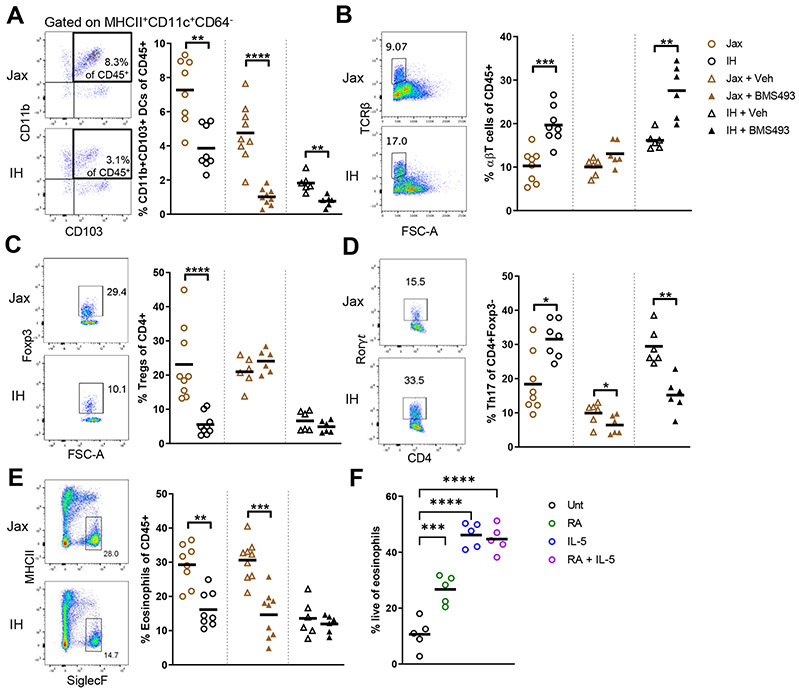
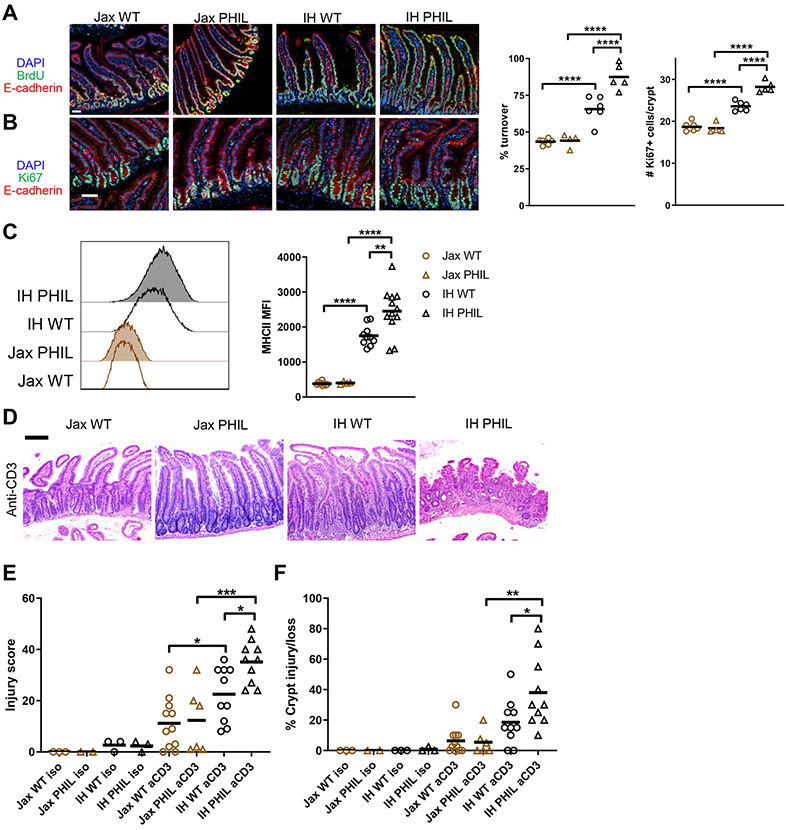
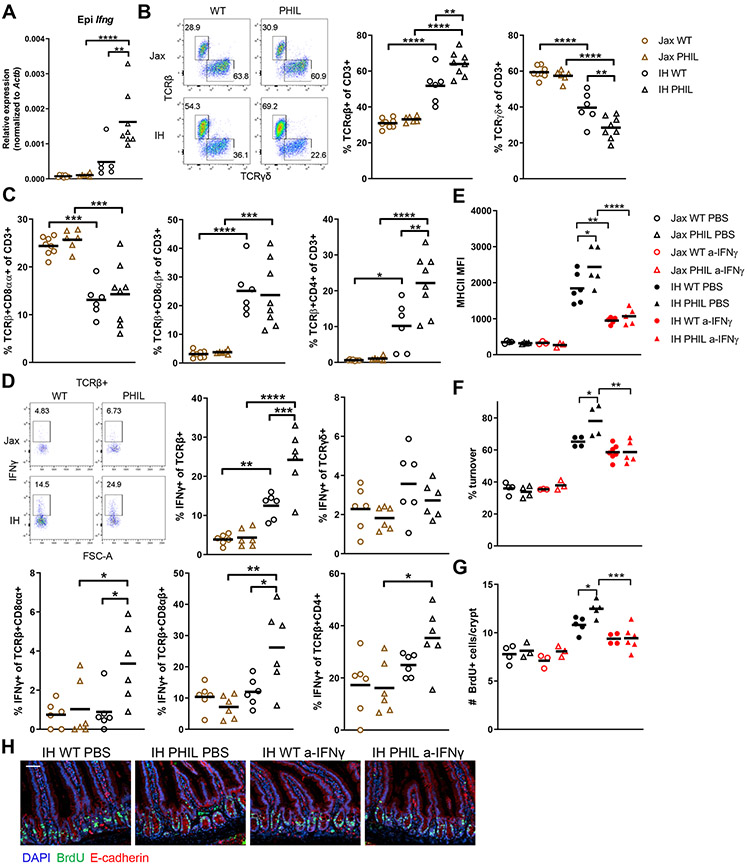
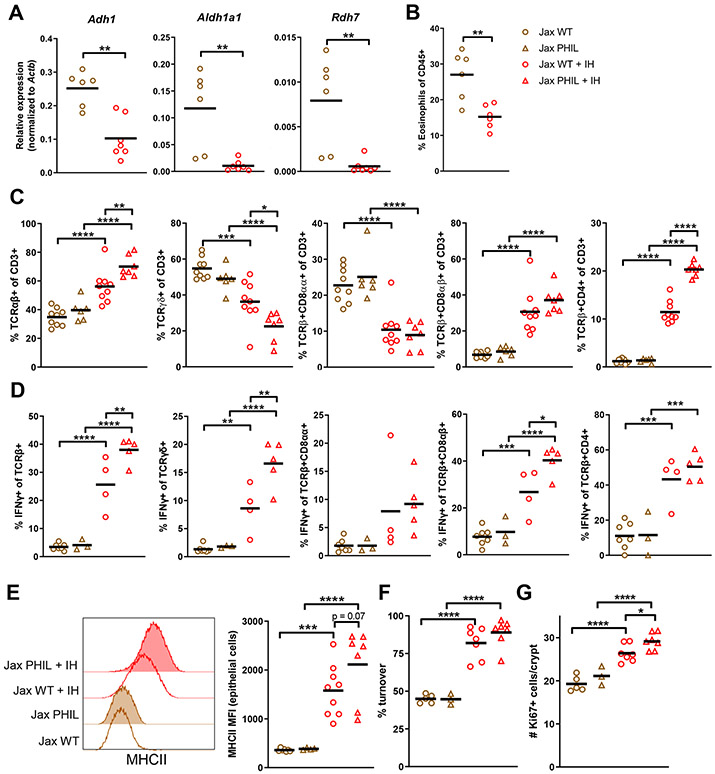
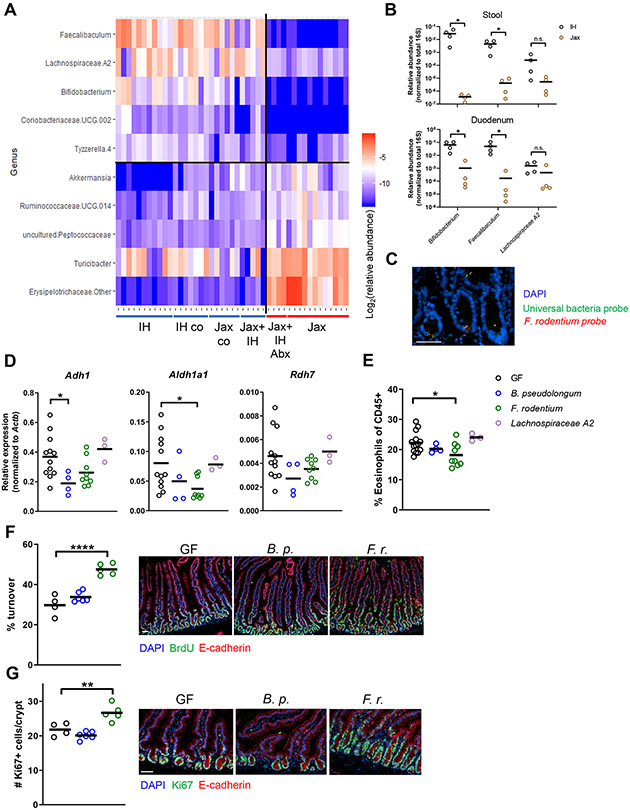
The intestinal epithelium plays critical roles in sensing and integrating dietary and microbial signals. How microbiota and intestinal epithelial cell (IEC) interactions regulate host physiology in the proximal small intestine, particularly the duodenum, is unclear. Using single-cell RNA sequencing of duodenal IECs under germ-free (GF) and different conventional microbiota compositions, we show that specific microbiota members alter epithelial homeostasis by increasing epithelial turnover rate, crypt proliferation, and major histocompatibility complex class II (MHCII) expression. Microbiome profiling identified Faecalibaculum rodentium as a key species involved in this regulation. F. rodentium decreases enterocyte expression of retinoic-acid-producing enzymes Adh1, Aldh1a1, and Rdh7, reducing retinoic acid signaling required to maintain certain intestinal eosinophil populations. Eosinophils suppress intraepithelial-lymphocyte-mediated production of interferon-γ that regulates epithelial cell function. Thus, we identify a retinoic acid-eosinophil-interferon-γ-dependent circuit by which the microbiota modulates duodenal epithelial homeostasis.

Keywords: Faecalibaculum rodentium; duodenum; eosinophil; interferon-γ; intestinal epithelial cell; microbiota; retinoic acid; small intestine.


Conflict of interest statement

Declaration of interests W.S.G. is on the SAB of Senda Biosciences, Freya Biosciences, and Artizan Biosciences, all outside the current work.

Figures

Figure 1.
Figure 1.. Certain microbiota features regulate intestinal stem cell proliferation and epithelial turnover
(A) UMAP representation of scRNAseq of sorted live EpCAM+CD45Ter119CD31 IECs. n=1. TA, transit amplifying; EEC, enteroendocrine. (B) GO categories for DEGs enriched in IH vs GF and Jax ISCs (dashed line indicates p value = 0.05). (C) Top DEGs in IH vs GF and Jax ISCs ranked by significance. (D) MHCII expression in ISCs. (E) Representative images (higher magnification on right) (scale bar 50 μm) and (F) quantification of Ki67+ cells. (G) Representative images (scale bar 50 μm) and (H) quantification of epithelial turnover after 48h continuous BrdU labeling. (I) Representative plots and quantification of Ki67 expression in Lgr5-GFP ISCs. Each symbol (D, F, H, I) represents data from an individual mouse. Data are pooled from 2-3 experiments (D, F, H, I). Data are shown as mean with individual data points. *p < 0.05, **p < 0.01, ***p < 0.001, Mann-Whitney U test (D, I), one-way ANOVA with Holm-Sidak’s post-test (F, H). See also Figures S1, S2, Table S1.
Figure 2.
Figure 2.. The microbiota modulates enterocyte phenotypes and retinoic acid production
(A) GO categories of DEGs in GF/Jax and IH enterocytes (clusters 1 and 7, dashed line indicates p value = 0.05). (B) Top DEGs in GF/Jax and IH enterocytes ranked by significance. (C) MHCII MFI in total IECs. (D) mRNA expression in epithelial fraction. (E-F) Measurement of Aldh enzyme activity via Aldefluor assay in duodenal IECs (EpCAM+CD45) or dendritic cells (CD45+CD11c+MHCII+CD64). Control samples included an Aldh inhibitor (DEAB). Gating strategy as in Fig. S2E and Fig. S4A. Each symbol (C-F) represents data from an individual mouse. Data reflect at least 2 independent experiments (C-F). Data are shown as mean with individual data points. *p < 0.05, **p < 0.01, ***p < 0.001, ****p < 0.0001, one-way ANOVA with Holm-Sidak’s post-test (C-F). See also Figure S3.
Figure 3.
Figure 3.. Differential epithelial cell production of retinoic acid in Jax and IH mice regulates intestinal immune populations
(A-E) Flow cytometric profiling of lamina propria immune populations at steady state, or after treatment with 220μmg RAR inhibitor BMS493 or vehicle (DMSO) for 8 days. (F) Live eosinophils measured by flow cytometry after 24h culture of sorted bone marrow eosinophils with 10ng/mL IL-5, 100nM RA, or both. Each symbol represents data from an individual mouse. Data reflect at least 2 independent experiments. Data are shown as mean with individual data points. *p < 0.05, **p < 0.01, ***p < 0.001, ****p < 0.0001, Mann-Whitney U test (A-E), one-way ANOVA with Holm-Sidak’s post-test (F). See also Figures S4, S5.
Figure 4.
Figure 4.. Eosinophils regulate epithelial cell turnover, MHCII expression, and response to injury
Representative images (scale bar 50 μm) and quantification of (A) Epithelial turnover after 48h continuous BrdU labeling and (B) Ki67+ cells. (C) MHCII expression on epithelial cells. (D) Representative hematoxylin and eosin staining (scale bar 200 μM), (E) Histological injury score, and (F) Percent crypt injury/loss in duodenum on day 3 after injection of anti-CD3. Each symbol represents data from an individual mouse. Data reflect at least 3 independent experiments. Data are shown as mean with individual data points. *p <= 0.05, **p < 0.01, ***p < 0.001, ****p < 0.0001, two-way ANOVA with Holm-Sidak’s post-test.
Figure 5.
Figure 5.. Eosinophils suppress IFN-γ-producing IEL subsets to regulate epithelial cell turnover and MHCII expression in a microbiota-dependent manner
(A) Ifng mRNA expression in epithelial fraction. (B-C) Flow cytometric profiling of IEL populations. (D) IFN-γ production by IEL populations. (E) IEC MHCII expression, (F) Epithelial turnover after 48h continuous BrdU labeling, and (G-H) BrdU+ cells after 2h short-term labeling in mice treated every other day for 8 days with 200μg anti-IFN-γ neutralizing Ab or PBS. Each symbol represents data from an individual mouse. Data reflect at least 2 independent experiments. Data are shown as mean with individual data points. *p<0.05, **p < 0.01, ***p < 0.001, ****p < 0.0001, two-way ANOVA with Holm-Sidak’s post-test. See also Figure S6.
Figure 6.
Figure 6.. IH microbiota regulates epithelial-eosinophil crosstalk
Jax mice received one transfer of IH microbiota contents via gavage. (A) mRNA expression in epithelial fraction 3 wks post-transfer. (B) Eosinophil levels 2 wks post-transfer. (C) IEL subsets and (D) IEL IFN-γ production 3 wks post-transfer. (E) MHCII expression on IECs 3 wks post-transfer. (F) Epithelial turnover after 48h continuous BrdU labeling and (G) Ki67+ cells 4 wks post-transfer. Each symbol represents data from an individual mouse. Data reflect at least 2 independent experiments. Data are shown as mean with individual data points. *p < 0.05, **p < 0.01, ***p < 0.001, ****p < 0.0001, Mann-Whitney U test (A-B), two-way ANOVA with Holm-Sidak’s post-test (C-G). See also Figure S6.
Figure 7.
Figure 7.. 16S rRNA gene amplicon survey analysis identifies Faecalibaculum as a regulator of a retinoic acid-eosinophil-epithelial circuit
(A) Heatmap of differentially abundant genera identified by LefSE analysis of 16S rRNA gene amplicon sequencing of stool from different microbiota conditions. (B) Colonization levels in gut regions determined by qPCR. (C) 16S FISH for F. rodentium in IH duodenum. (D-G) GF mice were mono-colonized for 2 wks. (D) mRNA expression in epithelial fraction. (E) Eosinophil levels measured by flow cytometry. (F) Epithelial turnover after 48h continuous BrdU labeling. (G) Ki67+ cells. Each symbol (B, D-G) represents data from an individual mouse. Data reflect at least 2 independent experiments. Data are shown as mean with individual data points. *p < 0.05, Mann-Whitney U test (B), one-way ANOVA with Holm-Sidak’s post-test (D-G). See also Figure S7.

References

    1. Alexa A, Rahnenführer J, and Lengauer T (2006). Improved scoring of functional groups from gene expression data by decorrelating GO graph structure. Bioinformatics 22, 1600–1607. - PubMed
    1. Allaire JM, Crowley SM, Law HT, Chang S-Y, Ko H-J, and Vallance BA (2018). The Intestinal Epithelium: Central Coordinator of Mucosal Immunity. Trends Immunol. 39, 677–696. - PubMed
    1. Arnold IC, Artola-Borán M, Tallón de Lara P, Kyburz A, Taube C, Ottemann K, van den Broek M, Yousefi S, Simon H-U, and Müller A (2018). Eosinophils suppress Th1 responses and restrict bacterially induced gastrointestinal inflammation. J. Exp. Med. jem 20172049. - PMC - PubMed
    1. Balmer JE, and Blomhoff R (2002). Gene expression regulation by retinoic acid. J. Lipid Res 43, 1773–1808. - PubMed
    1. Beyaz S, Chung C, Mou H, Bauer-Rowe KE, Xifaras ME, Ergin I, Dohnalova L, Biton M, Shekhar K, Eskiocak O, et al. (2021). Dietary suppression of MHC class II expression in intestinal epithelial cells enhances intestinal tumorigenesis. Cell Stem Cell 28, 1922–1935.e5. - PMC - PubMed

Supplementary concepts

LinkOut - more resources