. 2022 Sep 12;40(9):957-972.e10.
doi: 10.1016/j.ccell.2022.07.012. Epub 2022 Aug 18.

A druggable addiction to de novo pyrimidine biosynthesis in diffuse midline glioma

Affiliations

A druggable addiction to de novo pyrimidine biosynthesis in diffuse midline glioma

Sharmistha Pal et al. Cancer Cell. .

Abstract

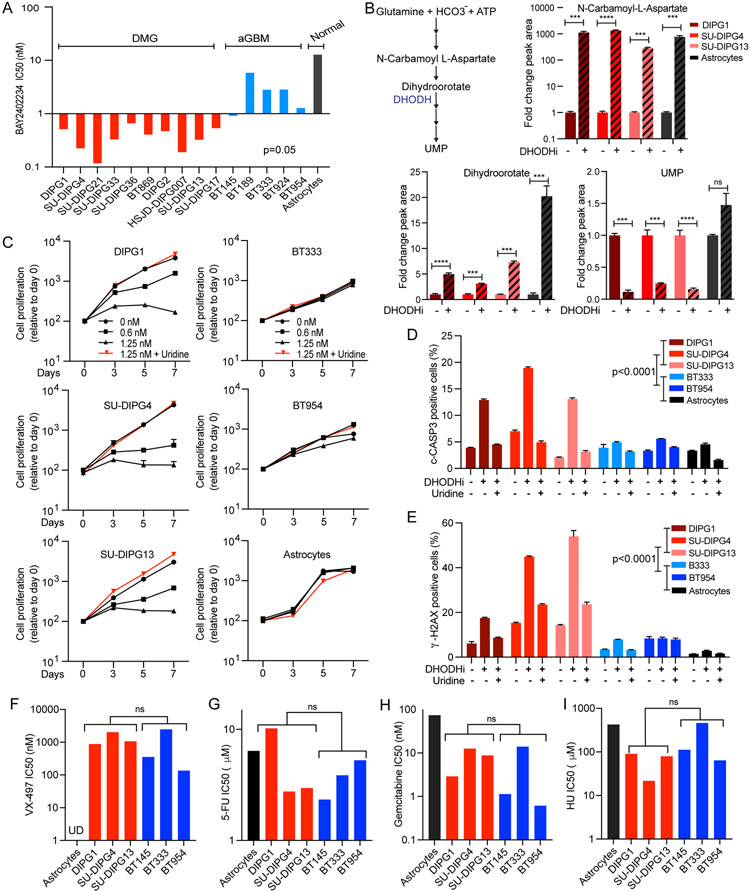
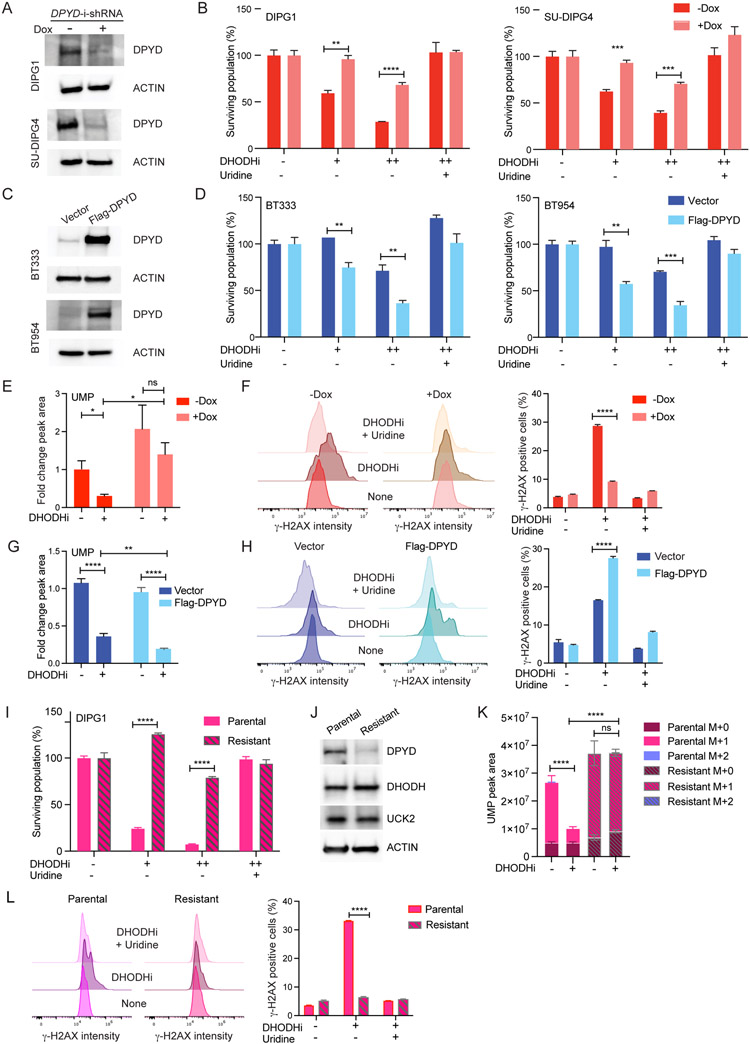
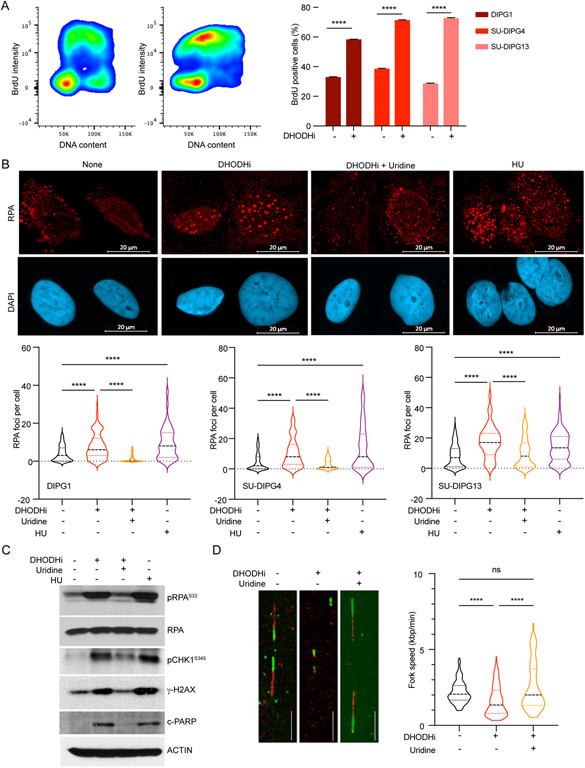
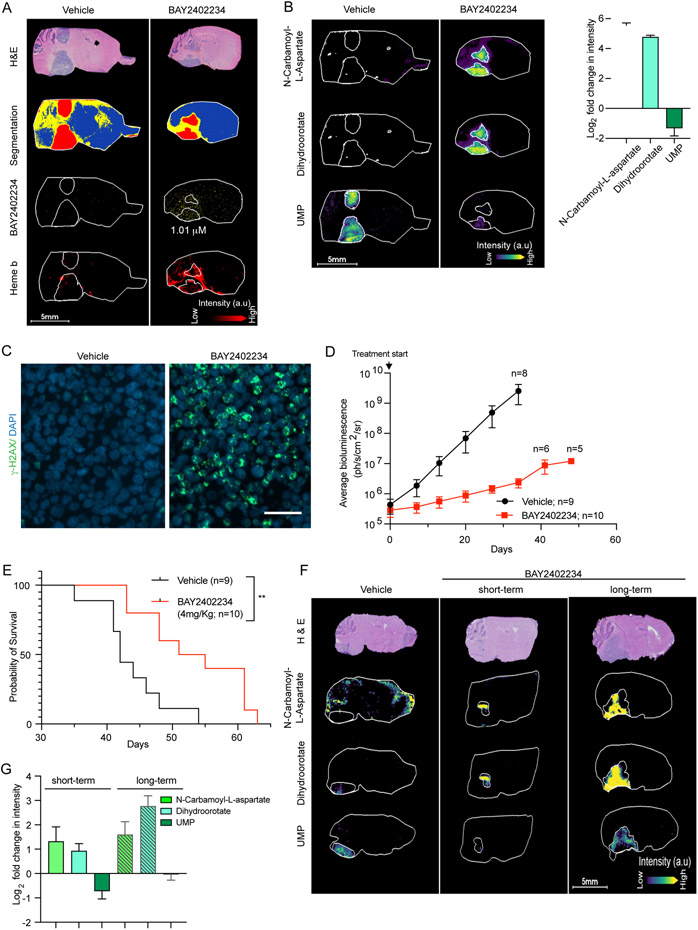
Diffuse midline glioma (DMG) is a uniformly fatal pediatric cancer driven by oncohistones that do not readily lend themselves to drug development. To identify druggable targets for DMG, we conducted a genome-wide CRISPR screen that reveals a DMG selective dependency on the de novo pathway for pyrimidine biosynthesis. This metabolic vulnerability reflects an elevated rate of uridine/uracil degradation that depletes DMG cells of substrates for the alternate salvage pyrimidine biosynthesis pathway. A clinical stage inhibitor of DHODH (rate-limiting enzyme in the de novo pathway) diminishes uridine-5'-phosphate (UMP) pools, generates DNA damage, and induces apoptosis through suppression of replication forks-an "on-target" effect, as shown by uridine rescue. Matrix-assisted laser desorption/ionization (MALDI) mass spectroscopy imaging demonstrates that this DHODH inhibitor (BAY2402234) accumulates in the brain at therapeutically relevant concentrations, suppresses de novo pyrimidine biosynthesis in vivo, and prolongs survival of mice bearing intracranial DMG xenografts, highlighting BAY2402234 as a promising therapy against DMGs.

Keywords: ATR; BAY2402234; DHODH; DPYD; de novo pyrimidine synthesis; diffuse intrinsic pontine glioma; diffuse midline glioma; elimusertib; pyrimidine degradation; replication stress.


Conflict of interest statement

Declaration of interests N.Y.R.A. is key opinion leader for Bruker Daltonics, scientific advisor to Invicro, and receives support from Thermo Finnegan and EMD Serono. S.K.M. has served as a paid advisor to Agios Pharmaceuticals. The other authors declare no competing interests.

Figures

Figure 1.
Figure 1.. Genome-wide CRISPR screen identifies pathways critical for DMG cell survival
(A) Venn diagram shows overlap of genes identified as DMG dependencies in three tested DMG cell lines. (B) Ingenuity pathway analysis (IPA) defines DMG dependency pathways based on genes scored as dependency genes in at least two DMG cell lines. (C) Schematic of the de novo and salvage pathways for pyrimidine biosynthesis. (D) Volcano plots showing genes belonging to the Gene Ontology Resource (GO) pathway of pyrimidine biosynthesis (including uridine-5'-phosphate biosynthesis) whose depletion is significantly associated with DMG cell death (blue dots). (E) DMG cell proliferation following knockdown of de novo pyrimidine synthesis genes, CAD and DHODH, using two distinct shRNAs for each gene, relative to control (scr) shRNA. Data are represented as mean ± SEM (n=4). See also Figure S1 and Tables S1 and S2.
Figure 2.
Figure 2.. The DHODH inhibitor, BAY2402234, inhibits de novo pyrimidine synthesis and induces DNA damage and apoptosis specifically in DMGs compared to aGBMs and astrocytes; a differential sensitivity not observed towards de novo GMP synthesis inhibitor and chemotherapy agents.
(A) DMG, adult GBM (aGBM), and immortalized human astrocytes (normal) were treated with increasing doses of BAY2402234 in quadruplicate for 5 days and IC50 values were determined using PRISM software. p=0.05, unpaired t-test of IC50 values for DMG vs aGBM. (B) Schematic representation of metabolites and DHODH in de novo pyrimidine biosynthesis (left). Liquid chromatography-tandem mass spectrometry (LC-MS/MS) analysis of control and BAY2402234 (DHODHi;1.25 nM, 24 hours) treated DMG cells. Bar graph show fold-change relative to control sample (mean ± SEM, n=3; * p<0.05, ** p<0.01, *** p<0.001, **** p<0.0001, unpaired t-test). (C) Proliferation of DMG, aGBM, and immortalized human astrocytes treated with increasing doses of BAY2402234 (DHODHi) as well as combination of 1.25 nM BAY2402234 plus exogenous uridine (100 μM). Data are plotted as mean ± SEM (n=4). (D and E) Apoptosis and DNA damage, as measured by flow cytometry for cleaved CASPASE-3 (c-CASP3)- and γ-H2AX-positive cells, respectively, in BAY2402234-treated (DHODHi; 1.25 nM, 48 hours) DMG, aGBM, and immortalized astrocytes cells with or without uridine supplementation (100 mM). Data show mean ± SEM (n=3), unpaired t-test. (F-I) DMG and aGBM cells were treated with increasing doses of (F) de novo GMP synthesis inhibitor (VX-497), (G) 5-fluorouracil (5-FU), (H) gemcitabine, and (I) hydroxyurea (HU) for 5 days in quadruplicate and IC50 values determined by PRISM software. ns represents not significant p value in unpaired t-test of IC50 for DMG versus aGBM groups. See also Figure S2 and Table S3.
Figure 3.
Figure 3.. DMG exhibit increased flux through de novo pyrimidine biosynthesis and pyrimidine degradation, leading to profound depletion of UMP following de novo biosynthesis inhibition by BAY2402234.
(A and B) Fold change in UMP and N-carbamoyl-L-aspartate in DMG and aGBM lines treated with BAY2402234 (DHODHi; 1.25 nM, 24 hours) (n=3). DMG and aGBM groups compared using unpaired t-test; ** p<0.01, ns- not significant. (C) Peak area of unlabeled (M+0) and labelled 15N-UMP (M+1) in SU-DIPG13 (DMG) and BT954 (aGBM) following 12 hours of exposure to media containing 15N-glutamine with or without BAY2402234 (DHODHi). For DHODHi samples, cells were pretreated with BAY2402234 for 16 hours prior to switching to media containing 15N-glutamine. * p<0.05 and ** p<0.01 for the comparisons of indicated M+1 peak areas, ANOVA with Tukey’s multiple comparison test. (D) Schematic of 15N-glutamine flux through de novo and salvage pyrimidine biosynthesis and pyrimidine degradation pathways. (E-H) Flux through pyrimidine degradation represented as peak areas of labeled 15N-uridine (M+1) and 15N-3-ureidopropionate (M+1) in SU-DIPG13 and BT954 exposed to media containing 15N-glutamine for specified times, as indicated. Panels F and H show area under the curve (unpaired t-test; *p<0.05 and **p<0.01). See also Figure S3.
Figure 4.
Figure 4.. DPYD expression modulates sensitivity to BAY2402234.
(A) Western blot analyses of extracts from DIPG1 and SU-DIPG4 cells expressing doxycycline-inducible shRNA against DPYD with or without doxycycline (Dox; 500 ng/ml) treatment for 72 hours. (B) DMG cells as in Panel 4A were treated with BAY2402234 (DHODHi; +1 nM, ++2 nM for DIPG1; +0.5 nM, ++1 nM for SU-DIPG4), with or without uridine supplementation (100 μM), for 72 hours and surviving populations quantified. Unpaired t-test, ** p<0.01, *** p<0.001, **** p<0.0001. (C) Western blot analyses of extracts from aGBM lines BT333 and BT954 expressing Flag-DPYD or empty vector as control. (D) aGBM cells as in Panel 4C were treated with BAY2402234 (DHODHi; +1.25 nM, ++2.5 nM for BT333; +0.5 nM, ++1 nM for BT954), with or without uridine supplementation (100 μM), for 6 days and surviving populations quantified. Unpaired t-test, ** p<0.01, *** p<0.001. (E and F) UMP peak area (E) and γ-H2AX as measured by flow cytometry (F) in DIPG1 cells as in Panel 4A, treated with BAY2402234 (DHODHi; 1 nM) for 24 and 48 hours, respectively. Unpaired t-test, * p<0.05, **** p<0.0001, ns-not significant. (G and H) UMP peak area (G) and γ-H2AX as measured by flow cytometry (H) in BT333 cells as in Panel 4C, treated with BAY2402234 (DHODHi; 2.5 nM) for 24 and 72 hours, respectively. Unpaired t-test, ** p<0.01, **** p<0.0001. (I-L) BAY2402234-resistant derivative of DIPG1 assessed for (I) sensitivity to BAY2402234 (DHODHi; +0.625 nM, ++1.25 nM) for 5 days. Unpaired t-test, * p<0.05, ** p<0.01, *** p<0.001, **** p<0.0001.; (J) Western blot analyses for indicated proteins; and (K) UMP peak area of unlabeled (M+0) and labeled 15N-UMP (M+1) in parental and resistant DIPG1 after exposure to media containing 15N-glutamine (for 12 hours) with or without BAY2402234. For DHODHi samples, cells were pretreated with BAY2402234 (DHODHi; 1.25 nM) for 14 hours prior to switching to media containing 15N-glutamine. **** p<0.0001, ns-not significant for the comparisons of indicated M+1 peak areas, ANOVA with Tukey’s multiple comparison test. (L) γ-H2AX (flow cytometry) in BAY2402234-treated (DHODHi: 1 nM, 48 hours) DIPG1 parental and resistant lines with or without uridine supplementation (100 μM). See also Figure S4.
Figure 5.
Figure 5.. DHODH inhibition arrests DMG cells in S phase and increases replication stress
(A) S phase population, detected as BrdU positive cells by flow cytometry, in control and BAY2402234 (DHODHi; 1.25 nM, 24 hours) treated DMG cells. Distribution of SU-DIPG4 cells (left panels) and quantification of S phase populations (right panel; mean ± SEM, n=3). Unpaired t-test, **** p<0.0001. (B) BAY2402234-treated DMG cells (DHODHi; 1.25 nM, 24 hours) with or without uridine supplementation (100 γM), were analyzed for the presence of chromatin-bound RPAs by immunofluorescence staining of RPA2 foci. Hydroxyurea (HU), a known inducer of replication stress, is included as a positive control. Top panel shows representative images of RPA (red) and DAPI (blue). Violin plot shows the frequency distributions of foci/cell in at least 100 cells (bottom panel). Kruskal-Wallis test, **** p<0.0001. (C) Western blot analyses of whole cell extracts of SU-DIPG4 cells treated as in Panel 5B, evaluated for indicated proteins. pRPA2S33: phosphorylated RPA2 at serine 33. pCHK1S345: phosphorylated CHK1 at serine 345. c-PARP: cleaved PARP. (D) SU-SIPG4 cells treated with BAY2402234 (DHODHi; 1.25 nM, 48 hours; with or without 100 μM uridine) were sequentially labeled with CldU and IdU to document replicating DNA using DNA combing assay. Representative image is shown in the left panel. Fork speed was determined for at least 100 replicating fibers for each condition and represented as violin plots (the frequency distributions of the fork speed). Kruskal-Wallis test, **** p<0.0001, ns- not significant. See also Figures S5.
Figure 6.
Figure 6.. BAY2402234 is brain penetrant and inhibits de novo pyrimidine synthesis in vivo to prolong survival of mice bearing orthotopic DMG tumors
(A-C) MALDI MSI and optical microscopy imaging of brain tissue serial sections from mice harboring DIPG1 orthotopic tumor and treated with vehicle or BAY2402234 (4 mg/kg daily for 4 days). (A) Serial sagittal sections were stained with H&E and neighboring sections analyzed by MALDI MSI to quantitate levels of BAY2402234. Heme b was used as a marker of vasculature. (B) Metabolites of de novo pyrimidine synthesis analyzed by MALDI MSI (as in Panel 6A), shown in representative serial sections (left panel) and fold change quantified relative to vehicle treated section (right panel) from mice treated with BAY2402234 or vehicle (mean ± SEM, n=3 per treatment). (C) γ-H2AX staining of tumor regions in brain sections (same as Panel 6A) from vehicle- or BAY2402234-treated mice. (D) Tumor growth monitored by weekly bioluminescence imaging (BLI) of mice with SU-DIPG13P* orthotopic tumor; data represent average BLI signal values ± SEM. Number of mice is indicated by n. (E) Kaplan-Meier curve delineating survival of mice bearing SU-DIPG13-P* orthotopic DMG tumors treated daily (until euthanasia) with vehicle or BAY2402234. Log-rank (Mantel-Cox) test, ** p<0.01 (F and G) MALDI MSI and optical microscopy imaging of brain tissue serial sections from mice harboring SU-DIPG13-P* orthotopic tumors, treated with vehicle or BAY2402234 (4 mg/kg daily) using short-term (4 days) or long-term (35-37 days) drug regimens. (F) Representative images and (G) quantification of metabolites fold change relative to vehicle (mean ± SEM, n=3 per treatment). See also Figures S6.
Figure 7.
Figure 7.. ATR inhibition augments DHODH inhibitor-induced replication stress and DNA damage
(A) Quantification of RPA foci by immunostaining in DMG cells treated (24 hours) with BAY2402234 (DHODHi; 1.25 nM), elimusertib (ATRi; 200 nM), or combination thereof. Representative images (left panel) and distributions of RPA foci/cell from at least 80 cells are represented as violin plots (right panel). Kruskal-Wallis test; ** p<0.01, *** p<0.001, **** p<0.0001.c (B) Western blot analyses of indicated proteins, in SU-DIPG4 cells (treated as in Panel 7A). pRPA2S33: phosphorylated RPA2 at serine 33. pCHK1S345: phosphorylated CHK1 at serine 345. c-PARP: cleaved PARP. c-CASP3: cleaved CASPASE-3. (C) Flow cytometry quantitation of γ-H2AX-positive cells, in BAY2402234- (DHODHi; 1.25 nM; 24 hours), elimusertib- (ATRi; 200 nM; 24 hours), or combination-treated SU-DIPG4 cultures, before (top panel) or 24 hours after (bottom panel) drug washout. Representative flow cytometry density plots (left panel) and quantification of fold change (mean ± SEM, n=3; right panel). ANOVA, **** p<0.0001. (D) Metaphase spreads of SU-DIPG4 cells treated with BAY2402234 (DHODHi; 1.25 nM; 24 hours), elimusertib (ATRi; 100 nM; 24 hours), or combination therapy and scored for mitotic abnormalities (i.e., chromatid/chromosomal breaks, radials, etc.). Representative metaphase spread with red arrows indicating events scored as damage (left panel) and quantification of at least 25 metaphase spreads scored per treatment (right panel). (E) Synergistic cytotoxicity induced by combination therapy of DHODH- and ATR-inhibitors. DMG cells were treated with specified doses of BAY2402234 and elimusertib (72 hours; triplicates). Cell viability was determined by Cell-Titer Glo and analyzed using Combenefit software to assess synergy distributions and synergy-antagonism relationships. n=3 and * p<0.05. See also Figures S7.

Comment in

  • Gliomas lean on pyrimidines.
    Willson J. Willson J. Nat Rev Cancer. 2022 Nov;22(11):606-607. doi: 10.1038/s41568-022-00515-9. Nat Rev Cancer. 2022. PMID: 36131135 No abstract available.

References

    1. Bender S, Tang Y, Lindroth AM, Hovestadt V, Jones DT, Kool M, Zapatka M, Northcott PA, Sturm D, Wang W, et al. (2013). Reduced H3K27me3 and DNA hypomethylation are major drivers of gene expression in K27M mutant pediatric high-grade gliomas. Cancer Cell 24, 660–672. - PubMed
    1. Berlow NE, Svalina MN, Quist MJ, Settelmeyer TP, Zherebitskiy V, Kogiso M, Qi L, Du Y, Hawkins CE, Hulleman E, et al. (2018). IL-13 receptors as possible therapeutic targets in diffuse intrinsic pontine glioma. PLoS One 13, e0193565. - PMC - PubMed
    1. Braunstein S, Raleigh D, Bindra R, Mueller S, and Haas-Kogan D (2017). Pediatric high-grade glioma: current molecular landscape and therapeutic approaches. J Neurooncol 134, 541–549. - PubMed
    1. Brown KK, Spinelli JB, Asara JM, and Toker A (2017). Adaptive Reprogramming of De Novo Pyrimidine Synthesis Is a Metabolic Vulnerability in Triple-Negative Breast Cancer. Cancer Discov 7, 391–399. - PMC - PubMed
    1. Buczkowicz P, Hoeman C, Rakopoulos P, Pajovic S, Letourneau L, Dzamba M, Morrison A, Lewis P, Bouffet E, Bartels U, et al. (2014). Genomic analysis of diffuse intrinsic pontine gliomas identifies three molecular subgroups and recurrent activating ACVR1 mutations. Nat Genet 46, 451–456. - PMC - PubMed

Publication types

LinkOut - more resources