. 2022 Sep 12;40(9):939-956.e16.
doi: 10.1016/j.ccell.2022.07.011. Epub 2022 Aug 18.

De novo pyrimidine synthesis is a targetable vulnerability in IDH mutant glioma

Affiliations

De novo pyrimidine synthesis is a targetable vulnerability in IDH mutant glioma

Diana D Shi et al. Cancer Cell. .

Abstract

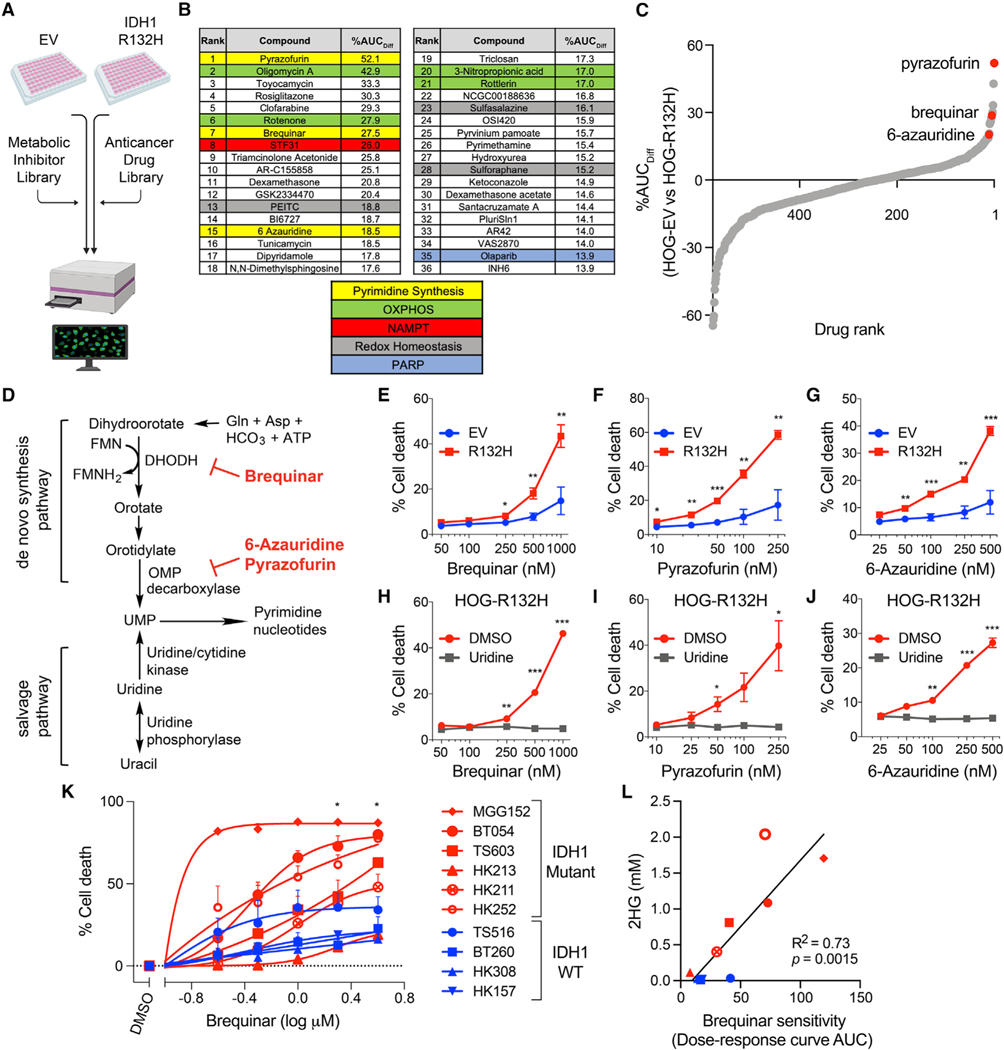
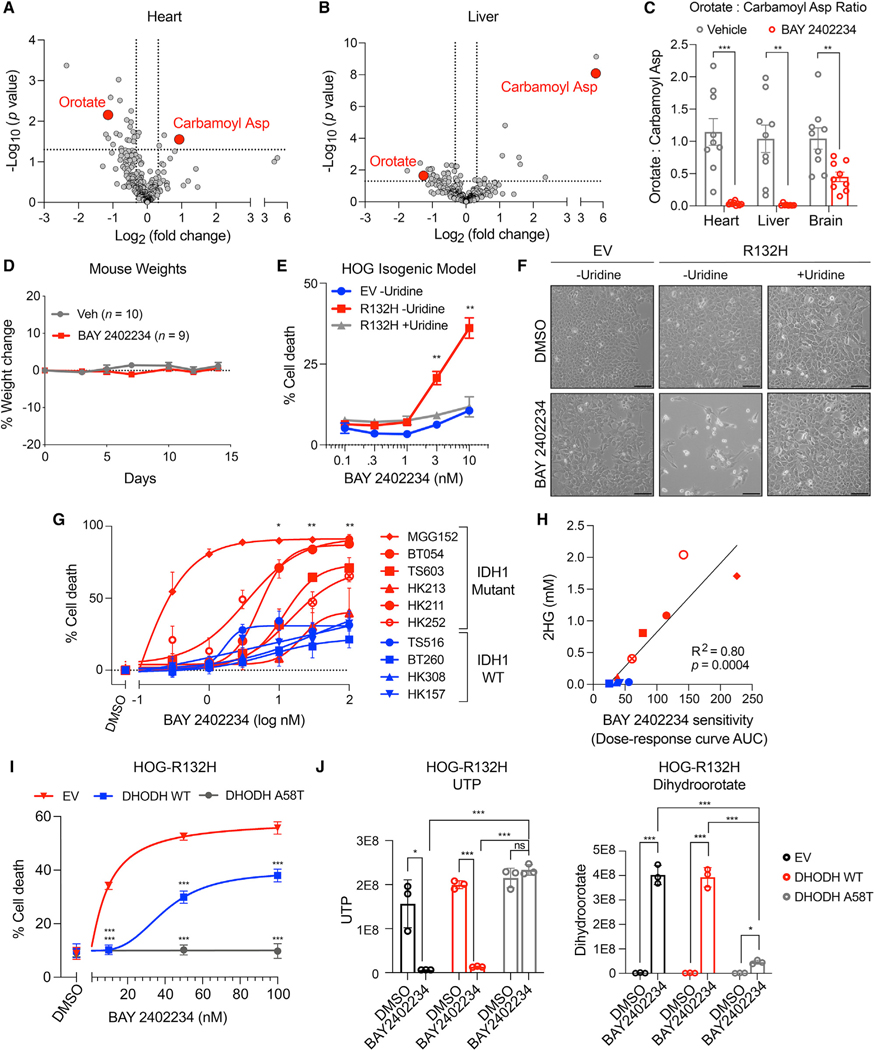
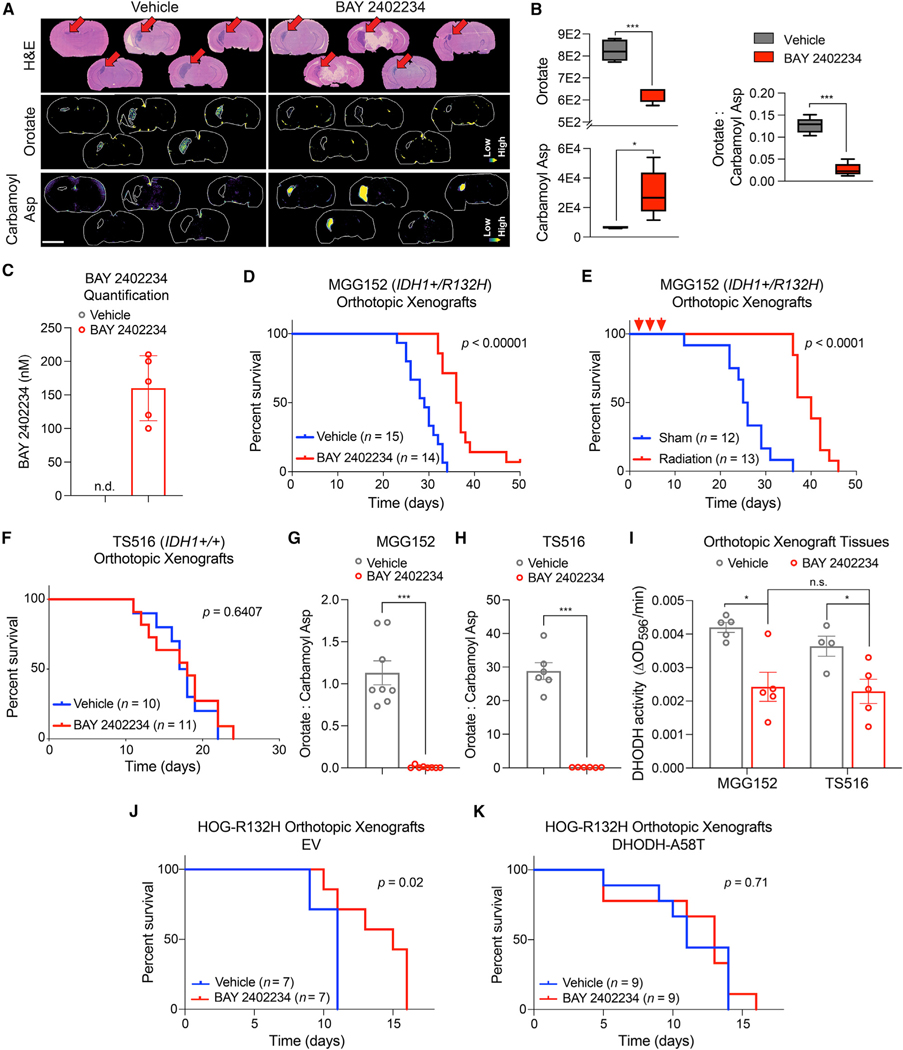
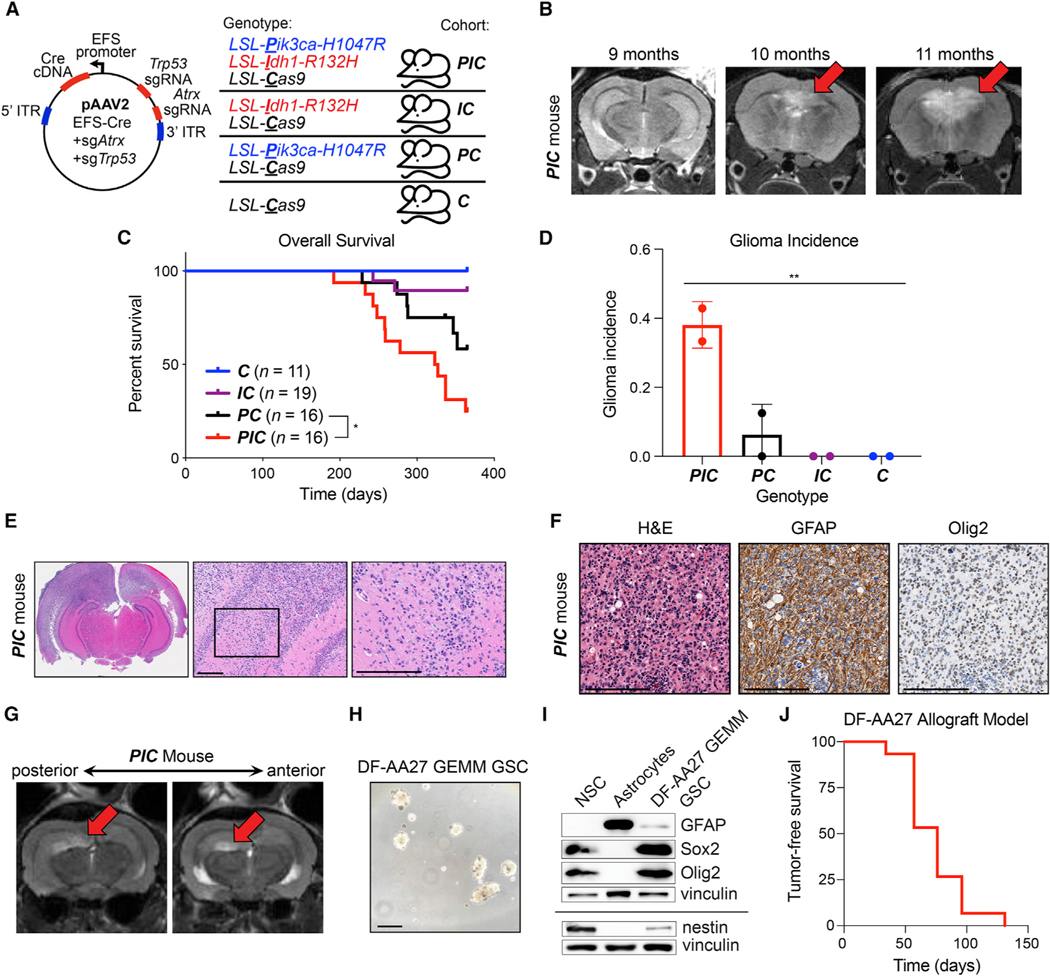
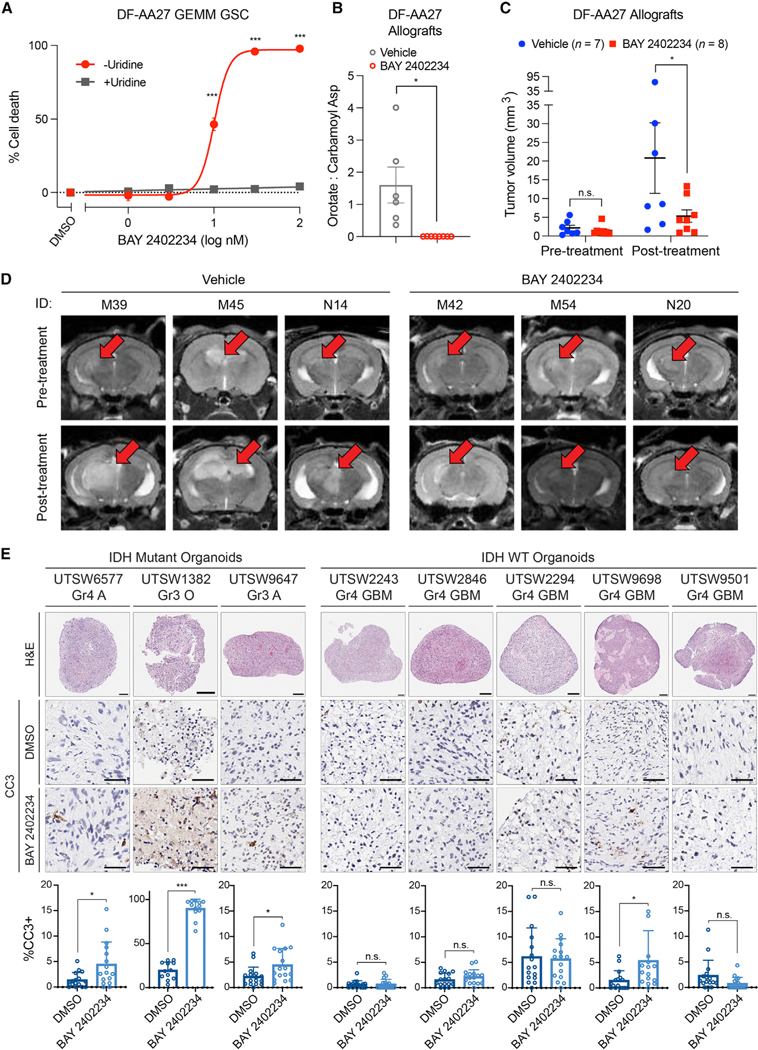
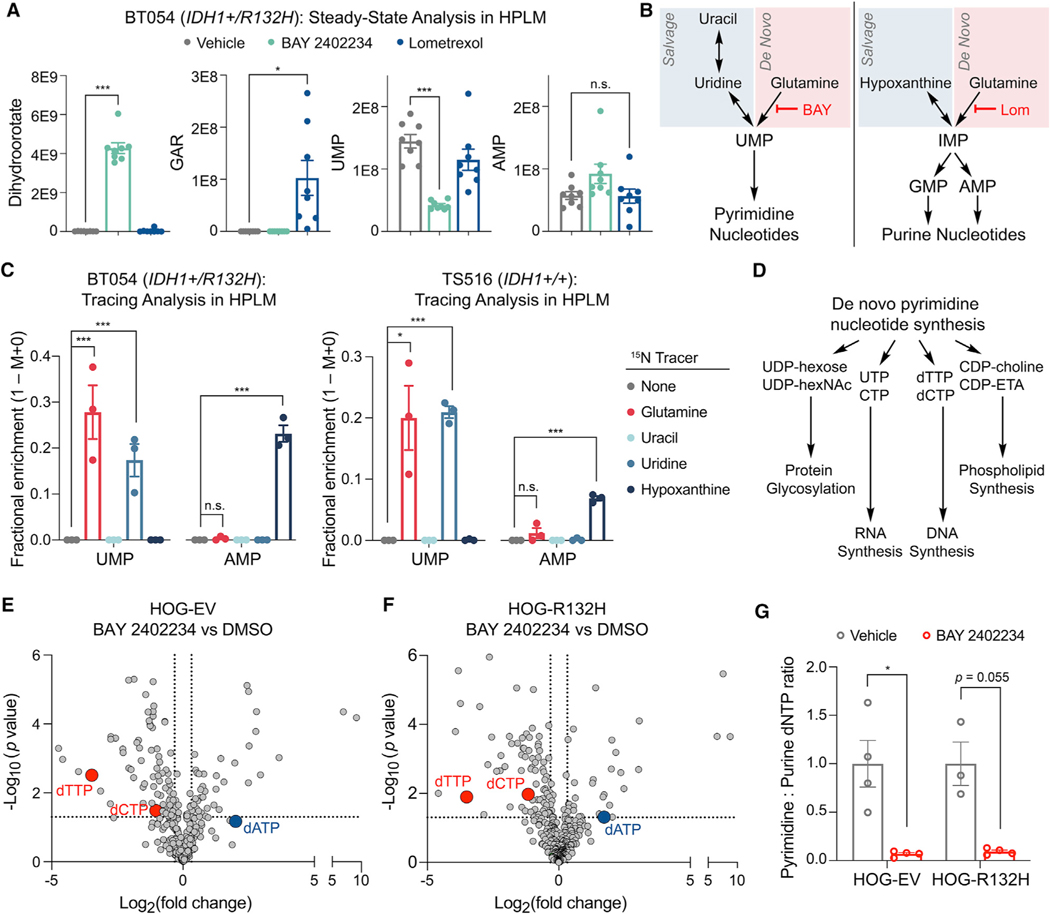
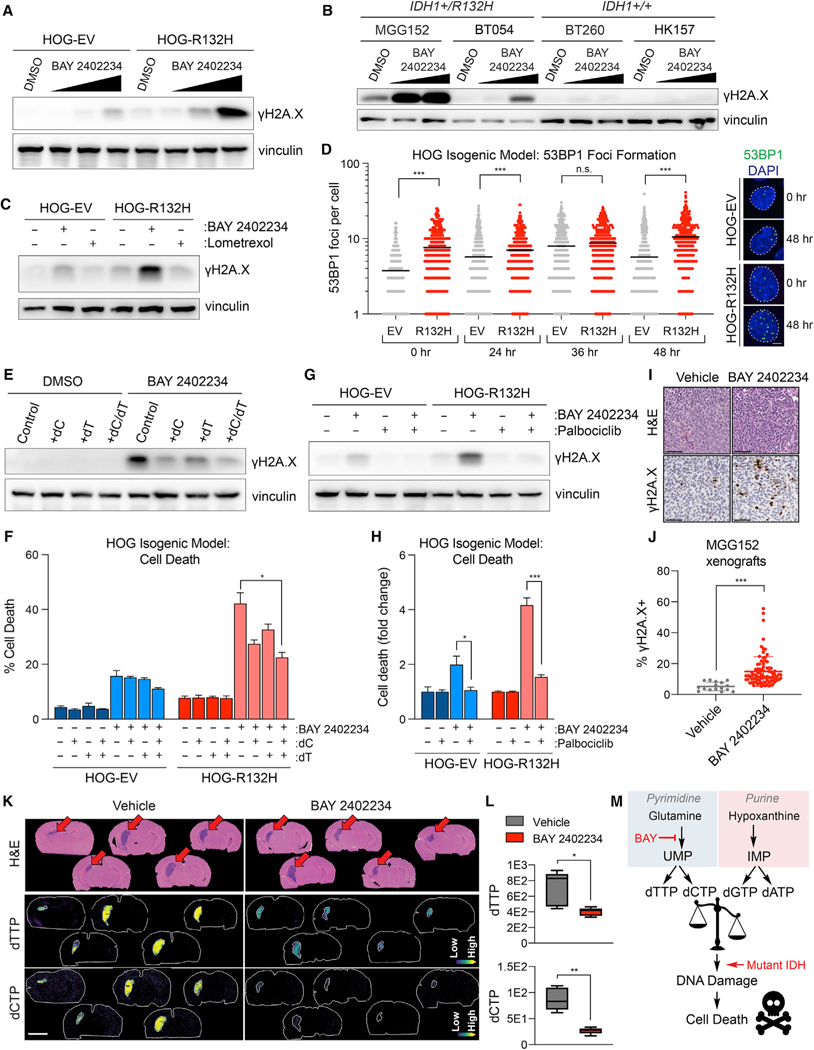
Mutations affecting isocitrate dehydrogenase (IDH) enzymes are prevalent in glioma, leukemia, and other cancers. Although mutant IDH inhibitors are effective against leukemia, they seem to be less active in aggressive glioma, underscoring the need for alternative treatment strategies. Through a chemical synthetic lethality screen, we discovered that IDH1-mutant glioma cells are hypersensitive to drugs targeting enzymes in the de novo pyrimidine nucleotide synthesis pathway, including dihydroorotate dehydrogenase (DHODH). We developed a genetically engineered mouse model of mutant IDH1-driven astrocytoma and used it and multiple patient-derived models to show that the brain-penetrant DHODH inhibitor BAY 2402234 displays monotherapy efficacy against IDH-mutant gliomas. Mechanistically, this reflects an obligate dependence of glioma cells on the de novo pyrimidine synthesis pathway and mutant IDH's ability to sensitize to DNA damage upon nucleotide pool imbalance. Our work outlines a tumor-selective, biomarker-guided therapeutic strategy that is poised for clinical translation.

Keywords: DHODH; IDH; cancer metabolism; genetically engineered mouse model; glioma; isocitrate dehydrogenase; pyrimidine nucleotides.


Conflict of interest statement

Declaration of interests R.J.D., W.G.K., and S.K.M. have served as paid advisors to Agios Pharmaceuticals. W.G.K. receives compensation for roles as an Eli Lilly and LifeMine Therapeutics Board Director, a founder of Tango Therapeutics and Cedilla Therapeutics, and a scientific advisor for Fibrogen, IconOVir Bio, Circle Pharma, Nextext Invest, and Casdin Capital. K.L.L. receives research support from Eli Lilly and Company via the DFCI. S.K.M. and W.G.K. received research funding from Bayer Pharmaceuticals. Bayer had no influence over the design, execution, or interpretation of studies. N.Y.R.A. is key opinion leader for Bruker Daltonics, scientific advisor to Invicro, and receives support from Thermo Finnegan and EMD Serono. S.G., A.S., M.S., A.J., and L.E. are employees at Bayer. S.G., A.S., and A.J. hold stock in Bayer. D.P.C. has consulted for Lilly, GlaxoSmithKline, and Boston Pharmaceuticals and serves on the advisory board of Pyramid Biosciences, which includes an equity interest. All other authors declare no competing interests.

Figures

Figure 1.
Figure 1.. De novo pyrimidine synthesis inhibitors preferentially kill IDH1-mutant glioma cells
(A) Schema of the multifunctional approach to pharmacologic screening (MAPS) platform drug screen. Percent difference in area under curve (AUC) values (%AUCDiff) in HOG-EV and HOG-R132H cells were calculated for all drugs. (B) Top hits and related pathways. (C) Waterfall plot of all drugs ranked by %AUCDiff. (D) Schematic of de novo and salvage pyrimidine synthesis pathways and targets of indicated hits. (E–G) Cell death assays of HOG-EV or HOG-R132H cells treated with the indicated drugs (n = 5). (H–J) Cell death assays of HOG-R132H cells treated with indicated drugs with or without 100 μM uridine (n = 3). (K) Cell death assays of GSC lines treated with brequinar for two population doublings (n ≥ 3). (L) Correlation between 2HG levels and sensitivity of GSC lines to brequinar. Symbols and colors are as in (K). For all panels, data presented are means ± SEM; *p < 0.05, **p < 0.01, ***p < 0.001. For (L), p value was determined by simple linear regression analysis. For all others, two-tailed p values were determined by unpaired t test.
Figure 2.
Figure 2.. The DHODHi BAY 2402234 is brain-penetrant in mice and selectively kills IDH1-mutant glioma cells
(A and B) Volcano plot of metabolites in heart (A) and liver (B) of mice treated with BAY 2402234 or vehicle (n = 9 per cohort). Carbamoyl asp = carbamoyl aspartate. (C) OCAR in tissues of mice treated with BAY 2402234 or vehicle as in (A) (n = 9 per cohort). (D) Weight changes in mice treated with BAY 2402234 or vehicle. (E) Cell death assays of HOG-EV or HOG-R132H cells treated with BAY 2402234 with or without 100 μM uridine (n = 3). (F) Representative photomicrographs of cells in (E). Scale bars, 100 μm. (G) Cell death assays of GSC lines treated with BAY 2402234 or DMSO for two population doublings (n ≥ 3). (H) Correlation between 2HG levels and sensitivity of GSC lines to BAY 2402234. Symbols and colors are as in (G). (I) Cell death assays of HOG-R132H cells expressing EV, DHODH WT, or DHODH A58T treated with BAY 2402234 or DMSO (n = 3). (J) UTP and dihydroorotate levels in HOG-R132H stable lines treated with 50 nM BAY 2402234 or DMSO (n = 3). For panels (A–E and G), data are means ± SEM; for panels (I and J), data are means ± SD; *p < 0.05, **p < 0.01, ***p < 0.001. For (H), the p value was determined by simple linear regression analysis. For all others, two-tailed p values were determined by unpaired t test.
Figure 3.
Figure 3.. Treatment with BAY 2402234 improves survival of mice bearing IDH1-mutant glioma orthotopic xenografts
(A) Brain sections from mice bearing MGG152 xenografts and treated with BAY 2402234 or vehicle (n = 5 per cohort). Top: stain: hematoxylin and eosin. Relative orotate (middle) and carbamoyl aspartate (bottom) levels as determined by matrix-assisted laser desorption ionization mass spectrometry imaging (MALDI-MSI). Scale bar, 3 mm. (B and C) MALDI-MSI-based quantification of orotate, carbamoyl aspartate, and OCAR (B) and BAY 2402234 (C) in tumor tissues in (A). n.d., not detected. (D and E) Kaplan-Meier curves of mice bearing MGG152 xenografts treated with BAY 2402234 or vehicle (D) or cranial radiation or sham (E). Red arrows in (E) indicate irradiation. (F) Kaplan-Meier curves of mice bearing TS516 xenografts treated with BAY 2402234 or vehicle. (G and H) OCAR in MGG152 (n = 8 per cohort) (G) and TS516 (n = 6 per cohort) (H) tumor tissues. (I) DHODH activity in MGG152 or TS516 tumor tissues after BAY 2402234 or vehicle treatment. (J and K) Kaplan-Meier curves of mice bearing HOG-R132H xenografts expressing either EV (J) or DHODH-A58T (K). For (B), Tukey plots are shown. For (C), data are means ± SD. For all other panels, data are means ± SEM; *p < 0.05, **p < 0.01, ***p < 0.001. In (D–F), (J), and (K), p values were calculated by log rank test. Grubbs’ test was used to detect and exclude outliers in (J and K) (a = 0.05). In (B and G–I), two-tailed p values were determined by unpaired t test.
Figure 4.
Figure 4.. IDH1 and PIK3R1 oncogenes cooperate to transform immortalized astrocytes
(A) Alterations in the indicated genes in the Brain Lower Grade Glioma TCGA dataset. (B) Kaplan-Meier curves of glioma patients with the indicated genotypes. Note that the apparent tail of the black curve is driven by a single patient. (C and D) Immunoblot analyses of NHA cell lines expressing HA-tagged IDH1-R132H (or EV) and FLAG-tagged WT or mutant (D560_S565del, R574fs, or T576del) p85 (protein product of PIK3R1 gene) or the corresponding EV. (E) Representative anchorage independence assays of NHA cells used in (C) and (D) (n = 5). Scale bar, 100 μm. (F and G) Bioluminescence imaging (F) and Kaplan-Meier curves (G) of mice after intracranial injection of EV/EV (control), IDH1R132H/EV (IDH1mut), EV/p85D560_S565del (PIK3R1mut), IDH1R132H/p85D560_S565del (IDH1mut + PIK3R1mut), or H-Ras-V12 (positive control) NHA lines. *p < 0.05. n.s., not significant. P values were determined by the log rank test.
Figure 5.
Figure 5.. Creation of GEM models of lower grade astrocytoma
(A) Mouse injection scheme. Indicated AAV was intracranially injected into mouse strains (PIC, IC, PC, and C). LSL, loxP-stop-loxP cassette. Mice were monitored for tumor initiation with serial monthly MRI scans. (B) Representative MRI images of a PIC mouse after intracranial AAV injection, as in (A). (C) Kaplan-Meier curves of AAV-injected mice, as in (A). Time 0 = day of injection. (D) Cumulative glioma incidence in mice (as determined by MRI, histopathologic analysis, or both), as in (A), in the 12 months after AAV injection. Mice that developed injection-site sarcomas were censored. (E and F) Hematoxylin and eosin (E) and immunohistochemical (F) stained sections of the brain from a representative AAV-injected PIC mouse. In (E), the black box indicates the region in the right panel; in all panels, scale bars, 200 μm. (G) Representative MRI images from an AAV-injected PIC mouse. Arrows indicate tumor. (H and I) Photomicrograph (H) of DF-AA27 GEM model (GEMM) GSCs and immunoblot analysis (I) of DF-AA27 GEMM GSCs, human neural stem cells (NSC), and primary human astrocytes. In (H), scale bar, 100 μm. GFAP, glial fibrillary acidic protein. (J) Kaplan-Meier tumor-free survival curve of mice intracranially injected with DF-AA27 cells. Time 0 = day of injection. (n = 15). For (B and G), MRI images are coronal slices of the entire mouse brain. For all panels, data are means ± SD; *p < 0.05, **p < 0.01. In (C), the p value was determined by log rank test. In (D), the p value was determined by one-way ANOVA.
Figure 6.
Figure 6.. Organoid and genetically engineered allograft models of IDH-mutant glioma respond to DHODH inhibition
(A) Cell death assay in DF-AA27 GEMM GSCs treated with BAY 2402234 or DMSO with or without 100 μM uridine (n = 3). (B) OCAR in DF-AA27 orthotopic allografts in mice treated with BAY 2402234 or vehicle (n = 6 per cohort). (C and D) Tumor volumes (C) and representative MRI images (D) of mice with DF-AA27 orthotopic allografts treated continuously following tumor formation with BAY 2402234 or vehicle. (E) Histology, immunohistochemistry, and quantification of cleaved caspase 3 (CC3) in glioma SXOs treated with 30 nM BAY 2402234 or DMSO. Scale bars, 50 μm. Gr, tumor grade, A, astrocytoma, O, oligodendroglioma, GBM, glioblastoma. For (A–C), data are means ± SEM. For (D), MRI images are coronal slices of the entire mouse brain. For (E), data are means ± SD. *p < 0.05, ***p < 0.001, n.s., not significant. Two-tailed p values were determined by unpaired t test.
Figure 7.
Figure 7.. Glioma cells use divergent routes for pyrimidine and purine nucleotide synthesis under physiologic conditions
(A) Steady-state quantification of the indicated metabolites in BT054 GSCs treated with 10 nM BAY 2402234, 5 μM lometrexol, or DMSO (n = 8 per condition). (B) Pathways targeted by BAY 2402234 (BAY) and lometrexol (Lom). (C) 15N stable isotope tracing assays in BT054 and TS516 GSC lines (n = 3). (D) Select pathways using intermediates derived from de novo pyrimidine nucleotide synthesis. (E and F) Volcano plots of metabolites in HOG-EV (E) or HOG-R132H (F) cells treated with 10 nM BAY 2402234 relative to DMSO (n = 4). (G) Ratio of pyrimidine (dTTP, dCTP) to purine (dATP) deoxynucleotide triphosphate (dNTP) pools in cells shown in (E and F). For all panels, data are means ± SEM; *p < 0.05, ***p < 0.001. n.s., not significant. Two-tailed p values were determined by unpaired t test.
Figure 8.
Figure 8.. The IDH1-R132H mutation enhances DNA damage caused by DHODH inhibition
(A and B) Immunoblot analysis of HOG-EV and HOG-R132H cells (A) or GSC lines (B) treated with BAY 2402234 (HOGs: 1, 3, or 10 nM; GSCs: 3 or 10 nM) or DMSO. (C) Immunoblot analysis of HOG-EV and HOG-R132H cells treated with 10 nM BAY 2402234, 5 μM lometrexol, or DMSO. (D) Quantification of 53BP1 foci formation in HOG-EV and HOG-R132H cells treated with BAY 2402234 (n ≥ 325 cells per condition per time point) and representative images. Scale bar, 5 μm; dashed lines show individual nuclei. (E–H) Immunoblot analysis and cell death assays in HOG-EV and HOG-R132H cells treated with BAY 2402234, DMSO, 15 μM dC, and/or 15 μM dT (n = 3) (E and F), or pre-treated with 1 μM palbociclib or DMSO (G and H), then treated with BAY 2402234 or DMSO (n = 3). (I and J) Representative hematoxylin and eosin, anti-γH2A.X IHC staining (I), and γH2A.X quantification (J) of MGG152 orthotopic xenografts treated with BAY 2402234 (n = 5) or vehicle (n = 2). Scale bar, 100 μm. (K and L) MALDI-MSI ion images (K) and quantified relative changes (L) of brains from mice with MGG152 orthotopic glioma xenografts treated with BAY 2402234 or vehicle. Scale bar, 3 mm. (M) Schema depicting model by which BAY 2402234 (BAY) treatment preferentially kills IDH-mutant glioma cells. For (D), data are means and variance is not displayed. For (L), Tukey plots are shown. For all other panels, data are means ± SEM. *p < 0.05, **p < 0.01, ***p < 0.001, n.s., not significant. Two-tailed p values were determined by unpaired t test.

Comment in

  • Gliomas lean on pyrimidines.
    Willson J. Willson J. Nat Rev Cancer. 2022 Nov;22(11):606-607. doi: 10.1038/s41568-022-00515-9. Nat Rev Cancer. 2022. PMID: 36131135 No abstract available.

References

    1. Abdullah KG, Bird CE, Buehler JD, Gattie LC, Savani MR, Sternisha AC, Xiao Y, Levitt MM, Hicks WH, Li W, et al. (2022). Establishment of patient-derived organoid models of lower-grade glioma. Neuro Oncol. 24, 612–623. 10.1093/neuonc/noab273. - DOI - PMC - PubMed
    1. Adams JR, Xu K, Liu JC, Agamez NMR, Loch AJ, Wong RG, Wang W, Wright KL, Lane TF, Zacksenhaus E, and Egan SE (2011). Cooperation between Pik3ca and p53 mutations in mouse mammary tumor formation. Cancer Res. 71, 2706–2717. 10.1158/0008-5472.CAN-10-0738. - DOI - PubMed
    1. Aoki K, Nakamura H, Suzuki H, Matsuo K, Kataoka K, Shimamura T, Motomura K, Ohka F, Shiina S, Yamamoto T, et al. (2018). Prognostic relevance of genetic alterations in diffuse lower-grade gliomas. Neuro Oncol. 20, 66–77. 10.1093/neuonc/nox132. - DOI - PMC - PubMed
    1. Bardella C, Al-Dalahmah O, Krell D, Brazauskas P, Al-Qahtani K, Tomkova M, Adam J, Serres S, Lockstone H, Freeman-Mills L, et al. (2016). Expression of Idh1R132H in the murine subventricular zone stem cell niche recapitulates features of early gliomagenesis. Cancer Cell 30, 578–594. 10.1016/j.ccell.2016.08.017. - DOI - PMC - PubMed
    1. Bothe HW, Bodsch W, and Hossmann KA (1984). Relationship between specific gravity, water content, and serum protein extravasation in various types of vasogenic brain edema. Acta Neuropathol. 64, 37–42. - PubMed

Publication types