

Quantitative Pathologic Analysis of Digitized Images of Colorectal Carcinoma Improves Prediction of Recurrence-Free Survival
- PMID: 35985511
- PMCID: PMC9716432
- DOI: 10.1053/j.gastro.2022.08.025
Quantitative Pathologic Analysis of Digitized Images of Colorectal Carcinoma Improves Prediction of Recurrence-Free Survival
Abstract
Background & aims: To examine whether quantitative pathologic analysis of digitized hematoxylin and eosin slides of colorectal carcinoma (CRC) correlates with clinicopathologic features, molecular alterations, and prognosis.
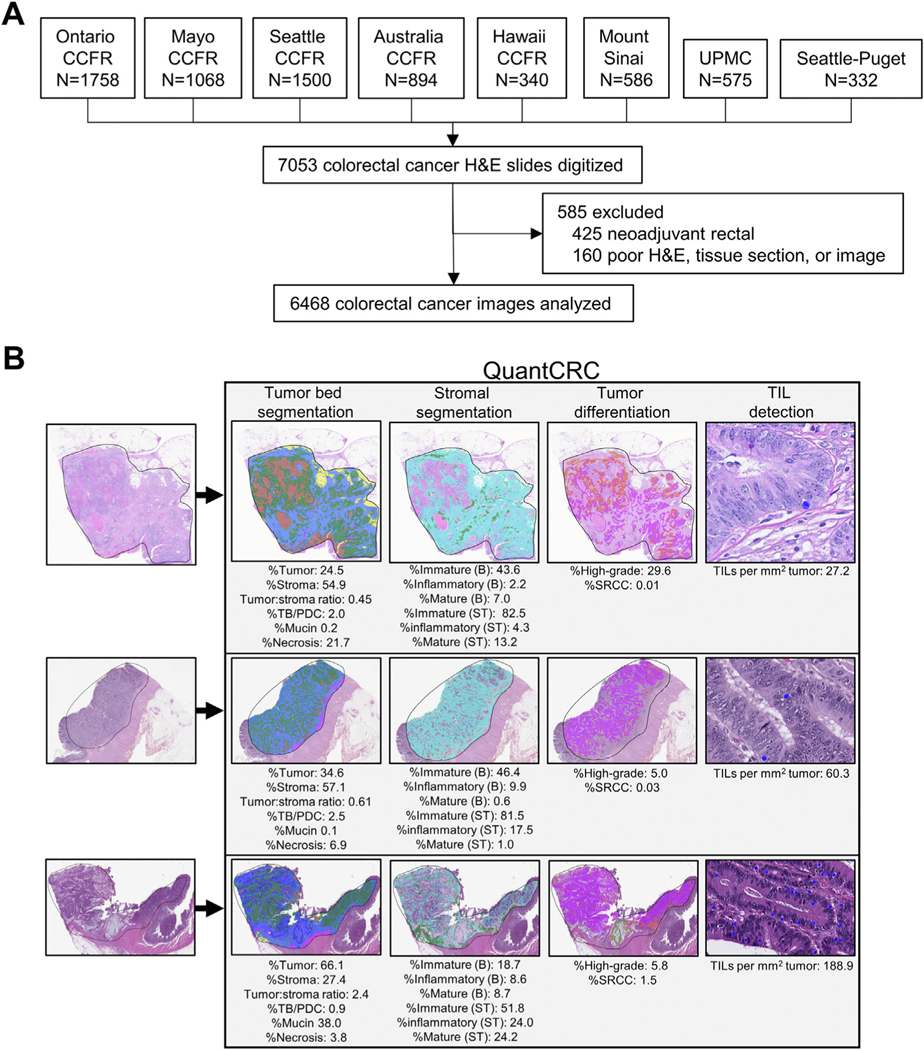
Methods: A quantitative segmentation algorithm (QuantCRC) was applied to 6468 digitized hematoxylin and eosin slides of CRCs. Fifteen parameters were recorded from each image and tested for associations with clinicopathologic features and molecular alterations. A prognostic model was developed to predict recurrence-free survival using data from the internal cohort (n = 1928) and validated on an internal test (n = 483) and external cohort (n = 938).
Results: There were significant differences in QuantCRC according to stage, histologic subtype, grade, venous/lymphatic/perineural invasion, tumor budding, CD8 immunohistochemistry, mismatch repair status, KRAS mutation, BRAF mutation, and CpG methylation. A prognostic model incorporating stage, mismatch repair, and QuantCRC resulted in a Harrell's concordance (c)-index of 0.714 (95% confidence interval [CI], 0.702-0.724) in the internal test and 0.744 (95% CI, 0.741-0.754) in the external cohort. Removing QuantCRC from the model reduced the c-index to 0.679 (95% CI, 0.673-0.694) in the external cohort. Prognostic risk groups were identified, which provided a hazard ratio of 2.24 (95% CI, 1.33-3.87, P = .004) for low vs high-risk stage III CRCs and 2.36 (95% CI, 1.07-5.20, P = .03) for low vs high-risk stage II CRCs, in the external cohort after adjusting for established risk factors. The predicted median 36-month recurrence rate for high-risk stage III CRCs was 32.7% vs 13.4% for low-risk stage III and 15.8% for high-risk stage II vs 5.4% for low-risk stage II CRCs.
Conclusions: QuantCRC provides a powerful adjunct to routine pathologic reporting of CRC. A prognostic model using QuantCRC improves prediction of recurrence-free survival.
Keywords: Colorectal Cancer; Image Analysis; Prognosis; Stroma; Tumor Infiltrating Lymphocytes.
Copyright © 2022 AGA Institute. Published by Elsevier Inc. All rights reserved.
Conflict of interest statement
Conflict of Interest
David F. Schaeffer reports honoraria from Alimentiv Inc., Pfizer, Merck, Diaceutics, and Astellas; and stock ownership in Satisfai Health Inc outside of the submitted work. Reetesh K. Pai, Christophe Rosty, Richard Kirsch report consulting income from Alimentiv Inc. outside of the submitted work. Rish K. Pai reports consulting income from Alimentiv Inc., Eli Lilly, AbbVie, Allergan, Genentech, and PathAI outside of the submitted work.
Thomas Westerling-Bui is an employee of Aiforia Inc. The remaining authors disclose no conflicts.
Figures


References
-
- Ueno H, Hashiguchi Y, Shimazaki H, et al. Objective criteria for crohn-like lymphoid reaction in colorectal cancer. Am J Clin Pathol 2013;139:434–441. - PubMed
-
- Williams DS, Mouradov D, Jorissen RN, et al. Lymphocytic response to tumour and deficient DNA mismatch repair identify subtypes of stage II/III colorectal cancer associated with patient outcomes. Gut 2019; 68:465–474. - PubMed
-
- Baxter NN, Kennedy EB, Bergsland E, et al. Adjuvant therapy for stage II colon cancer: ASCO Guideline Update. J Clin Oncol 2022;40:892–910. - PubMed
Publication types
MeSH terms
Substances
Grants and funding
LinkOut - more resources
Full Text Sources
Medical
Research Materials
Miscellaneous
