

A novel chemokine-based signature for prediction of prognosis and therapeutic response in glioma
- PMID: 35985661
- PMCID: PMC9627384
- DOI: 10.1111/cns.13944
A novel chemokine-based signature for prediction of prognosis and therapeutic response in glioma
Abstract
Aims: Gliomas are the primary malignant brain tumor and characterized as the striking cellular heterogeneity and intricate tumor microenvironment (TME), where chemokines regulate immune cell trafficking by shaping local networks. This study aimed to construct a chemokine-based gene signature to evaluate the prognosis and therapeutic response in glioma.
Methods: In this study, 1024 patients (699 from TCGA and 325 from CGGA database) with clinicopathological information and mRNA sequencing data were enrolled. A chemokine gene signature was constructed by combining LASSO and SVM-RFE algorithm. GO, KEGG, and GSVA analyses were performed for function annotations of the chemokine signature. Candidate mRNAs were subsequently verified through qRT-PCR in an independent cohort including 28 glioma samples. Then, through immunohistochemical staining (IHC), we detected the expression of immunosuppressive markers and explore the role of this gene signature in immunotherapy for glioma. Lastly, the Genomics of Drug Sensitivity in Cancer (GDSC) were leveraged to predict the potential drug related to the gene signature in glioma.
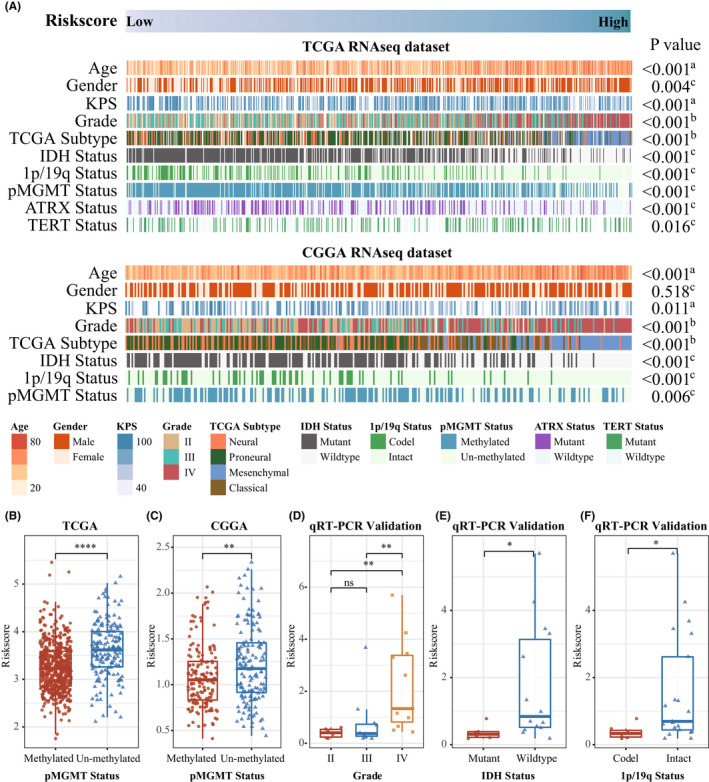
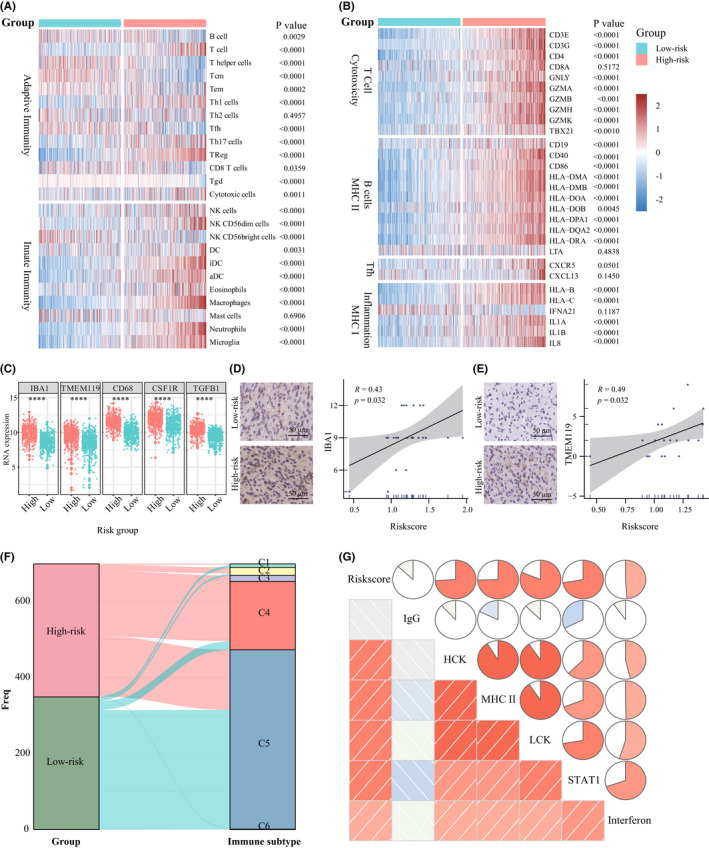
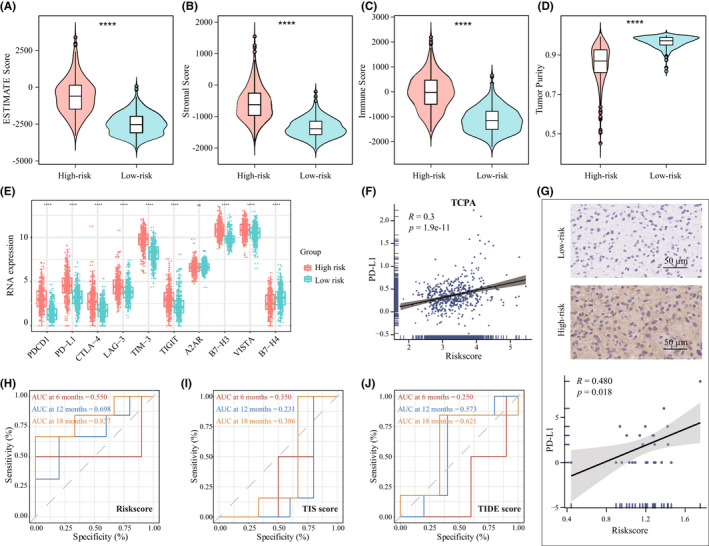
Results: A constructed chemokine gene signature was significantly associated with poorer survival, especially in glioblastoma, IDH wildtype. It also played an independent prognostic factor in both datasets. Moreover, biological function annotations of the predictive signature indicated the gene signature was positively associated with immune-relevant pathways, and the immunosuppressive protein expressions (PD-L1, IBA1, TMEM119, CD68, CSF1R, and TGFB1) were enriched in the high-risk group. In an immunotherapy of glioblastoma cohort, we confirmed the chemokine signature showed a good predictor for patients' response. Lastly, we predicted twelve potential agents for glioma patients with higher riskscore.
Conclusion: In all, our results highlighted a potential 4-chemokine signature for predicting prognosis in glioma and reflected the intricate immune landscape in glioma. It also threw light on integrating tailored risk stratification with precision therapy for glioblastoma.
Keywords: chemokine; glioma; immunotherapy; prognostic signature; tumor microenvironment.
© 2022 The Authors. CNS Neuroscience & Therapeutics published by John Wiley & Sons Ltd.
Conflict of interest statement
The authors have no conflict of interest.
Figures


Similar articles
-
Optimization of cancer immunotherapy through pyroptosis: A pyroptosis-related signature predicts survival benefit and potential synergy for immunotherapy in glioma.Front Immunol. 2022 Aug 3;13:961933. doi: 10.3389/fimmu.2022.961933. eCollection 2022. Front Immunol. 2022. PMID: 35990696 Free PMC article.
-
Comprehensive analysis of oxidative stress-related lncRNA signatures in glioma reveals the discrepancy of prognostic and immune infiltration.Sci Rep. 2023 May 12;13(1):7731. doi: 10.1038/s41598-023-34909-y. Sci Rep. 2023. PMID: 37173373 Free PMC article.
-
Multicellular gene network analysis identifies a macrophage-related gene signature predictive of therapeutic response and prognosis of gliomas.J Transl Med. 2019 May 16;17(1):159. doi: 10.1186/s12967-019-1908-1. J Transl Med. 2019. PMID: 31097021 Free PMC article.
-
Advances in research on immune escape mechanism of glioma.CNS Neurosci Ther. 2023 Jul;29(7):1709-1720. doi: 10.1111/cns.14217. Epub 2023 Apr 23. CNS Neurosci Ther. 2023. PMID: 37088950 Free PMC article. Review.
-
The PTEN-associated immune prognostic signature reveals the landscape of the tumor microenvironment in glioblastoma.J Neuroimmunol. 2023 Mar 15;376:578034. doi: 10.1016/j.jneuroim.2023.578034. Epub 2023 Jan 24. J Neuroimmunol. 2023. PMID: 36791582 Review.
Cited by
-
Prognostic impact of sodium fluorescein-guided microsurgery on cognitive function, neuropeptide dynamics, and short-term outcomes in brain glioma patients.Am J Cancer Res. 2024 Apr 15;14(4):1880-1891. doi: 10.62347/WFSK7541. eCollection 2024. Am J Cancer Res. 2024. PMID: 38726289 Free PMC article.
-
Targeted Glioma Therapy via TMVP1 Peptide-Modified FLT4 Liposomes: A Novel Molecular Probe Strategy.Int J Nanomedicine. 2025 Apr 23;20:5231-5246. doi: 10.2147/IJN.S517222. eCollection 2025. Int J Nanomedicine. 2025. PMID: 40292403 Free PMC article.
-
Integrated bulk and single cell sequencing with experimental validation identifies type 2 diabetes biomarkers.Sci Rep. 2025 Aug 7;15(1):28924. doi: 10.1038/s41598-025-14915-y. Sci Rep. 2025. PMID: 40775456 Free PMC article.
-
Hypoxia-related THBD+ macrophages as a prognostic factor in glioma: Construction of a powerful risk model.J Cell Mol Med. 2024 May;28(10):e18393. doi: 10.1111/jcmm.18393. J Cell Mol Med. 2024. PMID: 38809929 Free PMC article.
-
Integration of scRNA-seq and bulk tissue RNA-seq data to identify cancer-associated fibroblast-related gene RGMA as a potential treatment target for esophageal cancer.Funct Integr Genomics. 2025 Jul 11;25(1):154. doi: 10.1007/s10142-025-01660-8. Funct Integr Genomics. 2025. PMID: 40643758
References
-
- Stupp R, Mason WP, van den Bent MJ, et al. Radiotherapy plus concomitant and adjuvant temozolomide for glioblastoma. N Engl J Med. 2005;352(10):987‐996. - PubMed
-
- Jiang T, Nam D‐H, Ram Z, et al. Clinical practice guidelines for the management of adult diffuse gliomas. Cancer Lett. 2021;499:60‐72. - PubMed
-
- Hu H, Mu Q, Bao Z, et al. Mutational landscape of secondary glioblastoma guides MET‐targeted trial in brain tumor. Cell. 2018;175(6):1665‐1678.e1618. - PubMed
-
- Fan WH, Shao MY, Zhang JW, Jin GS, Liu FS, Xu FJ. A hybrid nanovector of suicide gene engineered lentivirus coated with bioreducible polyaminoglycosides for enhancing therapeutic efficacy against glioma. Adv Funct Mater. 2019;29(11):1807104.
Publication types
MeSH terms
Substances
LinkOut - more resources
Full Text Sources
Medical
Research Materials
Miscellaneous
