. 2022 Nov 10;81(12):1669-1677.
doi: 10.1136/ard-2022-222871.

Stage-specific roles of microbial dysbiosis and metabolic disorders in rheumatoid arthritis

Affiliations

Stage-specific roles of microbial dysbiosis and metabolic disorders in rheumatoid arthritis

Mingyue Cheng et al. Ann Rheum Dis. .

Abstract

Objective: Rheumatoid arthritis (RA) is a progressive disease including four stages, where gut microbiome is associated with pathogenesis. We aimed to investigate stage-specific roles of microbial dysbiosis and metabolic disorders in RA.

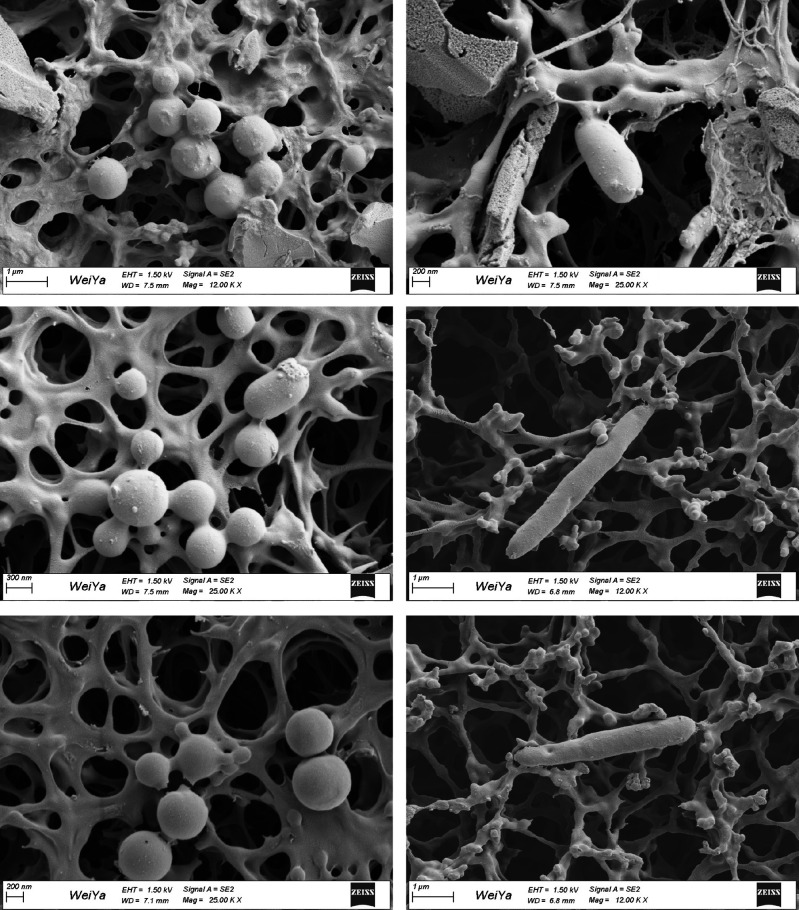
Methods: We investigated stage-based profiles of faecal metagenome and plasma metabolome of 76 individuals with RA grouped into four stages (stages I-IV) according to 2010 RA classification criteria, 19 individuals with osteroarthritis and 27 healthy individuals. To verify bacterial invasion of joint synovial fluid, 16S rRNA gene sequencing, bacterial isolation and scanning electron microscopy were conducted on another validation cohort of 271 patients from four RA stages.

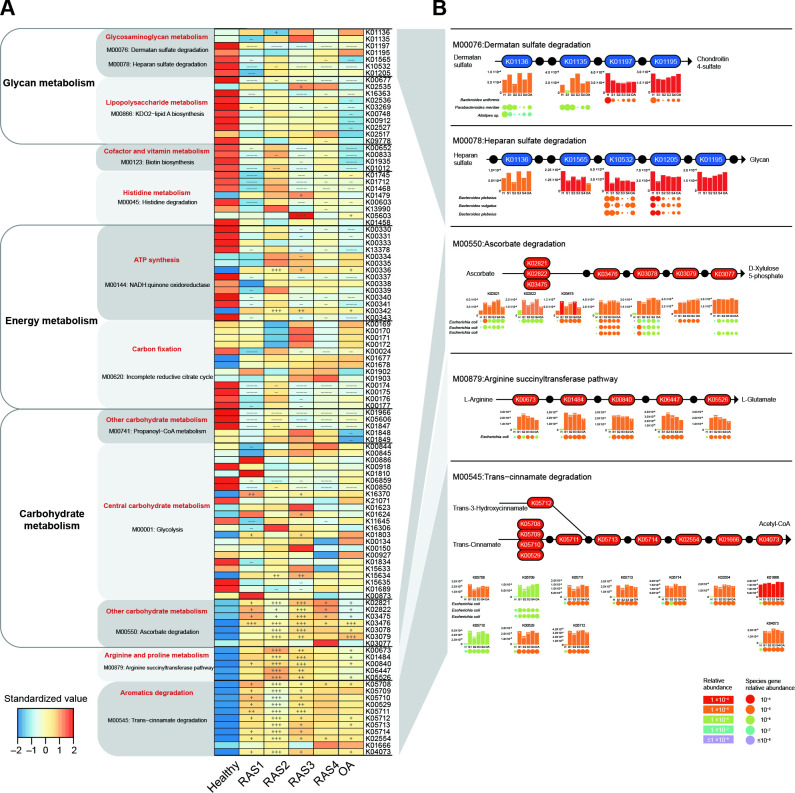
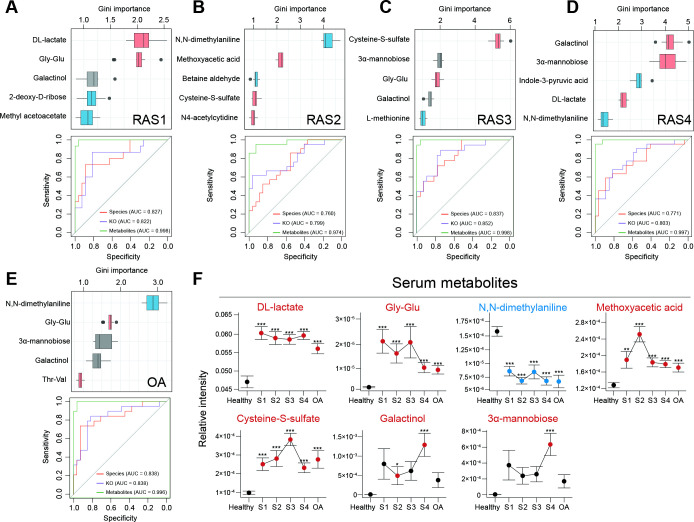
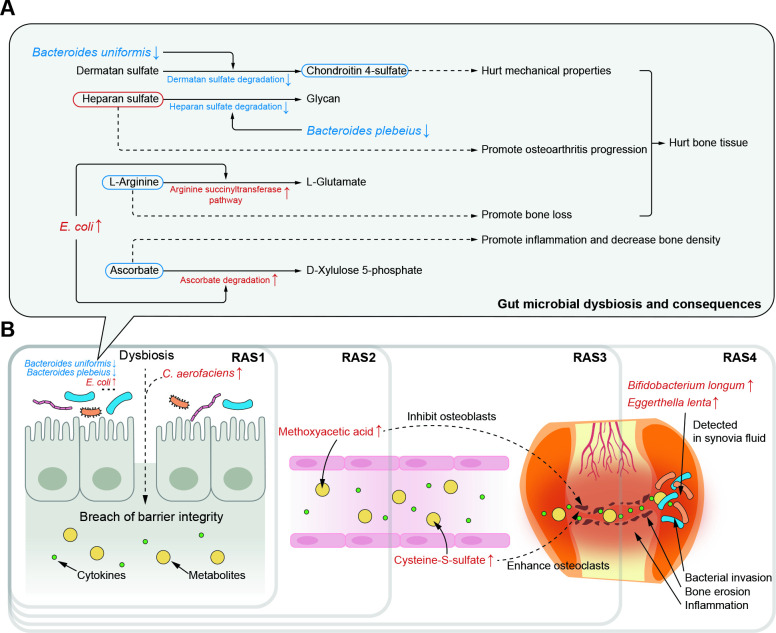
Results: First, depletion of Bacteroides uniformis and Bacteroides plebeius weakened glycosaminoglycan metabolism (p<0.001), continuously hurting articular cartilage across four stages. Second, elevation of Escherichia coli enhanced arginine succinyltransferase pathway in the stage II and stage III (p<0.001), which was correlated with the increase of the rheumatoid factor (p=1.35×10⁻³) and could induce bone loss. Third, abnormally high levels of methoxyacetic acid (p=1.28×10⁻⁸) and cysteine-S-sulfate (p=4.66×10⁻¹²) inhibited osteoblasts in the stage II and enhanced osteoclasts in the stage III, respectively, promoting bone erosion. Fourth, continuous increase of gut permeability may induce gut microbial invasion of the joint synovial fluid in the stage IV.

Conclusions: Clinical microbial intervention should consider the RA stage, where microbial dysbiosis and metabolic disorders present distinct patterns and played stage-specific roles. Our work provides a new insight in understanding gut-joint axis from a perspective of stages, which opens up new avenues for RA prognosis and therapy.

Keywords: osteoarthritis; rheumatoid arthritis; rheumatoid factor; synovial fluid.


Conflict of interest statement

Competing interests: None declared.

Figures

Figure 1
Figure 1
Stage-specific microbial functional profiles. Gene abundances were assessed for elevation or depletion in each of the arthritis stages, RAS1 (n=15), RAS2 (n=21), RAS3 (n=18), RAS4 (n=22) and OA (n=19) compared with the healthy individuals (n=27). (A) Relative abundance of KO genes in the KEGG modules that were significantly correlated with arthritis (q<0.1 or qpartial <0.1, see online supplemental figure S1). KO genes with a prevalence of 5% or higher are shown. (B) KO genes involved in specific KEGG pathway modules in (A) are shown in the KEGG pathway maps. Each box in a pathway represents a KO gene and is marked in red for elevation or in blue for depletion at any of the stages compared with healthy individuals. Bar plots show relative gene abundances averaged over samples within each of the five groups (healthy (H), RAS1 (S1), RAS2 (S2), RAS3 (S3), RAS4 (S4) and OA) and are coloured according to the values. Each KO gene is composed of MGS genes represented by circles. The sizes and colours of the circles are proportional to the relative abundances of the MGS genes. MGS genes are grouped into one row and indicated by the taxonomic name. The three MGS that most drove the correlation of the KEGG modules with arthritis types are shown. In all panels, significant changes are denoted as follows: +++, elevation with p<0.005; ++, elevation with p<0.01; +, elevation with p<0.05; −−−, depletion with p<0.005; −−, depletion with p<0.01; −, depletion at p<0.05; Mann-Whitney-Wilcoxon test. KEGG, Kyoto Encyclopaedia of Genes and Genomes; KO, KEGG ortholog; MGS, metagenomic species; OA, osteoarthritis.
Figure 2
Figure 2
Scanning electron microscopy of the joint synovial fluid.
Figure 3
Figure 3
Multiomics diagnostic potential for the RA stage. A random forest algorithm was performed on 6224 KOs, 232 microbial species and 277 plasma metabolites in RAS1 (A), RAS2 (B), RAS3 (C), RAS4 (D) and OA (E). The Gini importance of the top five most discriminant metabolites are displayed. Boxes represent the IQR between the first and third quartiles and the line inside represents the median. Whiskers denote the lowest and highest values within the 1.5×IQR from the first and third quartiles, respectively. Boxes are marked in a specific colour to show the significant elevation (p<0.05, red, Mann-Whitney-Wilcoxon test) or depletion (p<0.05, blue, Mann-Whitney-Wilcoxon test) of the features in each of the arthritis stages compared with the healthy group. The ROC curves of the random forest model using microbial species, KOs, or metabolites were plotted, with AUC calculated by 10 randomised 10-fold cross-validation. The colour of the curve represents the category of the used features. (F) The dot plots show stage-specific abundance or concentration (mean±SE) of plasma metabolites, which are specified in (A–E). Four RA stages are connected to display the variance. Dots are coloured differently if the features are significantly elevated (red) or significantly depleted (blue), as compared with those of the healthy group. *p<0.05, **p<0.01, ***p<0.005; Mann-Whitney-Wilcoxon test. AUC, area under curve; KEGG, Kyoto Encyclopaedia of Genes and Genomes; KO, KEGG ortholog; OA, osteoarthritis; RA, rheumatoid arthritis; ROC, receiver operating characteristic.
Figure 4
Figure 4
Potential pathogenesis across successive RA stages from multiomics perspective. (A) Potential mechanisms by which gut microbial dysbiosis play roles in RA pathogenesis through hurting hone tissue and increasing inflammation. The driving species, microbial dysfunction and related metabolites were extracted from figure 1B. The red or blue box of metabolites represents their speculated elevation or depletion according to the KEGG map. The dotted line represents the speculated effects of microbial and metabolic variation on arthritis pathogenesis. (B) The most representative effects of microbial dysbiosis and metabolic disorders on RA progression across successive stages. KEGG, Kyoto Encyclopaedia of Genes and Genomes; RA, rheumatoid arthritis.

References

    1. Almutairi K, Nossent J, Preen D, et al. . The global prevalence of rheumatoid arthritis: a meta-analysis based on a systematic review. Rheumatol Int 2021;41:863–77. 10.1007/s00296-020-04731-0 - DOI - PubMed
    1. Smolen JS, Aletaha D, McInnes IB. Rheumatoid arthritis. Lancet 2016;388:2023–38. 10.1016/S0140-6736(16)30173-8 - DOI - PubMed
    1. Aletaha D, Neogi T, Silman AJ, et al. . 2010 rheumatoid arthritis classification criteria: an American College of Rheumatology/European League against rheumatism collaborative initiative. Arthritis & Rheumatism 2010;62:2569–81. 10.1002/art.27584 - DOI - PubMed
    1. Steinbrocker O, Traeger CH, Batterman RC. Therapeutic criteria in rheumatoid arthritis. J Am Med Assoc 1949;140:659–62. 10.1001/jama.1949.02900430001001 - DOI - PubMed
    1. Barhum L. What does rheumatoid arthritis progression look like? 2021. Available: https://www.verywellhealth.com/rheumatoid-arthritis-stages-of-progressio...