. 2022 Dec;33(12):2259-2275.
doi: 10.1681/ASN.2022030378. Epub 2022 Aug 19.

Inflammation in Children with CKD Linked to Gut Dysbiosis and Metabolite Imbalance

Affiliations

Inflammation in Children with CKD Linked to Gut Dysbiosis and Metabolite Imbalance

Johannes Holle et al. J Am Soc Nephrol. 2022 Dec.

Abstract

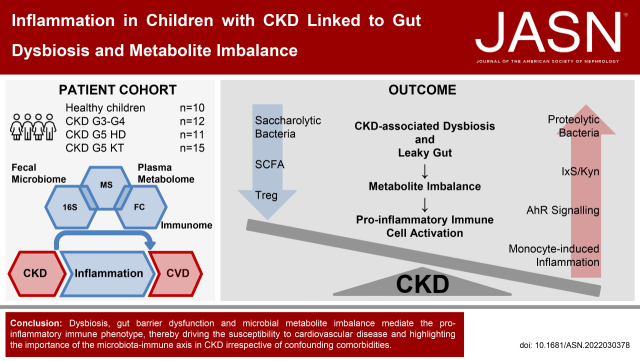
Background: CKD is characterized by a sustained proinflammatory response of the immune system, promoting hypertension and cardiovascular disease. The underlying mechanisms are incompletely understood but may be linked to gut dysbiosis. Dysbiosis has been described in adults with CKD; however, comorbidities limit CKD-specific conclusions.

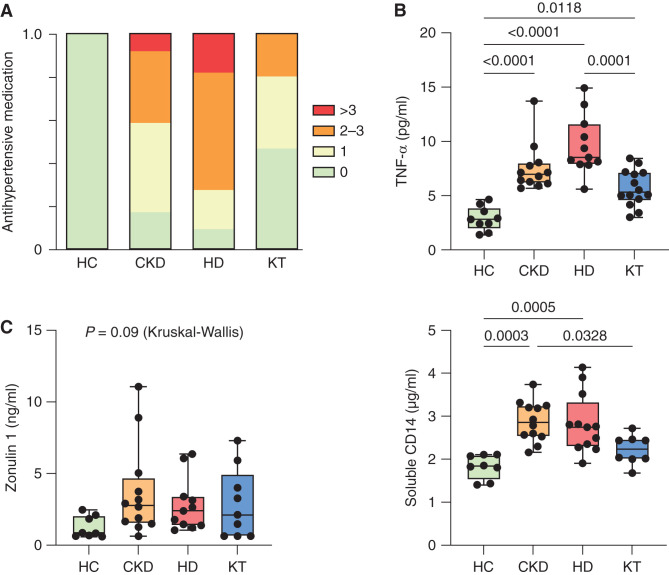
Methods: We analyzed the fecal microbiome, metabolites, and immune phenotypes in 48 children (with normal kidney function, CKD stage G3-G4, G5 treated by hemodialysis [HD], or kidney transplantation) with a mean±SD age of 10.6±3.8 years.

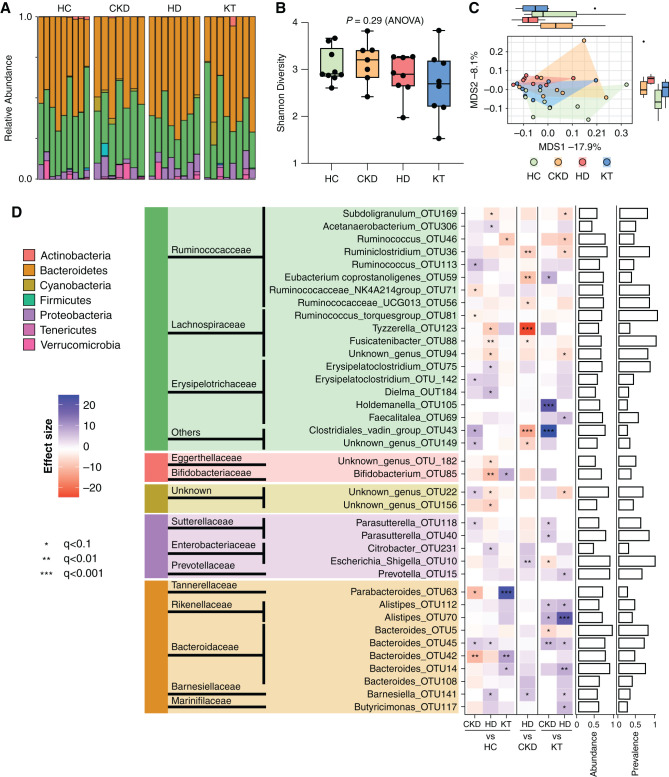
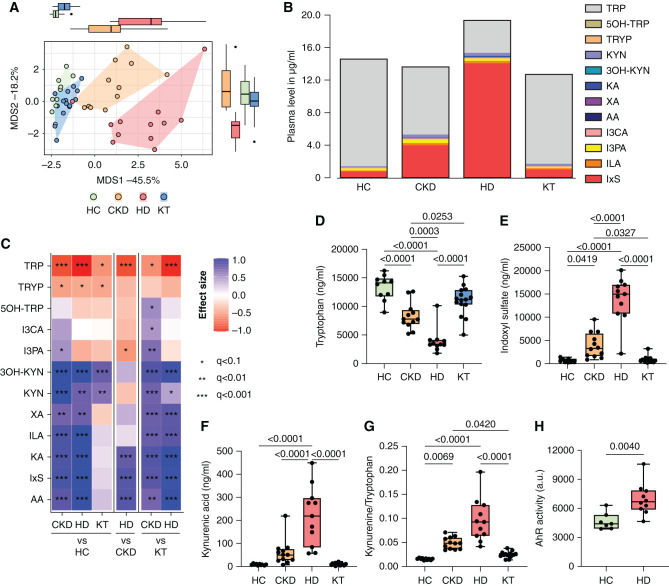
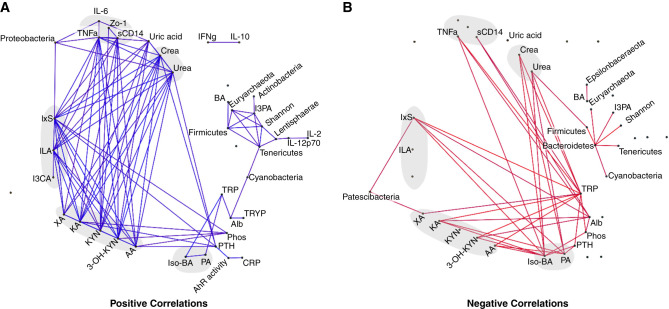
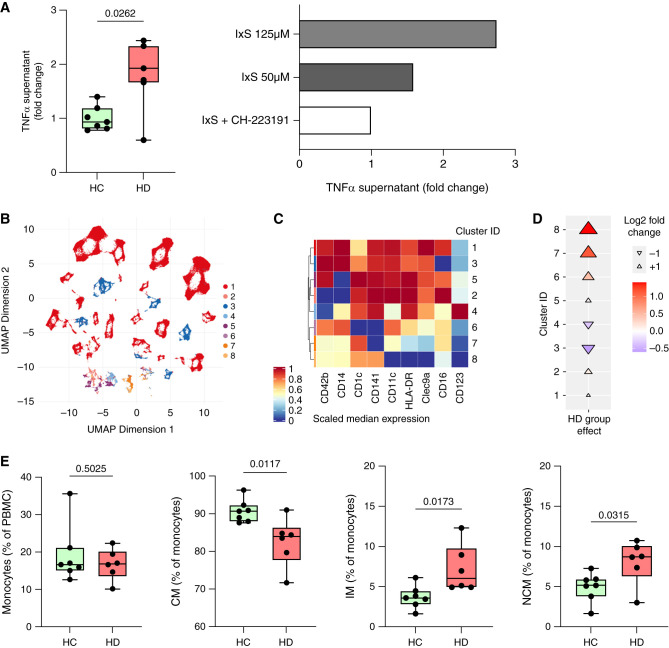
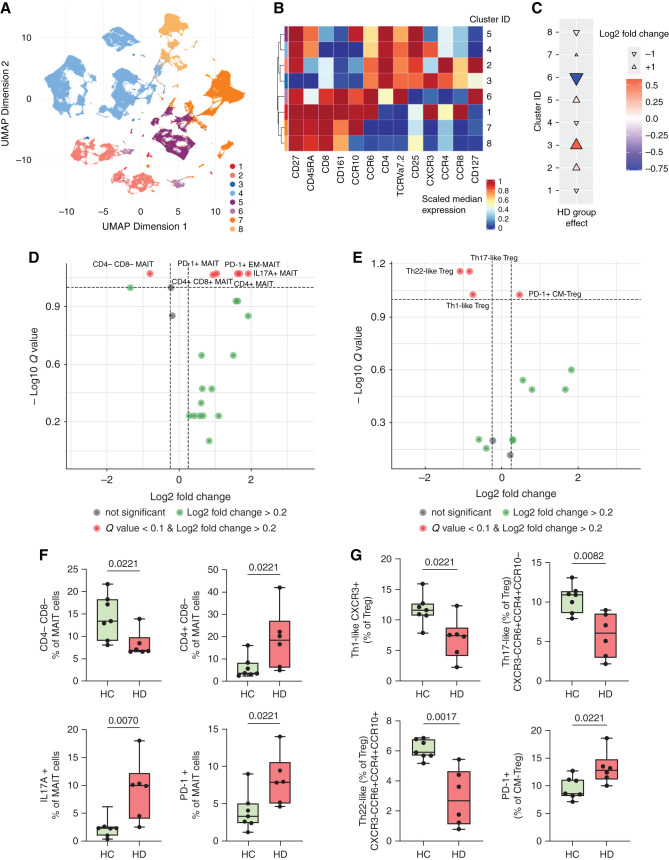
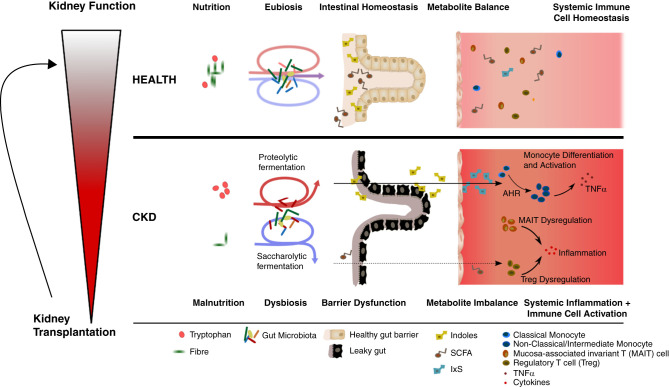
Results: Serum TNF-α and sCD14 were stage-dependently elevated, indicating inflammation, gut barrier dysfunction, and endotoxemia. We observed compositional and functional alterations of the microbiome, including diminished production of short-chain fatty acids. Plasma metabolite analysis revealed a stage-dependent increase of tryptophan metabolites of bacterial origin. Serum from patients on HD activated the aryl hydrocarbon receptor and stimulated TNF-α production in monocytes, corresponding to a proinflammatory shift from classic to nonclassic and intermediate monocytes. Unsupervised analysis of T cells revealed a loss of mucosa-associated invariant T (MAIT) cells and regulatory T cell subtypes in patients on HD.

Conclusions: Gut barrier dysfunction and microbial metabolite imbalance apparently mediate the proinflammatory immune phenotype, thereby driving the susceptibility to cardiovascular disease. The data highlight the importance of the microbiota-immune axis in CKD, irrespective of confounding comorbidities.

Keywords: cardiovascular disease; children; chronic inflammation; chronic kidney disease; dysbiosis; hypertension; immunology; pediatric nephrology; vascular disease.


Figures

None
Graphical abstract
Figure 1.
Figure 1.
Arterial hypertension and systemic inflammation are linked to impaired intestinal barrier function in pediatric CKD. (A) The number of antihypertensive drugs per individual (n=48 patients) is shown in patients with CKD (CKD G3–4), those with HD, patients after KT, and HCs. (B) Plasma TNF-α (n=46 patients) was analyzed by chemiluminescence immunoassay. (C) Gut barrier function was assessed using Zo-1 and sCD14 (n=40 patients) ELISA measurements in plasma. Data are shown as a box (median and interquartile range) and whiskers (minimum–maximum) with overlaid dot plot. P≤0.05 is shown, as measured by ordinary one-way ANOVA or Kruskal–Wallis test followed by Tukey or Dunn post hoc correction for multiple comparisons, as appropriate.
Figure 2.
Figure 2.
Taxonomic changes of the gut microbiome are most pronounced in HD patients. Analysis of gut microbiota from 16S ribosomal RNA sequencing in children (n=32) with CKD (CKD G3–4), patients with HD, patients after KT, and HCs. (A) Relative abundance on the phylum level of individuals according to their respective group. (B) α-Diversity as measured by Shannon diversity. Data are shown as a box (median and interquartile range) and whiskers (minimum–maximum) with overlaid dot plot. (C) β-Diversity assessment by principal coordinate analysis on the basis of Canberra distance (P=0.01 by PERMANOVA). (D) Analyses of group differences on the OTU level are shown as a heatmap, and their phylogenetic origin is visualized on the genus, family, and phylum level. Patient groups were tested against each other (pairwise). The heatmap shows significant changes in abundance using the DESeq2 version 1.30.1 package. Multiple groups of the same genus reported by Lotus due to a lack of coverage in available phylogenetic databases are marked by numbers. Bar charts (right) show abundance and prevalence; abundance is calculated as log(genus count)/log(maximum[genus count]); prevalence for each genus is calculated across the whole dataset. All significance estimates were adjusted for multiple tests using BH-FDR correction. MDS, multidimensional scaling. *q<0.1, **q<0.01, ***q<0.001.
Figure 3.
Figure 3.
Stage-dependent activation of plasma TRP metabolism activates the AhR. TRP and its metabolites were measured in plasma of children at different stages of CKD compared with HCs (n=48). (A) Multivariate analysis (principal coordinate analysis) of all measured metabolites discriminates between patients with CKD G3–4, patients on HD, patients after KT, and HCs. (B) Cumulative load of TRP and its metabolites. (C) Univariate analysis, depicted as a heatmap, shows effect sizes (Cliff δ) for each pair of patient groups. Colors denote the effect directions (blue, positive; red, negative) and magnitudes (the darker the color, the stronger the magnitude); asterisks represent the association significance. Statistical significance was assessed by MWU test and BH-FDR correction. Group differences of (D) TRP, (E) IxS, and (F) kynurenic acid (KA) were further visualized in box plots. (G) The KYN/TRP ratio indicates the activity of TRP degradation to KYN metabolites. (H) The activity of the AhR was analyzed using a transfected reporter cell line after 48 hours of incubation with serum of HCs (n=7) and patients on HD (n=10). P≤0.05 is shown, as measured by ordinary one-way ANOVA or Kruskal–Wallis test and adjusted by post hoc Tukey or Dunn correction for multiple testing (D–G) or by t test (H). Data are shown as a box (median and interquartile range) and whiskers (minimum–maximum) with overlaid dot plot. AA, anthranilic acid; I3CA, indole-3-carboxyaldehyde; ILA, indole lactate; MDS, multidimensional scaling; I3PA, indole-3-propionic acid; 3OH-KYN, 3-hydroxykynurenine; 5OH-TRP, 5-hydroxytryptophan; TRYP, tryptamin; XA, xanthurenic acid. *q<0.1, **q<0.01, ***q<0.001.
Figure 4.
Figure 4.
Kidney function correlates with markers of gut bacteria-driven inflammation. Laboratory parameters, TRP metabolites (n=48), cytokines (n=46), and taxonomic data (n=32) were associated using pairwise Spearman correlations and adjusted for multiple testing using BH-FDR correction. Edges for which absolute Rho>0.3 and Q<0.1 are visualized. For better visualization, eGFR was removed because creatinine and urea convey similar information. (A) Positive correlations. (B) Negative correlations. AA, anthranilic acid; Alb, albumin; BA, butyric acid; Crea, creatinine; CRP, C-reactive protein; I3CA, indole-3-carboxyaldehyde; ILA, indole lactate; I3PA, indole-3-propionic acid; Iso-BA, isobutyric acid; 3-OH-KYN, 3-hydroxykynurenine; PA, propionic acid; phos, phosphate; TRYP, tryptamin; XA, xanthurenic acid.
Figure 5.
Figure 5.
Monocyte subtypes promote inflammation in CKD. Monocytes isolated from healthy donors were incubated with serum from patients on HD (n=7) and HCs (n=7). Monocytes were incubated with IxS in presence or absence of the AhR antagonist CH-223191 (10 µM). (A) TNF-α was measured in the culture supernatant after 24-hour incubation using ELISA. PBMCs were isolated from patients on HD (n=6) and HCs (n=7) for surface staining and multicolor flow cytometry was performed. (B) Unsupervised clustering by FlowSOM revealed eight different cell clusters characterized by (B) the differential expression of nine surface markers describing myeloid and dendritic cells. (D) Cuneiform plots depict the log2fc for these clusters between patients on HD and HCs (indicated by color, size, and directionality of the triangles). (E) Classic hierarchic gating of total, classic (CM; CD16+), nonclassic (NCM; CD14+), and intermediate (IM; CD14+CD16+) monocytes is shown. UMAP, Uniform Manifold Approximation and Projection.
Figure 6.
Figure 6.
HD patients display proinflammatory phenotypes in mucosa-associated invariant T cells and regulatory T cells. (A) Unsupervised clustering of patients on HD (n=6) and HCs (n=7) by FlowSOM revealed eight T cell clusters on the basis of (B) the differential expression of surface marker. (C) Cuneiform plots showing the log2fc for these clusters between patients on HD and HCs (indicated by color, size, and directionality of the triangles). Volcano plot of (D) MAIT and (E) Treg subpopulations by hierarchic gating. The y axis indicates Q value by MWU test and BH-FDR correction; x axis indicates log2fc between patients on HD and HCs. Significantly altered subpopulations are depicted as box (median and interquartile range) and whiskers (minimum–maximum) with overlaid dot plots for (F) MAIT cells and (G) Treg cells. For (F) and (G), P≤0.05 is shown, as measured by t test or MWU test as appropriate. UMAP, Uniform Manifold Approximation and Projection.
Figure 7.
Figure 7.
Gut microbiome - host interaction promotes chronic inflammation in children with CKD. Pediatric patients with CKD stage dependently develop a leaky gut barrier and systemic imbalance of microbiome-derived metabolites. Patients with CKD exhibit a reduction in SCFA and an increase of indole metabolites of bacterial origin due to alterations of the taxonomic composition of the gut microbiome and nutritional alterations. These changes are associated with increased serum TNF-α levels, AhR-dependent secretion of TNF-α from monocytes, and a shift from classic to intermediate and nonclassic monocytes. Additionally, patients with CKD show a dysregulation of MAIT and Treg cell subsets. KT leads to a partial normalization of these dysregulated features.

References

    1. Gansevoort RT, Correa-Rotter R, Hemmelgarn BR, Jafar TH, Heerspink HJ, Mann JF, et al. : Chronic kidney disease and cardiovascular risk: Epidemiology, mechanisms, and prevention. Lancet 382: 339–352, 2013 - PubMed
    1. Claro LM, Moreno-Amaral AN, Gadotti AC, Dolenga CJ, Nakao LS, Azevedo MLV, et al. : The impact of uremic toxicity induced inflammatory response on the cardiovascular burden in chronic kidney disease. Toxins (Basel) 10: 384, 2018 - PMC - PubMed
    1. Onal EM, Afsar B, Covic A, Vaziri ND, Kanbay M: Gut microbiota and inflammation in chronic kidney disease and their roles in the development of cardiovascular disease. Hypertens Res 42: 123–140, 2019 - PubMed
    1. Vanholder R, Schepers E, Pletinck A, Nagler EV, Glorieux G: The uremic toxicity of indoxyl sulfate and p-cresyl sulfate: A systematic review. J Am Soc Nephrol 25: 1897–1907, 2014 - PMC - PubMed
    1. Vaziri ND, Wong J, Pahl M, Piceno YM, Yuan J, DeSantis TZ, et al. : Chronic kidney disease alters intestinal microbial flora. Kidney Int 83: 308–315, 2013 - PubMed

Publication types

Substances