. 2022 Sep 28;42(39):7466-7481.
doi: 10.1523/JNEUROSCI.0682-22.2022.

STAT1 Contributes to Microglial/Macrophage Inflammation and Neurological Dysfunction in a Mouse Model of Traumatic Brain Injury

Affiliations

STAT1 Contributes to Microglial/Macrophage Inflammation and Neurological Dysfunction in a Mouse Model of Traumatic Brain Injury

Yongfang Zhao et al. J Neurosci. .

Abstract

Traumatic brain injury (TBI) triggers a plethora of inflammatory events in the brain that aggravate secondary injury and impede tissue repair. Resident microglia (Mi) and blood-borne infiltrating macrophages (MΦ) are major players of inflammatory responses in the post-TBI brain and possess high functional heterogeneity. However, the plasticity of these cells has yet to be exploited to develop therapies that can mitigate brain inflammation and improve the outcome after TBI. This study investigated the transcription factor STAT1 as a key determinant of proinflammatory Mi/MΦ responses and aimed to develop STAT1 as a novel therapeutic target for TBI using a controlled cortical impact model of TBI on adult male mice. TBI induced robust upregulation of STAT1 in the brain at the subacute injury stage, which occurred primarily in Mi/MΦ. Intraperitoneal administration of fludarabine, a selective STAT1 inhibitor, markedly alleviated proinflammatory Mi/MΦ responses and brain inflammation burden after TBI. Such phenotype-modulating effects of fludarabine on post-TBI Mi/MΦ were reproduced by tamoxifen-induced, selective KO of STAT1 in Mi/MΦ (STAT1 mKO). By propelling Mi/MΦ away from a detrimental proinflammatory phenotype, STAT1 mKO was sufficient to reduce long-term neurologic deficits and brain lesion size after TBI. Importantly, short-term fludarabine treatment after TBI elicited long-lasting improvement of TBI outcomes, but this effect was lost on STAT1 mKO mice. Together, our study provided the first line of evidence that STAT1 causatively determines the proinflammatory phenotype of brain Mi/MΦ after TBI. We also showed promising preclinical data supporting the use of fludarabine as a novel immunomodulating therapy to TBI.SIGNIFICANCE STATEMENT The functional phenotype of microglia and macrophages (Mi/MΦ) critically influences brain inflammation and the outcome after traumatic brain injury (TBI); however, no therapies have been developed to modulate Mi/MΦ functions to treat TBI. Here we report, for the first time, that the transcription factor STAT1 is a key mediator of proinflammatory Mi/MΦ responses in the post-TBI brain, the specific deletion of which ameliorates neuroinflammation and improves long-term functional recovery after TBI. We also show excellent efficacy of a selective STAT1 inhibitor fludarabine against TBI-induced functional deficits and brain injury using a mouse model, presenting STAT1 as a promising therapeutic target for TBI.

Keywords: behavioral test; conditional gene KO; controlled cortical impact; fludarabine; neuroinflammation; signal transducer and activator of transcription 1.


Figures

Figure 1.
Figure 1.
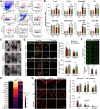
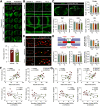
STAT1 is elevated in brain microglia/macrophages after TBI and worsens TBI outcome. A-C, Mice were subjected to TBI induced by CCI or sham injury. Expression of STAT1 in various types of cells in the brain was examined at 2, 24, and 72 h after TBI using flow cytometry. n = 3-6 mice per group. A, Flow cytometry gating strategy for microglia/macrophages (Mi/MΦ; Ly6GCD11b+CD45+), astrocytes (GLAST+), oligodendrocytes (Olig; O4+), and other CNS cells (CD11bCD45GLASTO4). STAT1-immunopositive cells were gated in each cell type based on the Fluorescence Minus One (FMO) control. B, The numbers of STAT1+ cells were quantified in all live cells, Mi/MΦ, astrocytes, oligodendrocytes, and other CNS cells, and were expressed as percentages of all cells of that type. One-way ANOVA and Bonferroni post hoc. Live cell: F(3,11) = 52.31, p < 0.0001. 2 h versus sham t(11) = 2.306, p = 0.2496; 24 h versus sham t(11) = 9.789, p < 0.0001; 72 h versus sham t(11) = 10.10, p < 0.0001. Mi/MΦ: F(3,11) = 182.7, p < 0.0001. 2 h versus sham t(11) = 5.149, p = 0.0019; 24 h versus sham t(11) = 16.42, p < 0.0001; 72 h versus sham t(11) = 20.62, p < 0.0001. Astrocyte: F(3,11) = 3.369, p = 0.0584. Oligodendrocyte: F(3,11) = 3.116, p = 0.0704. Other CNS cell: F(3,11) = 1.277, p = 0.3302. C, Cellular composition of all STAT1+ live cells. More than 50% of STAT1+ cells were Mi/MΦ in all groups. D, E, Mice were subjected to TBI and received intraperitoneal injections of fludarabine (Flu) at 2, 5, or 10 mg/kg beginning at 2 h after TBI and then daily for 5 d. Neurologic deficits were assessed before (Pre) and up to 14 d after TBI using the adhesive removal (D) and foot fault (E) tests. n = 7 or 8 mice per group. Two-way repeated measures ANOVA and Bonferroni post hoc. D, Time to touch: F(3,27) = 9.854, p = 0.0001. Main effect: 2 mg/kg versus vehicle t(27) = 4.191, p = 0.0008; 5 mg/kg versus vehicle t(27) = 4.846, p = 0.0001; 10 mg/kg versus vehicle t(27) = 4.058, p = 0.0011. Individual day: 3 d-2 mg/kg versus vehicle t(162) = 5.199, p < 0.0001; 5 mg/kg versus vehicle t(162) = 5.761, p < 0.0001; 10 mg/kg versus vehicle t(162) = 3.920, p = 0.0004. 5 d-2 mg/kg versus vehicle t(162) = 3.065, p = 0.0077; 5 mg/kg versus vehicle t(162) = 3.274, p = 0.0039; 10 mg/kg versus vehicle t(162) = 2.644, p = 0.0270. 7 d-2 mg/kg versus vehicle t(162) = 2.503, p = 0.0399; 5 mg/kg versus vehicle t(162) = 3.242, p = 0.0043; 10 mg/kg versus vehicle t(162) = 3.296, p = 0.0036. 10 d-2 mg/kg versus vehicle t(162) = 2.247, p = 0.0780; 5 mg/kg versus vehicle t(162) = 2.953, p = 0.0109; 10 mg/kg versus vehicle t(162) = 3.391, p = 0.0026. Time to remove: F(3,27) = 16.14, p < 0.0001. Main effect: 2 mg/kg versus vehicle t(27) = 5.283, p < 0.0001; 5 mg/kg versus vehicle t(27) = 5.967, p < 0.0001; 10 mg/kg versus vehicle t(27) = 5.616, p < 0.0001. Individual day: 3 d-2 mg/kg versus vehicle t(162) = 7.979, p < 0.0001; 5 mg/kg versus vehicle t(162) = 8.786, p < 0.0001; 10 mg/kg versus vehicle t(162) = 7.023, p < 0.0001. 5 d-2 mg/kg versus vehicle t(162) = 3.413, p = 0.0024; 5 mg/kg versus vehicle t(162) = 3.851, p = 0.0005; 10 mg/kg versus vehicle t(162) = 4.063, p = 0.0002. 7 d-2 mg/kg versus vehicle t(162) = 2.052, p = 0.1252; 5 mg/kg versus vehicle t(162) = 2.525, p = 0.0376; 10 mg/kg versus vehicle t(162) = 2.171, p = 0.0943. 10 d-2 mg/kg versus vehicle t(162) = 1.464, p = 0.4351; 5 mg/kg versus vehicle t(162) = 2.133, p = 0.1033; 10 mg/kg versus vehicle t(162) = 2.917, p = 0.0121. E, Forepaw: F(3,27) = 4.742, p = 0.0088. Main effect: 2 mg/kg versus vehicle t(27) = 1.017, p = 0.9544; 5 mg/kg versus vehicle t(27) = 3.358, p = 0.0070; 10 mg/kg versus vehicle t(27) = 2.702, p = 0.0353. Individual day: 3 d-2 mg/kg versus vehicle t(162) = 1.647, p = 0.3048; 5 mg/kg versus vehicle t(162) = 4.003, p = 0.0003; 10 mg/kg versus vehicle t(162) = 3.649, p = 0.0011. 5 d-2 mg/kg versus vehicle t(162) = 0.1783, p > 0.9999; 5 mg/kg versus vehicle t(162) = 3.027, p = 0.0086; 10 mg/kg versus vehicle t(162) = 2.128, p = 0.1046. 10 d-2 mg/kg versus vehicle t(162) = 0.8142, p > 0.9999; 5 mg/kg versus vehicle t(162) = 2.463, p = 0.0445; 10 mg/kg versus vehicle t(162) = 1.408, p = 0.4833. 14 d-2 mg/kg versus vehicle t(162) = 1.520, p = 0.3916; 5 mg/kg versus vehicle t(162) = 1.986, p = 0.1463; 10 mg/kg versus vehicle t(162) = 2.300, p = 0.0682. Hindpaw: F(3,27) = 13.18, p < 0.0001. Main effect: 2 mg/kg versus vehicle t(27) = 0.7755, p > 0.9999; 5 mg/kg versus vehicle t(27) = 5.219, p < 0.0001; 10 mg/kg versus vehicle t(27) = 4.249, p = 0.0007. Individual day: 3 d-2 mg/kg versus vehicle t(162) = 0.8897, p > 0.9999; 5 mg/kg versus vehicle t(162) = 3.664, p = 0.0010; 10 mg/kg versus vehicle t(162) = 2.284, p = 0.0710. 5 d-2 mg/kg versus vehicle t(162) = 0.4636, p > 0.9999; 5 mg/kg versus vehicle t(162) = 4.274, p < 0.0001; 10 mg/kg versus vehicle t(162) = 3.817, p = 0.0006. 10 d-2 mg/kg versus vehicle t(162) = 0.8445, p > 0.9999; 5 mg/kg versus vehicle t(162) = 2.171, p = 0.0941; 10 mg/kg versus vehicle t(162) = 2.219, p = 0.0837. 14 d-2 mg/kg versus vehicle t(162) = 0.8728, p > 0.9999; 5 mg/kg versus vehicle t(162) = 2.699, p = 0.0231; 10 mg/kg versus vehicle t(162) = 2.313, p = 0.0659. Data are mean ± SD. ##p < 0.01; ###p < 0.001; TBI versus sham control. *p < 0.05; **p < 0.01; ***p < 0.001; fludarabine versus vehicle control.
Figure 2.
Figure 2.
Inhibition of STAT1 with fludarabine mitigates neuroinflammation and subacute brain injury after TBI. Mice were subjected to TBI, and were treated with fludarabine (Flu; 5 mg/kg) or vehicle for 5 d. A, B, Infiltration of peripheral immune cells into the post-TBI brain was assessed using flow cytometry 5 d after TBI. n = 6 mice per group. A, Flow cytometry gating strategy for various immune cells in the brain. Macrophages (MΦ) were further gated into Ly6C+ and Ly6C subpopulations. B, The numbers of immune cells in the ipsilesional (IL) and noninjured contralesional (CL) brain hemispheres were quantified. One-way ANOVA and Bonferroni post hoc. T cell: F(3,20) = 22.06, p < 0.0001. Veh IL versus CL t(20) = 7.121, p < 0.0001; Flu IL versus CL t(20) = 0.3327, p > 0.9999; IL Flu versus veh t(20) = 6.167, p < 0.0001. B cell: F(3,20) = 26.97, p < 0.0001. Veh IL versus CL t(20) = 7.119, p < 0.0001; Flu IL versus CL t(20) = 5.349, p = 0.0002; IL Flu versus veh t(20) = 1.786, p = 0.5354. Neutrophil: F(3,20) = 167.9, p < 0.0001. Veh IL versus CL t(20) = 19.12, p < 0.0001; Flu IL versus CL t(20) = 8.027, p < 0.0001; IL Flu versus veh t(20) = 11.61, p < 0.0001. Dendritic cell: F(3,20) = 39.97, p < 0.0001. Veh IL versus CL t(20) = 9.084, p < 0.0001; Flu IL versus CL t(20) = 5.942, p < 0.0001; IL Flu versus veh t(20) = 2.589, p = 0.1053. Microglia: F(3,20) = 32.78, p < 0.0001. Veh IL versus CL t(20) = 8.277, p < 0.0001; Flu IL versus CL t(20) = 4.980, p = 0.0004; IL Flu versus veh t(20) = 3.234, p = 0.0249. Macrophage: F(3,20) = 337.0, p < 0.0001. Veh IL versus CL t(20) = 24.36, p < 0.0001; Flu IL versus CL t(20) = 20.16, p < 0.0001; IL Flu versus veh t(20) = 4.461, p = 0.0014. Ly6C+ macrophage: F(3,20) = 416.8, p < 0.0001. Veh IL versus CL t(20) = 28.65, p < 0.0001; Flu IL versus CL t(20) = 20.14, p < 0.0001; IL Flu versus veh t(20) = 7.709, p < 0.0001. Ly6C macrophage: F(3,20) = 189.8, p < 0.0001. Veh IL versus CL t(20) = 17.49, p < 0.0001; Flu IL versus CL t(20) = 16.11, p < 0.0001; IL Flu versus veh t(20) = 2.068, p = 0.3112. C, D, A panel of 40 inflammatory markers was measured in the IL brain hemisphere 5 d after TBI. Noninjured CL hemispheres were used as baseline control. n = 5 or 6 mice per group. C, Representative blots with significantly altered markers labeled. D, Heatmap represents the mean expression levels of 14 markers significantly upregulated in vehicle-treated TBI brains compared with baseline control. Control group was pooled from both vehicle- and fludarabine-treated mice, between which there were no differences. One-way ANOVA and Bonferroni post hoc: IL-1β: F(2,14) = 10.62, p = 0.0016; Veh IL versus CL t(14) = 4.568, p = 0.0013; Flu IL versus CL t(14) = 1.645, p = 0.3665; IL Flu versus veh t(14) = 2.999, p = 0.0287. IL-17A: F(2,14) = 10.44, p = 0.0017; Veh IL versus CL t(14) = 4.452, p = 0.0016; Flu IL versus CL t(14) = 1.216, p = 0.7326; IL Flu versus veh t(14) = 3.293, p = 0.0160. TNFR1: F(2,14) = 9.958, p = 0.0020; Veh IL versus CL t(14) = 4.210, p = 0.0026; Flu IL versus CL t(14) = 0.7050, p > 0.9999; IL Flu versus veh t(14) = 3.538, p = 0.0098. Leptin: F(2,14) = 8.834, p = 0.0033; Veh IL versus CL t(14) = 4.077, p = 0.0034; Flu IL versus CL t(14) = 1.045, p = 0.9413; IL Flu versus veh t(14) = 3.081, p = 0.0244. BLC: F(2,14) = 26.64, p < 0.0001; Veh IL versus CL t(14) = 7.268, p < 0.0001; Flu IL versus CL t(14) = 4.068, p = 0.0035; IL Flu versus veh t(14) = 3.389, p = 0.0132. IL-2: F(2,14) = 6.366, p = 0.0108; Veh IL versus CL t(14) = 3.374, p = 0.0136; Flu IL versus CL t(14) = 0.5886, p > 0.9999; IL Flu versus veh t(14) = 2.813, p = 0.0415. IL-3: F(2,14) = 7.419, p = 0.0064; Veh IL versus CL t(14) = 3.264, p = 0.0170; Flu IL versus CL t(14) = 0.2424, p > 0.9999; IL Flu versus veh t(14) = 3.495, p = 0.0107. TNFSF8: F(2,14) = 8.465, p = 0.0039; Veh IL versus CL t(14) = 4.071, p = 0.0034; Flu IL versus CL t(14) = 1.418, p = 0.5342; IL Flu versus veh t(14) = 2.719, p = 0.0498. One-way ANOVA on ranks and Dunn's post hoc: FasL: H(2) = 8.724, p = 0.0061; Veh IL versus CL Z = 2.540, p = 0.0333; Flu IL versus CL Z = 0.1143, p > 0.9999; IL Flu versus veh Z = 2.649, p = 0.0242. E, The phenotype of microglia/macrophages was examined in the IL cortex and striatum 5 d after TBI by CD16/32 and arginase 1 (Arg1) immunostaining, double-labeled with the microglial/macrophage marker Iba1. Left panels, Representative images taken from the IL cortex. Rectangle represents a cell enlarged and 3D-rendered in the third column. No double-positive cell was observed in the CL side. The numbers of Iba1+CD16/32+ cells and Iba1+Arg1+ cells were counted in the IL cortex and striatum and summarized in the right panels. n = 6 mice per group. Two-way ANOVA and Bonferroni post hoc. Iba1+CD16/32+ cells: F(1,20) = 4.895, p = 0.0387. Fludarabine versus vehicle t(20) = 2.646, p = 0.0310 (cortex); t(20) = 0.4833, p > 0.9999 (striatum). Iba1+Arg1+ cells: F(1,20) = 12.91, p = 0.0018. Fludarabine versus vehicle t(20) = 2.383, p = 0.0545 (cortex); t(20) = 2.699, p = 0.0276 (striatum). F, Tissue loss was assessed 5 d after TBI on serial coronal brain sections immunostained for the neuronal marker NeuN. Dashed line indicates the relative area of the contralesional hemisphere to illustrate ipsilesional tissue loss. n = 6 mice per group. Unpaired t test: t(10) = 3.833, p = 0.0033. G, Axonal injury was assessed 5 d after TBI using NF200 and β-APP double-label immunostaining. Shown are representative images taken from the CC, EC, and striatum in the IL and CL brain hemispheres. Dashed line indicates the boundary of CC/EC. Right panels, NF200- and β-APP-immunopositive areas were measured and summarized. n = 6 mice per group. Two-way ANOVA and Bonferroni post hoc. NF200+ area: F(1,30) = 13.27, p = 0.0010. Fludarabine versus vehicle t(30) = 1.856, p = 0.2197 (CC); t(30) = 1.546, p = 0.3979 (EC); t(30) = 2.907, p = 0.0204 (striatum). β-APP+ area: F(1,30) = 47.20, p < 0.0001. Fludarabine versus vehicle t(30) = 8.501, p < 0.0001 (CC); t(30) = 2.363, p = 0.0745 (EC); t(30) = 1.036, p = 0.9251 (striatum). Data are mean ± SD. ###p < 0.001; IL versus CL. *p < 0.05; **p < 0.01; ***p < 0.001; fludarabine versus vehicle.
Figure 3.
Figure 3.
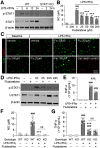
Inhibition or KO of STAT1 ameliorates proinflammatory microglial responses in vitro. Primary microglia were cultured from neonatal C57BL/6 (WT) mice or global STAT1 KO mice. Cells were treated with the STAT1 inhibitor fludarabine for 24 h, followed by stimulation with LPS (100 ng/ml) and IFNγ (20 ng/ml). A, Western blotting was performed at 2, 6, 12, and 24 h after LPS+IFNγ stimulation to assess phosphorylation of STAT1 (p-STAT1; Tyr701) and expression of total STAT1 in microglia. β-actin was used as an internal loading control. STAT1 KO microglia were used as negative control to demonstrate antibody specificity. B, C, Microglia were treated with 25, 50, 100, or 200 μm of fludarabine. B, Microglial production of NO was measured in culture medium 24 h after LPS+IFNγ exposure. One-way ANOVA: F(6,20) = 51.23, p < 0.0001. Bonferroni post hoc: LPS+IFNγ versus baseline t(20) = 14.53, p < 0.0001; 25 μm versus vehicle t(20) = 6.238, p < 0.0001; 50 μm versus vehicle t(20) = 6.542, p < 0.0001; 100 μm versus vehicle t(20) = 7.483, p < 0.0001; 200 μm versus vehicle t(20) = 10.14, p < 0.0001. C, Cell viability was assessed 24 h after LPS+IFNγ stimulation using the live/dead assay. Cells treated with methanol served as positive control for cell death. D-G, Microglia were treated with 200 μm of fludarabine or vehicle (DMSO) for 24 h, followed by LPS+IFNγ stimulation. D, Phospho-STAT1 and total STAT1 were measured by Western blotting at 2 and 24 h after LPS+IFNγ stimulation. E, The content of TNF-α in culture medium was measured by ELISA at 24 h after LPS+IFNγ exposure. One-way ANOVA: F(3,11) = 900.6, p < 0.0001. Bonferroni post hoc: LPS+IFNγ+vehicle versus baseline+vehicle t(11) = 42.74, p < 0.0001; LPS+IFNγ+fludarabine versus baseline+fludarabine t(11) = 23.66, p < 0.0001; LPS+IFNγ+fludarabine versus LPS+IFNγ+vehicle t(11) = 19.60, p < 0.0001. F, G, Production of NO (F) and TNF-α (G) from WT and STAT1 KO microglia 24 h after LPS+IFNγ stimulation, with or without fludarabine pretreatment. F, One-way ANOVA: F(4,20) = 53.58, p < 0.0001. Bonferroni post hoc: WT LPS+IFNγ versus WT baseline t(20) = 11.07, p < 0.0001; KO LPS+IFNγ versus KO baseline t(20) = 0.5159, p > 0.9999; KO LPS+IFNγ versus WT LPS+IFNγ t(20) = 11.92, p < 0.0001; KO LPS+IFNγ+fludarabine versus KO LPS+IFNγ t(20) = 0.1202, p > 0.9999. G, One-way ANOVA: F(4,19) = 123.4, p < 0.0001. Bonferroni post hoc: WT LPS+IFNγ versus WT baseline t(19) = 19.20, p < 0.0001; KO LPS+IFNγ versus KO baseline t(19) = 7.052, p < 0.0001; KO LPS+IFNγ versus WT LPS+IFNγ t(19) = 12.15, p < 0.0001; KO LPS+IFNγ+fludarabine versus KO LPS+IFNγ t(19) = 1.475, p > 0.9999. Data represent 3-5 independent cultures. Data are mean ± SD. ###p < 0.001; LPS+IFNγ versus baseline. ***p < 0.001; fludarabine versus vehicle control (B,E) or STAT1 KO versus WT (F,G).
Figure 4.
Figure 4.
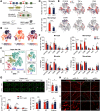
In vivo targeted KO of STAT1 alleviates proinflammatory responses of microglia and macrophages and subacute brain injury after TBI. A, Generation of microglia/macrophage-targeted STAT1 KO (STAT1 mKO) mice. LoxP sites were engineered flanking the first two untranslated exons and the first translated exon of the Stat1 gene. When crossed to Cx3cr1CreER mice, the LoxP sites recombine and delete the floxed region of Stat1, knocking out the protein in CX3CR1-expressing cells in the presence of tamoxifen. B-F, STAT1 mKO mice and WT control mice were subjected to TBI, and flow cytometry was performed 3 d after TBI to assess the phenotype of microglia and macrophages in the ipsilesional brain hemisphere. n = 5 mice per group. B, C, Representative t-SNE plots of 12,000 CD45+ cells pooled from one WT and one STAT1 mKO mouse brain. Each dot represents one cell. Shown are the expression levels of prototypic cell markers in CD45+ cells (B) that identified major cell types in C: microglia (CD11b+CD45low), macrophage (CD11b+CD45high), neutrophil (Ly6G+), and lymphocyte (CD11bCD45high). Color represents fluorescence intensity on a logarithmic scale (B) or cell type (C). D, The numbers of microglia (Ly6GCD11b+CD45low cells) and macrophages (Ly6GCD11b+CD45high cells) were quantified. Unpaired t test: t(8) = 0.6955, p = 0.5064 (microglia); t(8) = 11.13, p < 0.0001 (macrophage). E, t-SNE plots of all microglia and macrophages illustrate cells from WT and STAT1 mKO mice that were immunopositive for a panel of proinflammatory (CD16/32, TNF-α, CD86) and anti-inflammatory (CD206, arginase 1, IL-10) markers. F, The numbers of microglia and macrophages positive for each marker were determined after manual gating and expressed as cell number per 1000 single cells (top panels) or percentages of total microglia or macrophages (bottom panels). Two-way ANOVA and Bonferroni post hoc. Microglia number: F(1,48) = 13.78, p = 0.0005. STAT1 mKO versus WT t(48) = 2.442, p = 0.1100 (CD16/32); t(48) = 3.193, p = 0.0149 (TNF-α); t(48) = 2.940, p = 0.0302 (CD86); t(48) = 0.2207, p > 0.9999 (CD206); t(48) = 1.336, p > 0.9999 (Arg1); t(48) = 0.5980, p > 0.9999 (IL-10). Macrophage number: F(1,48) = 214.2, p < 0.0001. STAT1 mKO versus WT t(48) = 8.159, p < 0.0001 (CD16/32); t(48) = 8.789, p < 0.0001 (TNF-α); t(48) = 11.02, p < 0.0001 (CD86); t(48) = 1.702, p = 0.5714 (CD206); t(48) = 2.886, p = 0.0350 (Arg1); t(48) = 3.294, p = 0.0112 (IL-10). Microglia percentage: F(1,48) = 23.51, p < 0.0001. STAT1 mKO versus WT t(48) = 2.901, p = 0.0336 (CD16/32); t(48) = 4.784, p = 0.0001 (TNF-α); t(48) = 3.610, p = 0.0044 (CD86); t(48) = 0.4432, p > 0.9999 (CD206); t(48) = 2.060, p = 0.2689 (Arg1); t(48) = 1.034, p > 0.9999 (IL-10). Macrophage percentage: F(1,48) = 4.790, p = 0.0335. STAT1 mKO versus WT t(48) = 0.4748, p > 0.9999 (CD16/32); t(48) = 2.997, p = 0.0259 (TNF-α); t(48) = 2.176, p = 0.2070 (CD86); t(48) = 0.4075, p > 0.9999 (CD206); t(48) = 1.839, p = 0.4323 (Arg1); t(48) = 1.718, p = 0.5531 (IL-10). G, Tissue loss was assessed 5 d after TBI on serial coronal brain sections immunostained for NeuN. n = 9 or 10 mice per group. Unpaired t test: t(17) = 2.366, p = 0.0301. H, Axonal injury was assessed 5 d after TBI using NF200 and β-APP double-label immunostaining. Shown are representative images taken from CC, EC, and striatum in the IL and CL brain hemispheres. Dashed line indicates the boundary of CC/EC. I, Summarized data on NF200- and β-APP-immunopositive areas. n = 6 mice per group. Two-way ANOVA and Bonferroni post hoc. NF200+ area: F(1,30) = 23.19, p < 0.0001. STAT1 mKO versus WT t(30) = 3.932, p = 0.0014 (CC); t(30) = 1.518, p = 0.4184 (EC); t(30) = 2.892, p = 0.0212 (striatum). β-APP + area: F(1,30) = 55.11, p < 0.0001. STAT1 mKO versus WT t(30) = 7.541, p < 0.0001 (CC); t(30) = 3.271, p = 0.0081 (EC); t(30) = 2.046, p = 0.1487 (striatum). Data are mean ± SD. *p < 0.05; **p < 0.01; ***p < 0.001; STAT1 mKO versus WT.
Figure 5.
Figure 5.
Selective deletion of STAT1 in microglia/macrophages is sufficient to improve long-term TBI outcomes. STAT1 mKO mice and WT mice were subjected to TBI induced by CCI or sham injury. One group of STAT1 mKO mice received post-TBI fludarabine treatment (Flu; 5 mg/kg) for 5 d. A-D, Sensorimotor deficits were assessed before (Pre) and up to 35 d after injury by the adhesive removal (A,B) and foot fault (C,D) tests. n = 8 (sham) or 12 (TB1) mice per group. Two-way repeated-measures ANOVA and Bonferroni post hoc. A, F(4,47) = 60.75, p < 0.0001. Main effect: mKO sham versus WT sham t(47) = 0.5964, p > 0.9999; WT TB1 versus WT sham t(47) = 13.25, p < 0.0001; mKO TB1 versus mKO sham t(47) = 6.685, p < 0.0001; mKO TB1 versus WT TB1 t(47) = 6.612, p < 0.0001; mKO TB1+Flu versus mKO TB1 t(47) = 0.8083, p > 0.9999. mKO TB1 versus WT TB1 on individual day: t(423) = 6.158, p < 0.0001 (day 3); t(423) = 4.127, p = 0.0004 (day 5); t(423) = 4.505, p < 0.0001 (day 14); t(423) = 3.867, p = 0.0013 (day 21); t(423) = 3.242, p = 0.0128 (day 28). B, F(4,47) = 55.15, p < 0.0001. Main effect: mKO sham versus WT sham t(47) = 0.7811, p > 0.9999; WT TB1 versus WT sham t(47) = 12.77, p < 0.0001; mKO TB1 versus mKO sham t(47) = 5.838, p < 0.0001; mKO TB1 versus WT TB1 t(47) = 6.798, p < 0.0001; mKO TBI+Flu versus mKO TBI t(47) = 0.1444, p > 0.9999. mKO TBI versus WT TBI on individual day: t(423) = 6.930, p < 0.0001 (day 3); t(423) = 5.303, p < 0.0001 (day 5); t(423) = 4.467, p = 0.0001 (day 14); t(423) = 3.097, p = 0.0208 (day 21); t(423) = 3.632, p = 0.0032 (day 28). C, F(4,47) = 137.5, p < 0.0001. Main effect: mKO sham versus WT sham t(47) = 0.1356, p > 0.9999; WT TBI versus WT sham t(47) = 18.88, p < 0.0001; mKO TBI versus mKO sham t(47) = 12.66, p < 0.0001; mKO TBI versus WT TBI t(47) = 6.782, p < 0.0001; mKO TBI+Flu versus mKO TBI t(47) = 1.633, p > 0.9999. mKO TBI versus WT TBI on individual day: t(423) = 4.781, p < 0.0001 (day 3); t(423) = 5.410, p < 0.0001 (day 5); t(423) = 4.701, p < 0.0001 (day 7); t(423) = 3.316, p = 0.0099 (day 10); t(423) = 3.829, p = 0.0015 (day 14); t(423) = 4.161, p = 0.0004 (day 21); t(423) = 3.341, p = 0.0091 (day 28); t(423) = 3.896, p = 0.0011 (day 35). D, F(4,47) = 277.2, p < 0.0001. Main effect: mKO sham versus WT sham t(47) = 0.07634, p > 0.9999; WT TBI versus WT sham t(47) = 26.93, p < 0.0001; mKO TBI versus mKO sham t(47) = 26.85, p < 0.0001; mKO TBI versus WT TBI t(47) = 11.02, p < 0.0001; mKO TBI+Flu versus mKO TBI t(47) = 0.4669, p > 0.9999. mKO TBI versus WT TBI on individual day: t(423) = 6.178, p < 0.0001 (day 5); t(423) = 4.581, p < 0.0001 (day 7); t(423) = 3.212, p = 0.0142 (day 14); t(423) = 4.726, p < 0.0001 (day 28); t(423) = 3.894, p = 0.0011 (day 35). E, F, The Morris water maze test was performed to assess spatial learning (E) and spatial memory (F) at 29-34 d after injury. n = 8 (sham) or 12 (TB1) mice per group. E, Two-way repeated-measures ANOVA and Bonferroni post hoc. F(4,47) = 13.88, p < 0.0001. Main effect: mKO sham versus WT sham t(47) = 0.05537, p > 0.9999; WT TB1 versus WT sham t(47) = 5.803, p < 0.0001; mKO TB1 versus mKO sham t(47) = 4.359, p = 0.0007; mKO TB1 versus WT TB1 t(47) = 1.683, p = 0.9907; mKO TB1+Flu versus mKO TB1 t(47) = 0.6104, p > 0.9999. mKO TB1 versus WT TB1 on individual day: t(235) = 3.125, p = 0.0200 (day 30). F, One-way ANOVA: F(4,47) = 2.333, p = 0.0694. G, H, Chronic tissue loss was assessed 35 d after TB1 on serial coronal brain sections immunostained for NeuN. n = 8 mice per group. G, Representative images showing NeuN immunofluorescence in 6 brain sections encompassing the TB1 lesion. H, Summarized data on the volumes of brain tissue loss. Unpaired t test: t(14) = 2.425, p = 0.0294. Data are mean ± SD. ###p < 0.001; TB1 versus sham. *p < 0.05; **p < 0.01; ***p < 0.001; STAT1 mKO versus WT.
Figure 6.
Figure 6.
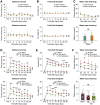
Post-TB1 treatment with the STAT1 inhibitor fludarabine promotes long-term recovery of neurologic functions. Mice were subjected to TB1 or sham injury, and were treated with fludarabine (5 mg/kg) or vehicle for 5 d. A-C, Sensorimotor deficits were assessed before (Pre) and up to 35 d after sham injury by the adhesive removal (A) and foot fault (B) tests. The Morris water maze test (C) was performed to assess spatial learning and spatial memory at 29-34 d after sham injury. Fludarabine- and vehicle-treated mice demonstrated similar performance in all tests after sham injury. n = 4 mice per group. Two-way repeated-measures ANOVA. A, Time to touch: F(1,6) = 0.02923, p = 0.8699. Time to remove: F(1,6) = 0.001179, p = 0.9737. B, Forepaw: F(1,6) = 3.419, p = 0.1139. Hindpaw: F(1,6) = 0.3430, p = 0.5794. C, Learning: F(1,6) = 3.653, p = 0.1045. Unpaired t test: t(6) = 0.4540, p = 0.6658 (C, memory). D-F, The adhesive removal test (D), foot fault test (E), and Morris water maze test (F) were performed to assess sensorimotor and cognitive functions for up to 35 d after TB1. Sham group was pooled from both vehicle- and fludarabine-treated mice, between which there were no differences. n = 8-12 mice per group. Two-way repeated-measures ANOVA and Bonferroni post hoc. D, Time to touch: F(2,25) = 48.18, p < 0.0001. Main effect: TB1+vehicle versus sham t(25) = 9.810, p < 0.0001; TB1+fludarabine versus TB1+vehicle t(25) = 5.088, p < 0.0001. TB1+fludarabine versus TB1+vehicle on individual day: t(225) = 4.965, p < 0.0001 (day 3); t(225) = 3.934, p = 0.0003 (day 5); t(225) = 3.571, p = 0.0013 (day 7); t(225) = 3.288, p = 0.0035 (day 10); t(225) = 2.686, p = 0.0233 (day 14); t(225) = 3.230, p = 0.0043 (day 28). Time to remove: F(2,25) = 82.76, p < 0.0001. Main effect: TB1+vehicle versus sham t(25) = 12.82, p < 0.0001; TB1+fludarabine versus TB1+vehicle t(25) = 6.121, p < 0.0001. TB1+fludarabine versus TB1+vehicle on individual day: t(225) = 7.380, p < 0.0001 (day 3); t(225) = 3.184, p = 0.0050 (day 5); t(225) = 3.794, p = 0.0006 (day 7); t(225) = 4.138, p = 0.0001 (day 10); t(225) = 2.489, p = 0.0407 (day 14); t(225) = 3.471, p = 0.0019 (day 21); t(225) = 2.747, p = 0.0195 (day 28). E, Forepaw: F(2,25) = 753.6, p < 0.0001. Main effect: TB1+vehicle versus sham t(25) = 36.83, p < 0.0001; TB1+fludarabine versus TB1+vehicle t(25) = 9.910, p < 0.0001. TB1+fludarabine versus TB1+vehicle on individual day: t(225) = 5.414, p < 0.0001 (day 3); t(225) = 4.093, p = 0.0002 (day 5); t(225) = 4.937, p < 0.0001 (day 7); t(225) = 4.026, p = 0.0002 (day 10); t(225) = 2.590, p = 0.0307 (day 14); t(225) = 5.902, p < 0.0001 (day 28); t(225) = 3.653, p = 0.0010 (day 35). Hindpaw: F(2,25) = 165.5, p < 0.0001. Main effect: TB1+vehicle versus sham t(25) = 17.70, p < 0.0001; TB1+fludarabine versus TB1+vehicle t(25) = 6.173, p < 0.0001. TB1+fludarabine versus TB1+vehicle on individual day: t(225) = 3.536, p = 0.0015 (day 3); t(225) = 4.651, p < 0.0001 (day 5); t(225) = 3.886, p = 0.0004 (day 7); t(225) = 4.001, p = 0.0003 (day 10); t(225) = 4.252, p < 0.0001 (day 28); t(225) = 2.562, p = 0.0332 (day 35). F, Learning: F(2,25) = 13.08, p = 0.0001. Main effect: TB1+vehicle versus sham t(25) = 5.096, p < 0.0001; TB1+fludarabine versus TB1+vehicle t(25) = 3.162, p = 0.0122. TB1+fludarabine versus TB1+vehicle on individual day: t(125) = 2.759, p = 0.0200 (day 30). One-way ANOVA: F(2,25) = 1.343, p = 0.2793 (F, memory). Data are mean ± SD. ###p < 0.001; TB1 versus sham. *p < 0.05; **p < 0.01; ***p < 0.001; fludarabine versus vehicle control.
Figure 7.
Figure 7.
Post-TB1 fludarabine treatment elicits sustained improvement of brain integrity. A–E, Mice were subjected to TB1 and received fludarabine treatment (5 mg/kg) for 5 d. Immunofluorescence staining was performed 35 d after TB1 to assess brain injury and white matter integrity. A, Tissue loss was assessed on coronal brain sections immunostained for NeuN. n = 8-10 mice per group. Unpaired t test: t(16) = 2.465, p = 0.0254. B, C, The numbers of viable neurons were counted 35 d after TB1 in the cortex and hippocampal CA1, CA3, and dentate gyrus (DG) regions on NeuN (green)-immunostained images. Representative images taken from ROIs in C are shown in B. n = 6-8 mice per group. One-way ANOVA and Bonferroni post hoc. Cortex: F(3,28) = 11.15, p < 0.0001. Veh IL versus CL t(28) = 5.186, p = 0.0001; Flu IL versus CL t(28) = 2.471, p = 0.1190; IL Flu versus veh t(28) = 1.828, p = 0.4691. CA1: F(3,22) = 1.859, p = 0.1661. CA3: F(3,22) = 3.431, p = 0.0347. Veh IL versus CL t(22) = 3.115, p = 0.0303; Flu IL versus CL t(22) = 0.3761, p > 0.9999; IL Flu versus veh t(22) = 0.9607, p > 0.9999. DG: F(3,22) = 1.768, p = 0.1827. D, E, The integrity of NORs was assessed by double-label immunostaining of Caspr and Nav1.6 in the CC 35 d after TB1. Shown are representative images (D) and summarized data (E). Arrow indicates intact NOR. Arrowhead indicates damaged NOR. Rectangle represents the region enlarged in the right column. n = 8 mice per group. Number of intact NORs: one-way ANOVA: F(3,28) = 297.4, p < 0.0001. Bonferroni post hoc: Veh IL versus CL t(28) = 23.70, p < 0.0001; Flu IL versus CL t(28) = 17.56, p < 0.0001; IL Flu versus veh t(28) = 6.389, p < 0.0001. NOR length: one-way ANOVA: F(3,28) = 2.030, p = 0.1324. Paranode length: one-way ANOVA: F(3,28) = 45.25, p < 0.0001. Bonferroni post hoc: Veh IL versus CL t(28) = 10.02, p < 0.0001; Flu IL versus CL t(28) = 5.164, p = 0.0001; IL Flu versus veh t(28) = 4.515, p = 0.0006. Nav1.6+ area: one-way ANOVA: F(3,28) = 5.632, p = 0.0038. Bonferroni post hoc: Veh IL versus CL t(28) = 3.682, p = 0.0059; Flu IL versus CL t(28) = 1.816, p = 0.4808; IL Flu versus veh t(28) = 0.7838, p > 0.9999. Data are mean ± SD. #p < 0.05; ##p < 0.01; ###p < 0.001; IL versus CL. *p < 0.05; ***p < 0.001 fludarabine versus vehicle. F, G, Pearson correlation between the animals' performance in the adhesive removal test (F) and foot fault test (G), and immunohistochemical parameters representing gross brain tissue loss (top panels) and white mater integrity (number of intact NORs; bottom panels) 35 d after TB1. Lines indicate the fitted equation with 95% CIs.

References

    1. Alharfi IM, Charyk Stewart T, Al Helali I, Daoud H, Fraser DD (2014) Infection rates, fevers, and associated factors in pediatric severe traumatic brain injury. J Neurotrauma 31:452–458. 10.1089/neu.2013.2904 - DOI - PubMed
    1. Barrett JP, Henry RJ, Shirey KA, Doran SJ, Makarevich OD, Ritzel RM, Meadows VA, Vogel SN, Faden AI, Stoica BA, Loane DJ (2020) Interferon-beta plays a detrimental role in experimental traumatic brain injury by enhancing neuroinflammation that drives chronic neurodegeneration. J Neurosci 40:2357–2370. 10.1523/JNEUROSCI.2516-19.2020 - DOI - PMC - PubMed
    1. Berlex Canada (2003) FLUDARA® product monograph. Pointe-Claire, Quebec.
    1. Chen S, Ye J, Chen X, Shi J, Wu W, Lin W, Lin W, Li Y, Fu H, Li S (2018) Valproic acid attenuates traumatic spinal cord injury-induced inflammation via STAT1 and NF-kappaB pathway dependent of HDAC3. J Neuroinflammation 15:150. 10.1186/s12974-018-1193-6 - DOI - PMC - PubMed
    1. Durbin JE, Hackenmiller R, Simon MC, Levy DE (1996) Targeted disruption of the mouse Stat1 gene results in compromised innate immunity to viral disease. Cell 84:443–450. 10.1016/s0092-8674(00)81289-1 - DOI - PubMed

LinkOut - more resources