. 2022 Aug 19;13(1):4888.
doi: 10.1038/s41467-022-32376-z.

SARS CoV-2 mRNA vaccination exposes latent HIV to Nef-specific CD8+ T-cells

Affiliations

SARS CoV-2 mRNA vaccination exposes latent HIV to Nef-specific CD8+ T-cells

Eva M Stevenson et al. Nat Commun. .

Abstract

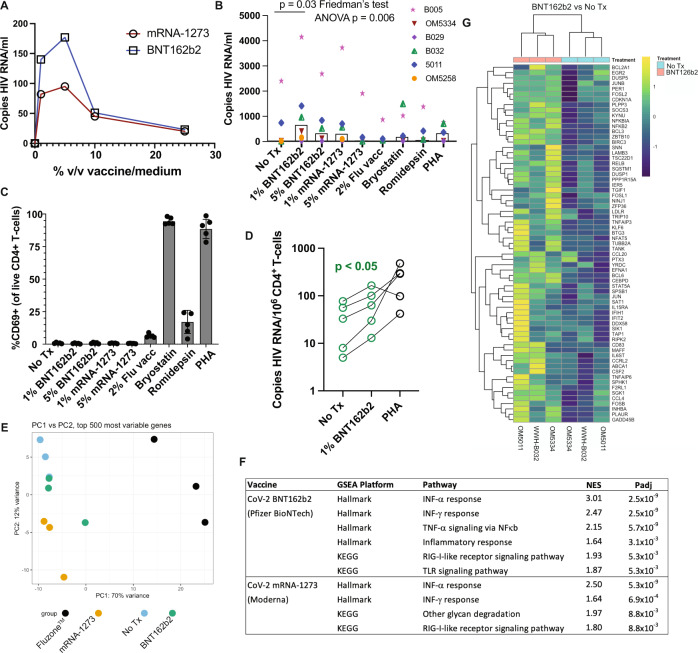
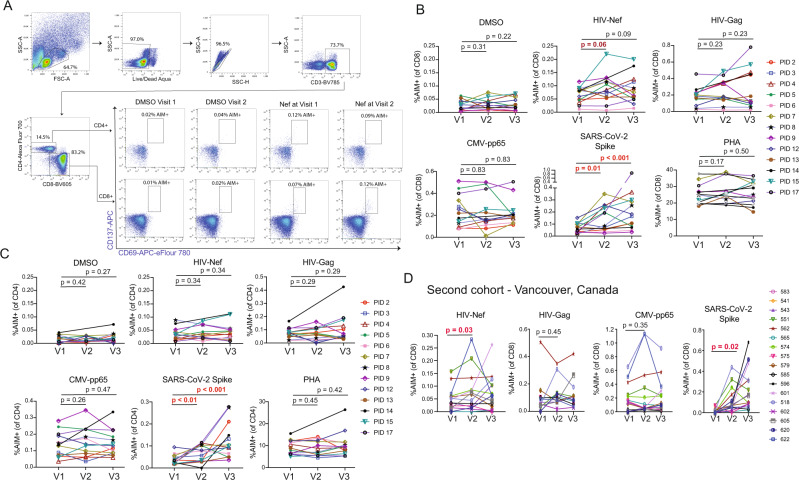
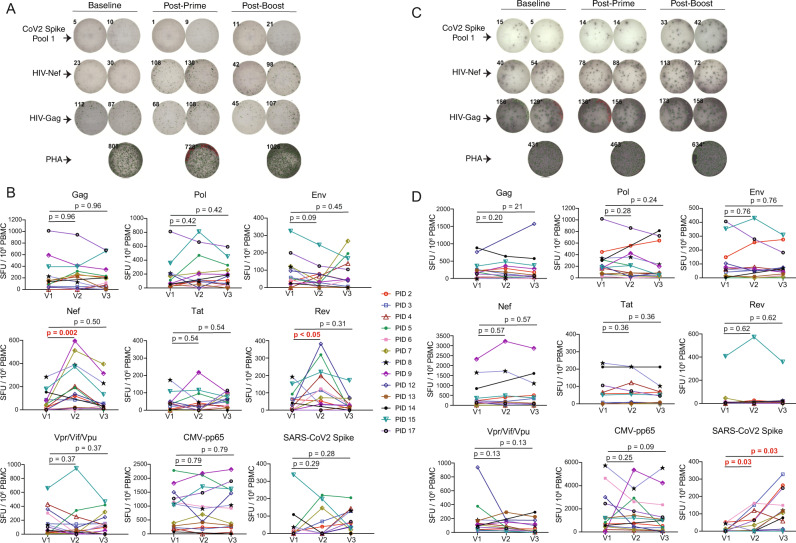
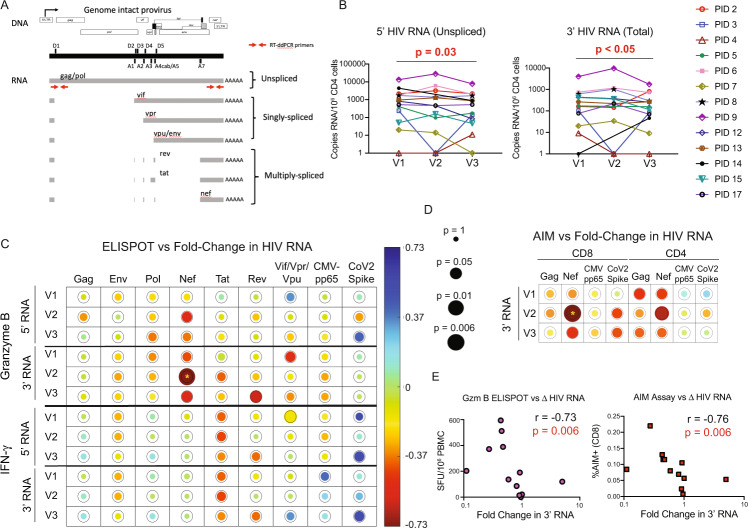
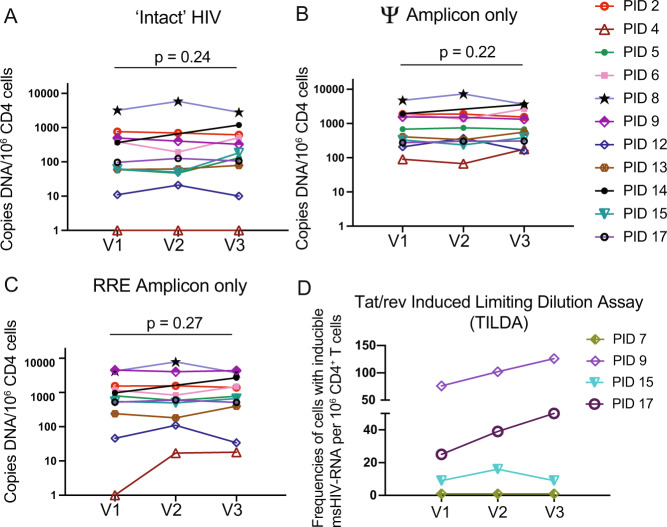
Efforts to cure HIV have focused on reactivating latent proviruses to enable elimination by CD8+ cytotoxic T-cells. Clinical studies of latency reversing agents (LRA) in antiretroviral therapy (ART)-treated individuals have shown increases in HIV transcription, but without reductions in virologic measures, or evidence that HIV-specific CD8+ T-cells were productively engaged. Here, we show that the SARS-CoV-2 mRNA vaccine BNT162b2 activates the RIG-I/TLR - TNF - NFκb axis, resulting in transcription of HIV proviruses with minimal perturbations of T-cell activation and host transcription. T-cells specific for the early gene-product HIV-Nef uniquely increased in frequency and acquired effector function (granzyme-B) in ART-treated individuals following SARS-CoV-2 mRNA vaccination. These parameters of CD8+ T-cell induction correlated with significant decreases in cell-associated HIV mRNA, suggesting killing or suppression of cells transcribing HIV. Thus, we report the observation of an intervention-induced reduction in a measure of HIV persistence, accompanied by precise immune correlates, in ART-suppressed individuals. However, we did not observe significant depletions of intact proviruses, underscoring challenges to achieving (or measuring) HIV reservoir reductions. Overall, our results support prioritizing the measurement of granzyme-B-producing Nef-specific responses in latency reversal studies and add impetus to developing HIV-targeted mRNA therapeutic vaccines that leverage built-in LRA activity.


Conflict of interest statement

The authors declare no competing interests.

Figures

Fig. 1
Fig. 1. The BNT162b2 mRNA vaccine stimulates the RIG-I/TLR – TNF-α – NFκb axis and activates HIV transcription ex vivo.
A qPCR measurements of HIV RNA in supernatants, 48 hours following ex vivo treatment of PBMCs from an ART-treated participant with the indicated concentrations of BNT126b2 (Pfizer BioNTech) or mRNA-1273 (Moderna) mRNA vaccines. B Extension of results from A to n = 6 ART-treated participants, adding treatments with 2% volume/volume Fluzone™ influenza vaccine, 25 nM bryostatin-1, 40 nM romidepsin, or 2 μg/ml phytohemagglutinin-L (PHA). P values were calculated by Friedman test with Dunn’s multiple comparison test (two-tailed). C Flow cytometry data from the same samples n = 5 donors harvested for (B) Shown are % CD69+ (activated) following gating on viable CD4+ T-cells. Data are presented as mean values +/− SD. D Cell-associated HIV RNA measures from the same samples as (B) P value of 0.0487 was calculated by a two-tailed paired t test between No Tx and 1% BNT162b2. EG Bulk mRNA-seq data was generated using a subset of the samples plotted in (WWH-B032, OM5011, and OM5334). B, E Principal component analysis (PCA). The results show that transcriptional profiles of BNT126b2- and mRNA-1273-treated cells are more similar to ‘No treatment’ and to each other than Fluzone™-treated cells. F Gene set enrichment analyses showing pathways activated following mRNA vaccine treatments. Benjamini–Hochberg corrected P-values were calculated with the fgsea packge by a two-sided Weighted Kolmogorov–Smirnov (WGS) test. G Heatmap of 67 genes in the leading edge for the TNFA_SIGNALING_VIA-NFKB pathway, comparing BNT126b2 to No treatment. Source data are provided as a Source Data file.
Fig. 2
Fig. 2. Timelines for the three clinical cohorts included in this study.
Shown are blood draw dates (V1, V2, and V3) alongside timings of SARS-CoV-2 mRNA vaccinations (Dose 1, Dose 2, and Dose 3).
Fig. 3
Fig. 3. Sustained increases in SARS-CoV-2-specific CD4+ and CD8+ T-cell responses and transient increases in HIV Nef-specific CD8 T-cells following COVID mRNA vaccination.
A Representative gating schematic for TCR-dependent activation induced marker (AIM) + populations (CD69+ CD137+) after stimulation with HIV, SARS-CoV-2 or CMV gene products. B, C Combined AIM + CD8+ and CD4+ T-cells results for n = 13 ARV-treated donors at baseline (V1), and ∼2 weeks after vaccine dose 1 (V2) or vaccine dose 2 (V3). CD8 + - B, CD4 + - C Data points represent means of duplicates. All responses are background (DMSO) subtracted, with the exception of the DMSO condition, which is shown as a mean of raw values. P values were calculated by one-tailed Wilcoxon matched-pairs signed rank test, adjusted for multiple comparisons using the Holm method. For the following comparisons where P values are given as <0.1 or <0.01 the exact p values are: SARS-CoV-2 Spike CD8 between V1 and V3 P = 0.0005, SARS-CoV-2 Spike CD4 between V1 and V2 P = 0.0093, between V1 and V3 P = 0.0007. D Results are analogous to panel B, but performed on a confirmatory cohort from Vancouver, Canada. P values were calculated by two-tailed Wilcoxon matched-pairs signed rank test, without multiple testing adjustments. Source data are provided as a Source Data file.
Fig. 4
Fig. 4. Transient increases in granzyme-B T-cell responses to early HIV-gene products following the first dose of SARS-CoV-2 mRNA vaccination.
A, C Representative ELISPOT results measuring granzyme-B (Gzm-B) (A), or IFN-γ (C). Peptide stimulations are plated in duplicates. B, D Combined ELISPOT results ART-treated donors at baseline (V1), and ~2 weeks after vaccine dose 1 (V2) or vaccine dose 2 (V3). Gzm-B – B, IFN-γ – D n = 13 donors for and V3, and n = 12 for V2 (donor 14 did not provide a V2 sample). Data points represents means of duplicates, following background (DMSO) subtraction. P values were calculated by one-tailed Wilcoxon matched-pairs signed rank test, adjusted for multiple comparisons using the Holm method. The exact P value for Gzm-B Rev between V1 and V2 is 0.02. Source data are provided as a Source Data file.
Fig. 5
Fig. 5. Cell-associated HIV RNA decreased across SARS-CoV-2 mRNA vaccination, in inversely correlating with Gzm-B T-cell responses to early gene products.
A Positions of RT-qPCR primer/probes. The 3’ primer/probes target all unspliced and spliced isoforms of HIV poly(A) RNA, whereas the 5’ primer/probes only target unspliced. B Cell-associated HIV RNA for n = 13 ART-treated donors at baseline (V1), and ∼2 weeks after vaccine dose 1 (V2) or vaccine dose 2 (V3). P values were calculated by one-tailed Wilcoxon matched-pairs signed rank tests, comparing V1 to V3, without adjustments for multiple testing. C, D Depiction of Spearman correlations between proportional changes (V3/V1) in HIV RNA and magnitudes of indicated T-cell responses measured at indicated visits by ELISPOT (C) or AIM assay (D). Circle sizes are proportional to P values, and color to Spearman’s R, as indicated in the scales shown. Analyses are for the n = 12 individuals who completed all 3 visits (donor 14 missed V2). The rings around each circle indicate the threshold P value of 0.05. Yellow asterisks indicate correlations that were significant following correction post hoc for multiple comparisons by the false discovery rate method of Benjamini and Hochberg using the SAS MULTTEST procedure (FDR option) (see also Supplementary Tables 4 and 5). E Plots of the most significant correlations from C (left panel) and D (right panel). Source data are provided as a Source Data file.
Fig. 6
Fig. 6. No consistent changes in HIV reservoir measures following COVID vaccinations.
AC Copies of the indicated HIV DNA species for ARV-treated donors at baseline (V1), and ~2 weeks after vaccine dose 1 (V2) or vaccine dose 2 (V3). P values were calculated by one-tailed Wilcoxon matched pairs signed rank test comparing V1 with V3. n = 13 at V1 and V3 and n = 12 at V2 (PID 14 missed V2). D Tat/rev induced limiting dilution assay results for the n = 4 study participants tested. Source data are provided as a Source Data file.

References

    1. Chun TW, et al. Presence of an inducible HIV-1 latent reservoir during highly active antiretroviral therapy. Proc. Natl Acad. Sci. USA. 1997;94:13193–13197. doi: 10.1073/pnas.94.24.13193. - DOI - PMC - PubMed
    1. Wong JK, et al. Recovery of replication-competent HIV despite prolonged suppression of plasma viremia. Science. 1997;278:1291–1295. doi: 10.1126/science.278.5341.1291. - DOI - PubMed
    1. Finzi D, et al. Identification of a reservoir for HIV-1 in patients on highly active antiretroviral therapy. Science. 1997;278:1295–1300. doi: 10.1126/science.278.5341.1295. - DOI - PubMed
    1. Deeks SG. HIV: Shock and kill. Nature. 2012;487:439–440. doi: 10.1038/487439a. - DOI - PubMed
    1. Shan L, et al. Stimulation of HIV-1-specific cytolytic T lymphocytes facilitates elimination of latent viral reservoir after virus reactivation. Immunity. 2012;36:491–501. doi: 10.1016/j.immuni.2012.01.014. - DOI - PMC - PubMed

Publication types