. 2022 Aug 19;13(1):4886.
doi: 10.1038/s41467-022-32512-9.

Socially meaningful visual context either enhances or inhibits vocalisation processing in the macaque brain

Affiliations

Socially meaningful visual context either enhances or inhibits vocalisation processing in the macaque brain

Mathilda Froesel et al. Nat Commun. .

Abstract

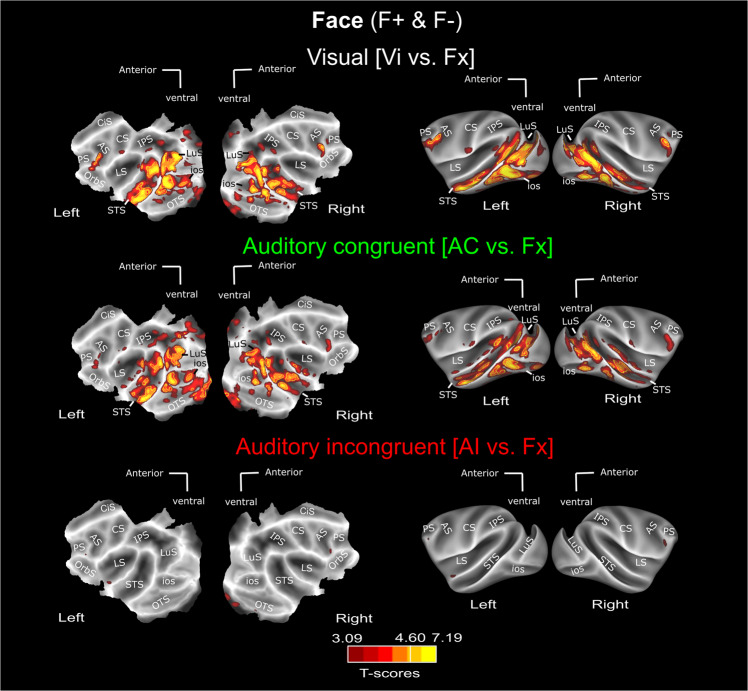
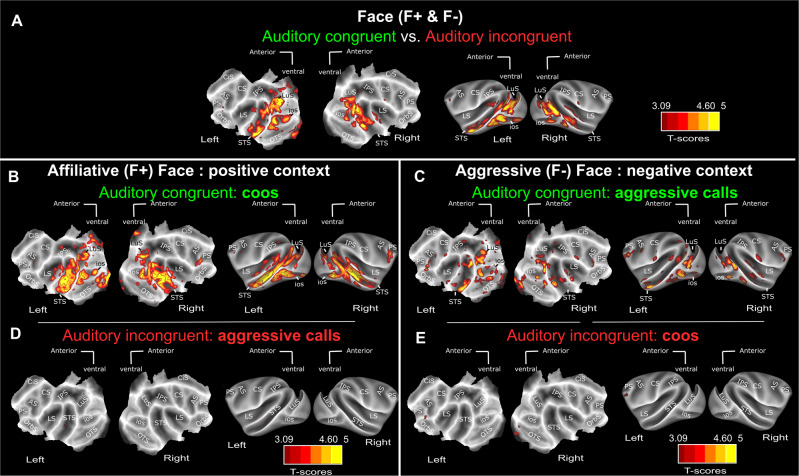
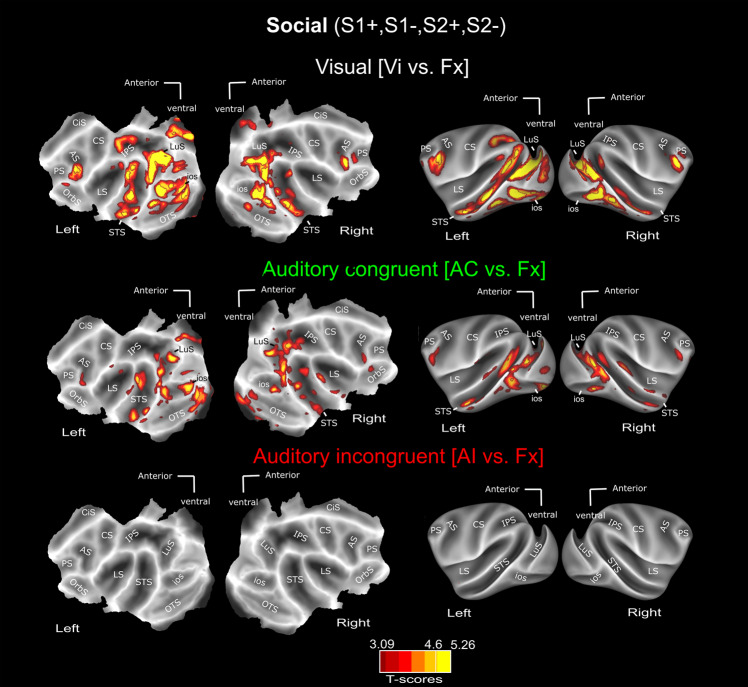
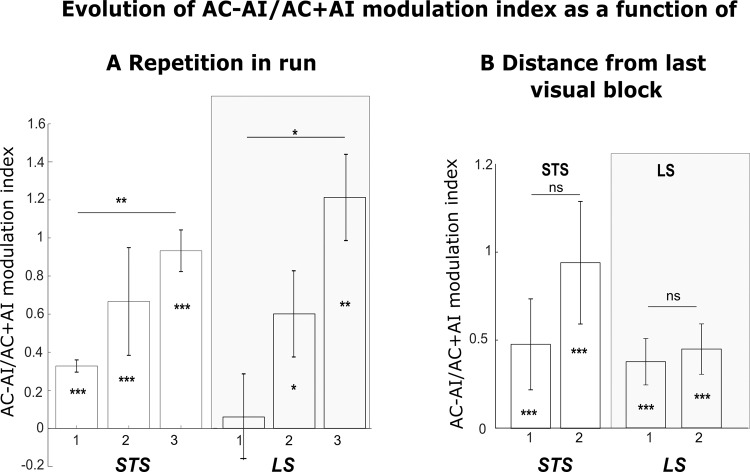
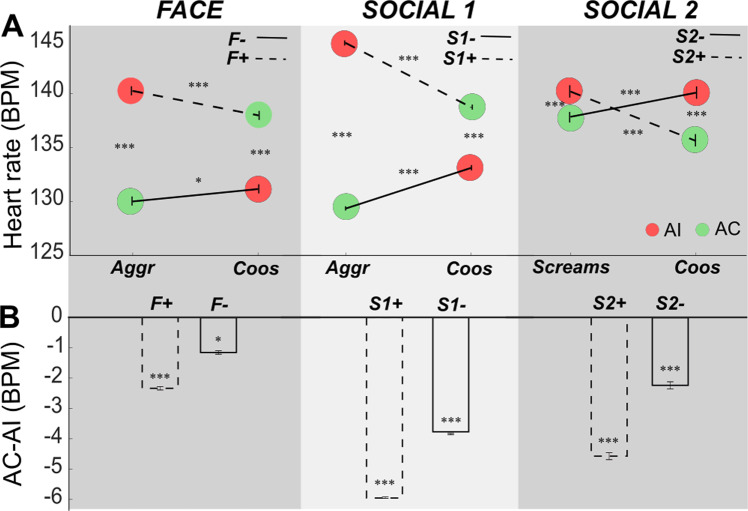
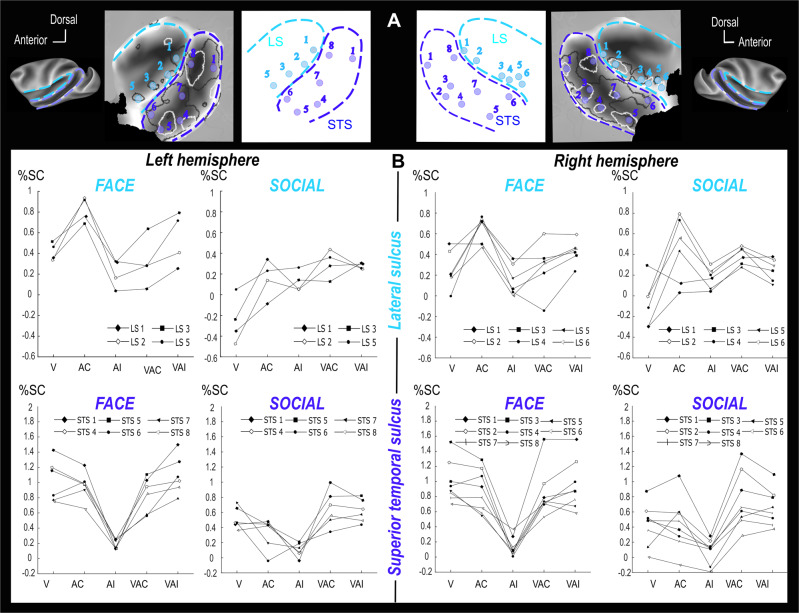
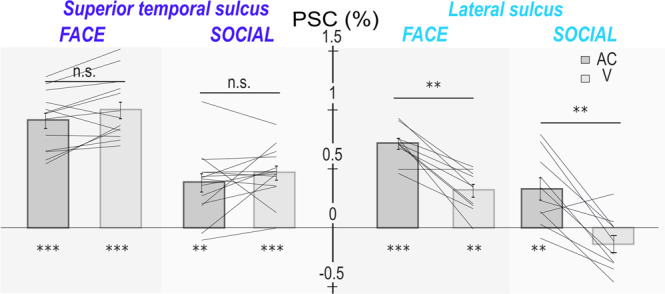
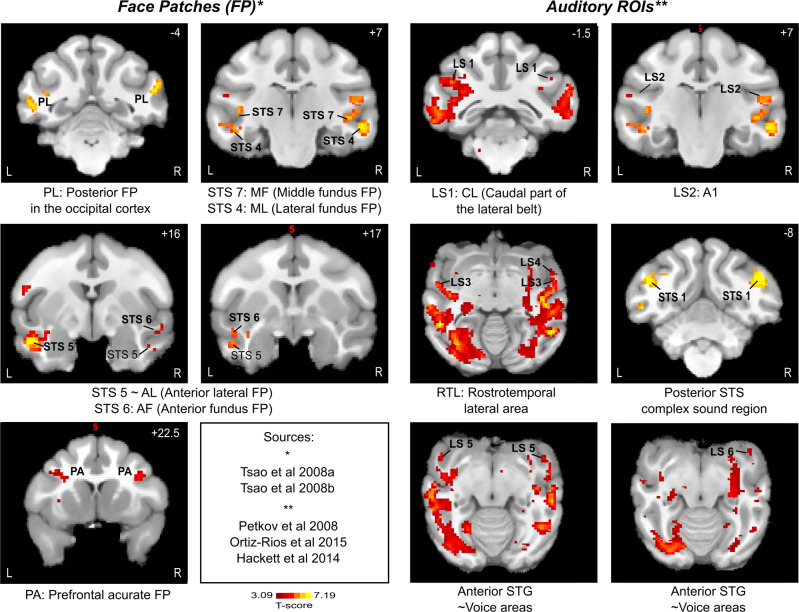
Social interactions rely on the interpretation of semantic and emotional information, often from multiple sensory modalities. Nonhuman primates send and receive auditory and visual communicative signals. However, the neural mechanisms underlying the association of visual and auditory information based on their common social meaning are unknown. Using heart rate estimates and functional neuroimaging, we show that in the lateral and superior temporal sulcus of the macaque monkey, neural responses are enhanced in response to species-specific vocalisations paired with a matching visual context, or when vocalisations follow, in time, visual information, but inhibited when vocalisation are incongruent with the visual context. For example, responses to affiliative vocalisations are enhanced when paired with affiliative contexts but inhibited when paired with aggressive or escape contexts. Overall, we propose that the identified neural network represents social meaning irrespective of sensory modality.


Conflict of interest statement

The authors declare no competing interests.

Figures

Fig. 1
Fig. 1. Description of experimental design and the six different contexts used in the study.
A Experimental design. Example of an aggressive face (F−) context. Each run was composed of three randomized repetitions of six different blocks of 16 s. The six blocks could be either visual stimuli only (Vi), auditory congruent stimuli only (AC), auditory incongruent stimuli only (AI), audio-visual congruent stimuli (VAC) or audio-visual incongruent stimuli (VAI), or fixation with no sensory stimulation (Fx). Block presentation was pseudo-randomized and counter-balanced so that, across all repetitions and all runs of given context, each block was, on average, preceded by the same number of blocks from the other conditions. Initial blocks were either a visual block (Vi, VAC, VAI), or a fixation block followed by a visual block (Vi, VAC or VAI), such that context was set by visual information early on in each run. Each sensory stimulation block contained a rapid succession of 500 ms stimuli. Each run started and ended with 10 seconds of fixation. B Description of contexts. Six different contexts were used. Each context combined visual stimuli of identical social content with either semantically congruent or incongruent monkey vocalisations. Pairs of contexts shared the same auditory stimuli, but opposite social visual content (F+ vs. F−; S1+ vs. S1−; S2+ vs. S2−). Each run corresponded to one of the semantic contexts described above. Visual stimuli were extracted from videos collected by the Ben Hamed lab, as well as by Marc Hauser on Cayo Santiago, Puerto Rico.
Fig. 2
Fig. 2. Whole-brain activation FACE contexts (F+ & F−): main contrasts.
Whole-brain activation maps of the F+ (face affiliative) and F− (face aggressive) runs, cumulated over both monkeys, for the visual (white, Vi vs. Fx), auditory congruent (green, AC vs. Fx) and auditory incongruent (red, AI vs. Fx). Note that the AC and AI conditions contain exactly the same sound samples (coos and aggressive calls). Darker shades of red indicate level of significance at p < 0.001 uncorrected, t-score > 3.09. Lighter shades of yellow and brown outlines indicate level of significance at p < 0.05 FWE correction, t-score > 4.6, DF [1, 5200]. ios Inferior Occipital Sulcus, LS Lateral Sulcus, STS Superior Temporal Sulcus, CiS Cingulate Sulcus, LuS Lunate Sulcus, IPS Intraparietal Sulcus, PS Precentral Sulcus, CS Central Sulcus, AS Arcuate Sulcus, OrbS Orbital Sulcus. See Supplementary Fig. S1 for individual monkey data. Corresponding size effects are presented is Supplementary Figs. S2, S6 and main Fig. 6.
Fig. 3
Fig. 3. Auditory activations depend on semantic congruence with visual context.
A Whole-brain activation maps of the F+ (face affiliative) and F− (face aggressive) runs, for the auditory congruent vs auditory incongruent (relative to the visual context) contrast. Whole-brain activation map for the F+ (face affiliative) (B) auditory congruent (coos, dark green, AC vs. Fx) and (D) auditory incongruent (aggressive calls, dark red, AI vs. Fx) conditions. Whole-brain activation map for the F− (face aggressive) (C) auditory congruent (aggressive calls, green, AC vs. Fx) and (E) auditory incongruent (coos, red, AI vs. Fx) conditions. Darker shades of red indicate level of significance at p < 0.001 uncorrected, t-score > 3.09. Lighter shades of yellow and brown outlines indicate level of significance at p < 0.05 FWE correction, t-score > 4.6, DF = [1, 2604] for F+ and F− DF = [1, 2618] and DF [1, 5200] for Face (F+ & F−). ios Inferior Occipital Sulcus, LS Lateral Sulcus, STS Superior Temporal Sulcus, CiS Cingulate Sulcus, LuS Lunate Sulcus, IPS Intraparietal Sulcus, PS Precentral Sulcus, CS Central Sulcus, AS Arcuate Sulcus, OrbS Orbital Sulcus.
Fig. 4
Fig. 4. Whole-brain activation Social contexts (S1+, S1−, S2+& S2−): main contrasts.
Whole-brain activation maps of the S1+, S2+ (social affiliative 1 & 2), S1− (social aggressive) and S2− (social escape) runs, cumulated over both monkeys, for the visual (white, Vi vs. Fx), auditory congruent (green, AC vs. Fx) and auditory incongruent (red, AI vs. Fx). Note that the AC and AI conditions contain exactly the same sound samples (coos, aggressive calls and screams). Darker shades of red indicate level of significance at p < 0.001 uncorrected, t-score 3.09. Lighter shades of yellow and brown outlines indicate level of significance at p < 0.05 FWE correction, t-score > 4.6, DF = [1, 10344]. ios Inferior Occipital Sulcus, LS Lateral Sulcus, STS Superior Temporal Sulcus, CiS Cingulate Sulcus, IPS Intraparietal Sulcus, PS Precentral Sulcus, CS Central Sulcus, AS Arcuate Sulcus, LuS Lunate Sulcus, OrbS Orbital Sulcus.
Fig. 5
Fig. 5. Distribution of AC-AI/AC+AI modulation index as a function of repetition in run and distance from last visual block.
Distribution of modulation index of percentage signal change (%SC) for the AC condition relative to fixation baseline compared to the AI condition relative to fixation baseline (AC − AI/AC + AI), as a function of repetition order in the run (A) or as a function of the distance from the last visual block (B), for each of the STS and LS, and each of the face and social runs, computed on individual ROIs across all runs. In (A), 1: first occurrence of AC or AI, 2: second occurrence, 3: third occurrence. In (B), 1: AC or AI just following a block with visual stimuli presentations, 2: AC or AI presented two blocks away from a block with visual stimuli presentations. Statistical differences relative to baseline or across conditions are indicated as follows: ***, p < 0.001; **, p < 0.01; *, p < 0.05; n.s., p > 0.05 (Wilcoxon two-sided non-parametric test: (A) STS 1: n = 14, Z = 3.21, p = 1.6e-06; 2: n = 14, Z = 3.41, p = 6.4e-04; 3: n = 14, Z = 4.78, p = 1.7e-06; 1–2: Z = 1.58, p = 0.11; 1–3: Z = 4.16, p = 0.003; 2–3: Z = 1.81, p = 0.06. LS: 1: n = 10, Z = 1.57, p = 0.11; 2: n = 10, Z = 2.38, p = 0.02; 3: n = 10, Z = 4.38, p = 0.01; 1–2: Z = 1.77, p = 0.07; 1–3: Z = 2.3, p = 0.02; 2–3: Z = 0.86, p = 0.38. B STS: 1: n = 196, Z = 3.26, p = 6.7e-12; 2: n = 196, Z = 3.62, p = 6.9e-12; 1–2: Z = 1.58, p = 0.19; LS: 1: Z = 3.18, p = 5.1e-12; 2: Z = 3.28, p = 6.7e-10; 1–2: Z = 0.05, p = 0.8). Data are presented as median ± s.e.
Fig. 6
Fig. 6. Context-related heart rate (BMP) variations.
A Absolute heart rate (BMP. beats per minute) during the congruent (green) and incongruent (red) auditory blocks of each task. Dashed lines correspond to the positive affiliative context (F+, S1+ and S2+) as defined by the visual stimuli. whereas continuous lines refer to the negative aggressive (F− and S1−) or escape contexts (S2−). Contexts are defined by pairs involving the same vocalisation categories but different visual stimuli, as defined in Fig. 1b. There is a general context effect on heart rate (Friedman non-parametric test, X2(253) = 437.8, p = 6.7e-286). There is a significant difference of HR for a same sound as a function of the context (Wilcoxon paired two-sided non-parametric test, all n = 127, aggressive calls between the F+ and F− contexts: Z = 13.77, p = 3.6e-43, Cohen’s d: 16.3 and S1+ and S1−: Z = 13.82, p = 1.8e-43, Cohen’s d: 91.6; Coos between the F+ and F−: Z = 13.87, p = 9.1e-44, Cohen’s d: 47.05, S1+ and S1−: Z = 13.78, p = 3.5e-43, Cohen’s d: 17.42 and S2+ and S2− contexts: Z = 13.78, p = 3.6e-43, Cohen’s d: 5.987 and for screams between S2+ and S2− contexts: Z = 13.77, p = 3.6e-43, Cohen’s d: 4.01). Each context pair shows significantly higher heart rates for incongruent auditory stimuli compared to congruent auditory stimuli (Friedman non-parametric test, Face: X2(253) = 271.442, p = 2.8e-82; Social 1:, X2(253) = 295.34, p = 1.3e-87; Social 2:, X2(253) = 174.66, p = 5.4e-78). This is also true for each individual context (Wilcoxon paired two-sided non-parametric test. F+ : Z = 13.98, p = 9.1e-49, Cohen’s d: 4.5, F−: Z = 9.77, p = 0.012, Cohen’s d: 3.9, S1+: Z = 13.76, p = 4.4e-49, Cohen’s d 19.7, S1−: Z = 13.72, p = 4e-49, Cohen’s d 18.66, S2+: Z = 13.82, p = 3.6e-49, Cohen’s d: 8.1, S2−: Z = 13.77, p = 4.4e-49, Cohen’s d: 2.92). B Difference between AC and AI bloc (medians ± s.e). All significantly different from zero (Wilcoxon paired two-sided non-parametric test. F+ : n = 127, Z = 13.98, p = 4.4e-5, Cohen’s d: 4.5, F−: n = 127, Z = 9.77, p = 0.012, Cohen’s d: 3.9, S1+ : n = 127; Z = 13.76, p = 2.4e-04, Cohen’s d 19.7, S1−: n = 127, Z = 13.72, p = 2e-04, Cohen’s d: 18.66, S2+ : n = 127, Z = 13.82, p = 4.3e-05, Cohen’s d: 8.1, S2−: n = 127, Z = 13.77, p = 2.4e-04, Cohen’s d: 2.92. Note that for every item, Cohen’s d coefficient is higher than 0.8. Each effect size is therefore considered as large. ***, p < 0.001; **, p < 0.01; *, p < 0.05; n.s., p > 0.05.
Fig. 7
Fig. 7. Percentage of signal change (%SC) for selected left and right hemisphere ROIs in the lateral sulcus (light blue) and in the superior temporal sulci (dark blue).
A ROIs are 1.5 mm spheres located at local peak activations. Left and right hemisphere numbering associate mirror ROIs. ROI location in the each of the left and right STS and LS is described in the bottom flat maps. B %SC (median) are presented for each ROI (eight in right STS, six in left STS, four in left and six in right lateral sulcus) and each contrast of interest (V visual vs fixation, AC auditory congruent vs fixation, AI auditory incongruent vs fixation, VAC visuo-auditory congruent vs fixation, VAI visuo-auditory incongruent vs fixation).
Fig. 8
Fig. 8. Percentage of signal change (PSC) across all lateral sulcus (light blue) and superior temporal sulci (dark blue) ROIs of both hemispheres, comparing the auditory and visual contexts (median ± s.e., single lines correspond to the PSC computed over single ROIs from the group analysis; n = 14 ROIs for STS and n = 10 ROIs for LS).
Statistical differences relative to fixation are between contexts and indicated as follows: ***, p < 0.001; **, p < 0.01; n.s., p > 0.05 (Wilcoxon two-sided non-parametric test). STS: FACE: AC: n = 560, Z = 16.14, p = 4.1e-57; V: n = 560, Z = 19.35, p = 1.8e-68; AC vs V: Z = 1.68, p = 0.09. SOCIAL: AC: n = 1106, Z = 11.49, p = 0.0011; V: n = 1106, Z = 14.87, p = 1.5e-49; AC vs V: Z = 2.4, p = 0.051. LS: FACE: AC: n = 400, Z = 11.65, p = 2.4e-31; V: n = 400, Z = 4.84, p = 0.002; AC vs V: Z = 3.97, p = 0.01. SOCIAL: AC: n = 790, Z = 5.86, p = 0.002; V: n = 790, Z = −0.7, p = 0.45; AC vs V: Z = 4.7, p = 0.0013.
Fig. 9
Fig. 9. Whole-brain activations for the Face (F+& F−) and Social contexts (S1+, S1−, S2+& S2−): bimodal versus unimodal contrasts.
A Whole-brain activation maps of the F+ (face affiliative) and F− (face aggressive) runs (left panel) and the S1+, S2+ (social affiliative 1 & 2), S1− (social aggressive) and S2− (social escape) runs (right panel) for the congruent audio-visual stimulation (blue). Contrasts from top to bottom: audio-visual vs. fixation, audio-visual vs. auditory congruent and audio-visual vs. visual. B Same as in (A) but for the incongruent audio-visual stimulation (pink). C Whole-brain activation maps for the audio-visual incongruent vs audio-visual congruent contrast. All else as in (A). Darker shades of red indicate level of significance at p < 0.001 uncorrected, t-score > 3.09. Lighter shades of yellow and brown outlines indicate level of significance at p < 0.05 FWE correction, t-score > 4.6. DF = [1, 5200] for Face and DF = [1,10344] for Social.
Fig. 10
Fig. 10. Correspondence between task-related ROIs and face patches (left panels) and voice areas (right panels).
Color-scale runs start at p < 0.001 uncorrected levels. Task related ROIs are numbered as in Fig. 7. PA prefrontal acurate, AM anterior medial, AF anterior fundus, AL anterior lateral, MF middle fundus, ML middle lateral, PL a posterior face patch in the occipital cortex, CL Caudal part of the lateral belt, A1 primary auditory cortex, RTL Rostrotemporal lateral area, STS Superior Temporal Sulcus, STG Superior Temporal Gyrus. *: Sources for face patch localization. **: Sources for voice areas.

Similar articles

Cited by

References

    1. Fox KCR, Muthukrishna M, Shultz S. The social and cultural roots of whale and dolphin brains. Nat. Ecol. Evol. 2017;1:1699–1705. doi: 10.1038/s41559-017-0336-y. - DOI - PubMed
    1. Shultz S, Dunbar R. Encephalization is not a universal macroevolutionary phenomenon in mammals but is associated with sociality. Proc. Natl Acad. Sci. 2010;107:21582–21586. doi: 10.1073/pnas.1005246107. - DOI - PMC - PubMed
    1. Van Essen DC, Dierker DL. Surface-based and probabilistic atlases of primate cerebral cortex. Neuron. 2007;56:209–225. doi: 10.1016/j.neuron.2007.10.015. - DOI - PubMed
    1. Devaine M, et al. Reading wild minds: a computational assay of Theory of Mind sophistication across seven primate species. PLOS Comput. Biol. 2017;13:e1005833. doi: 10.1371/journal.pcbi.1005833. - DOI - PMC - PubMed
    1. Mars, R. B. et al. On the relationship between the “default mode network” and the “social brain”. Front. Hum. Neurosci. 6, 189 (2012). - PMC - PubMed

Publication types