. 2022 Aug 19;13(1):4892.
doi: 10.1038/s41467-022-32634-0.

Immune-mediated tubule atrophy promotes acute kidney injury to chronic kidney disease transition

Affiliations

Immune-mediated tubule atrophy promotes acute kidney injury to chronic kidney disease transition

Leyuan Xu et al. Nat Commun. .

Abstract

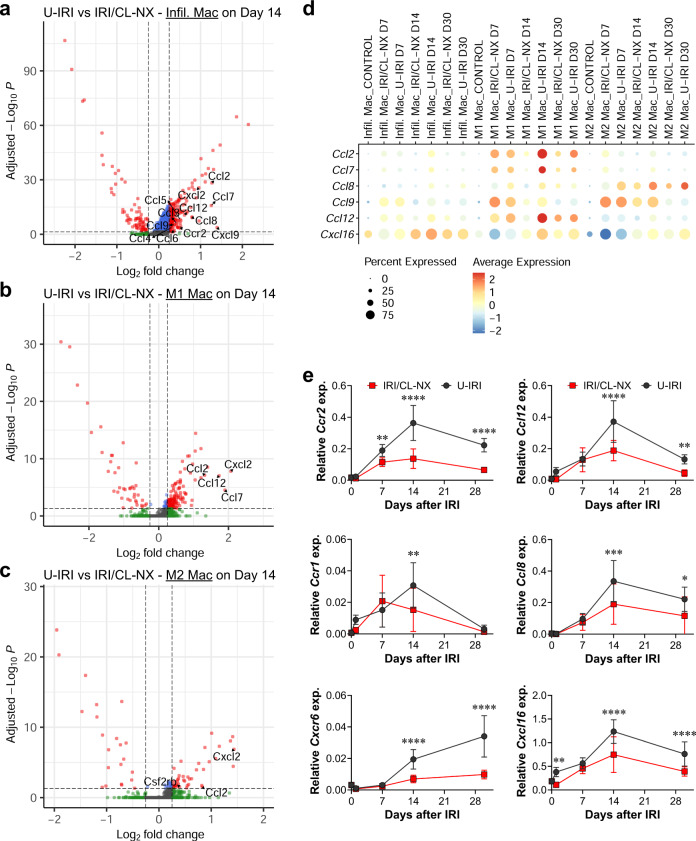
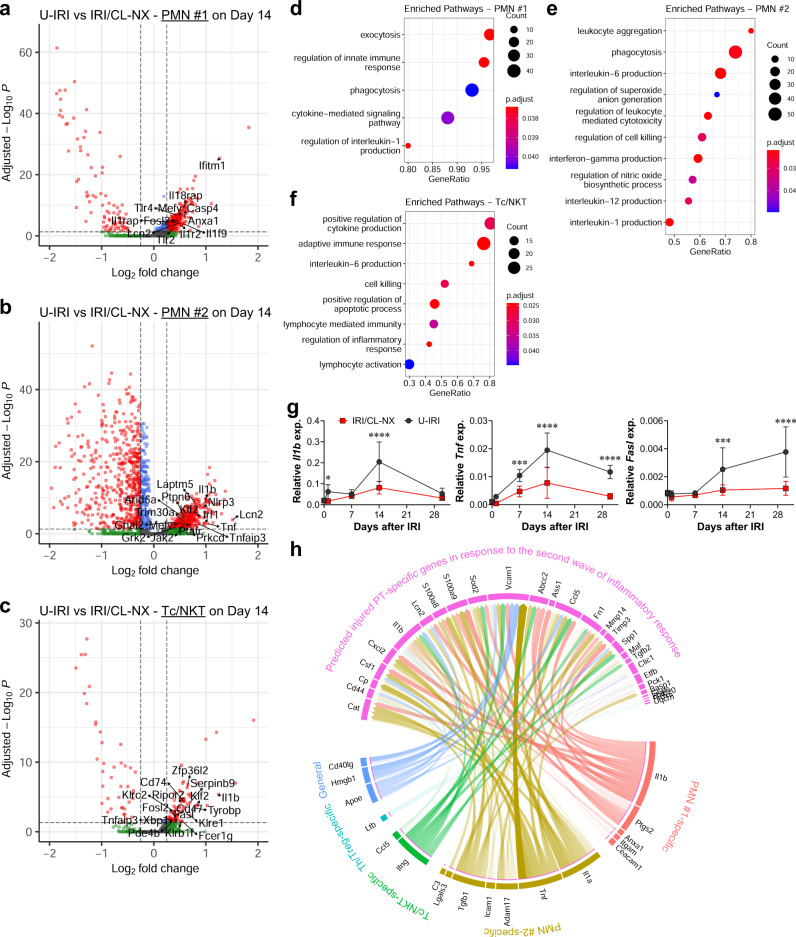
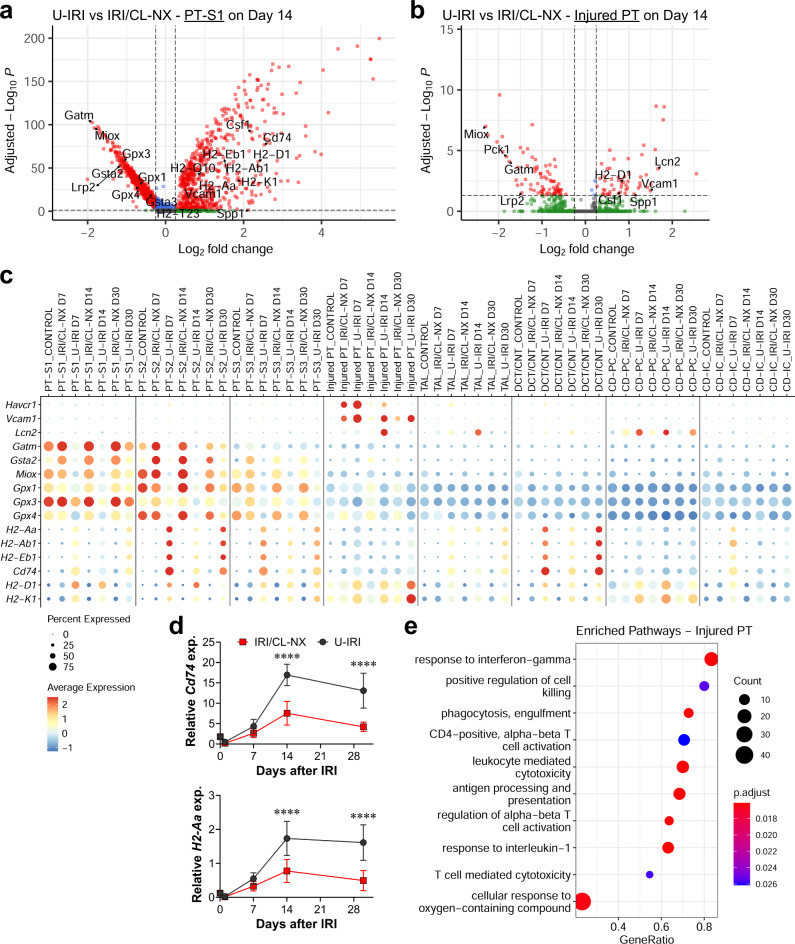
Incomplete repair after acute kidney injury can lead to development of chronic kidney disease. To define the mechanism of this response, we compared mice subjected to identical unilateral ischemia-reperfusion kidney injury with either contralateral nephrectomy (where tubule repair predominates) or contralateral kidney intact (where tubule atrophy predominates). By day 14, the kidneys undergoing atrophy had more macrophages with higher expression of chemokines, correlating with a second wave of proinflammatory neutrophil and T cell recruitment accompanied by increased expression of tubular injury genes and a decreased proportion of differentiated tubules. Depletion of neutrophils and T cells after day 5 reduced tubular cell loss and associated kidney atrophy. In kidney biopsies from patients with acute kidney injury, T cell and neutrophil numbers negatively correlated with recovery of estimated glomerular filtration rate. Together, our findings demonstrate that macrophage persistence after injury promotes a T cell- and neutrophil-mediated proinflammatory milieu and progressive tubule damage.


Conflict of interest statement

The authors declare no competing interests.

Figures

Fig. 1
Fig. 1. U-IRI leads to tubule atrophy.
Wild-type mice were subjected to 27 min of ischemia/reperfusion injury (IRI) with contralateral nephrectomy (IRI/CL-NX) or unilateral IRI (U-IRI) and sacrificed on day 1, 7, 14, and 30 after injury. a Kidney-to-body weight ratios were determined on day 1, 7, 14, and 30 after injury. Data are presented as mean ± SD. n = 10 kidneys/time point. p < 0.0001 between models and in time series (by two-way ANOVA); ****p < 0.0001 in the indicated subgroup analyses (by Bonferroni multiple comparison). b Kidney weights were determined on day 30 after injury. CTRL, age-matched control. Data are presented as mean ± SD. n = 9 control kidneys. n = 10 kidneys/model. p < 0.0001 by one-way ANOVA; ****p < 0.0001 in the indicated subgroup analyses (by Tukey multiple comparison). c Midline kidney cross-section area was determined on day 30 after injury. CTRL, age-matched control. Data are presented as mean ± SD. n = 9 control kidneys. n = 10 injured kidneys/model. p < 0.0001 by one-way ANOVA; **p < 0.01 (p = 0.0075), ****p < 0.0001 in the indicated subgroup analyses (by Tukey multiple comparison). d Midline kidney sections on day 30 after IRI were co-stained with kidney-specific (KSP)-cadherin (red), uromodulin (UMOD, green), and DAPI (blue). Scale bars, 1 mm. e KSP-cadherin-positive area as in d was quantified for the entire kidney section (left panel) and as a percentage of the section area (right panel). Data are presented as mean ± SD. n = 10 kidneys/model. *p < 0.05 (p = 0.0424), ****p < 0.0001 by unpaired two-tailed t-test. f Midline kidney sections underwent IHC staining for lotus tetragonolobus lectin (LTL, dark gray) on day 30 after IRI. Scale bars, 1 mm. g LTL-positive area as in f was quantified for the entire kidney section (left panel) and as a percentage of the section area (right panel). Data are presented as mean ± SD. n = 10 kidneys/model. ****p < 0.0001 by unpaired two-tailed t-test. h Midline kidney sections underwent IHC staining for megalin (dark gray) on day 30 after IRI. Scale bars, 1 mm. i Megalin-positive area as in h was quantified for the entire kidney section (left panel) and as a percentage of the section area (right panel). Data are presented as mean ± SD. n = 10 kidneys/model. ****p < 0.0001 by unpaired two-tailed t-test.
Fig. 2
Fig. 2. U-IRI leads to failure of tubular redifferentiation and exaggerated Vcam1 expression.
Wild-type mice were subjected to 27 min of ischemia/reperfusion injury (IRI) with contralateral nephrectomy (IRI/CL-NX) or unilateral IRI (U-IRI) and sacrificed on day 1, 7, 14, and 30 after injury. The injured kidneys and normal control kidneys (defined as day 0) were harvested. a Quantitative RT-PCR analysis for Lrp2 (megalin), Slc34a1 (sodium-dependent phosphate transporter 2A, Napi2a), Slc13a3 (sodium-dependent dicarboxylate transporter, NaDC3), Havcr1 (kidney injury molecule-1, Kim1), and Vcam1 (vascular cell adhesion molecule-1) was performed on whole-kidney RNA. Data are presented as mean ± SD. n = 10 kidneys/time point/model. Two-way ANOVA was summarized in Supplementary Table 1. *p < 0.05, ***p < 0.01, ***p < 0.001, ****p < 0.0001 at the indicated time points (by Bonferroni multiple comparison). b Midline kidney sections underwent IF staining for megalin (green) and KIM-1 (red) on day 0, 1, 7, 14, and 30 after IRI with representative images shown at 20×. Scale bars, 50 μm. c Megalin- (top) and KIM-1- (bottom) positive areas as in b were quantified as a percentage of 6–10 randomly selected areas/kidney section. Data are presented as mean ± SD. n = 8 kidneys quantified/model. Two-way ANOVA [p < 0.0001 (interaction, time factor, and model factor) for megalin; p = 0.0003 (interaction), p < 0.0001 (time factor), p = 0.0228 (model factor) for KIM-1]. ****p < 0.0001 at the indicated time points (by Bonferroni multiple comparison).
Fig. 3
Fig. 3. Integrated scRNA-seq analysis of differential cell type populations between IRI/CL-NX and U-IRI kidneys and control kidneys.
Wild-type mice were subjected to 27 min of ischemia/reperfusion injury (IRI) with contralateral nephrectomy (IRI/CL-NX) or unilateral IRI (U-IRI) and sacrificed on day 7, 14, and 30 after injury. Injured kidneys (n = 2 kidneys/model/time point) and normal control kidneys (n = 2 kidneys) were harvested for single-cell-RNA-sequencing analysis. a UMAP projection of 95,343 cells from integrated kidneys. Cell clusters were identified using the composite data from all cells by kidney cell and immune cell lineage-specific marker expression as shown in b. PT, proximal tubule; TAL, thick ascending limb; DCT, distal convoluted tubule; CNT, connecting tubule; CD-PC, collecting duct-principal cell; CD-IC, collecting duct-intercalated cell; Infil. Mac, infiltrating macrophage; Mac, macrophage; Prolif. Mac, proliferating macrophage; Resid. Mac, resident macrophage; pDC, plasmacytoid dendritic cell; cDC, conventional dendritic cell; PMN, polymorphonuclear neutrophil; Naïve T, naïve T cell; Th/Treg, T helper/regulatory T cell; Tc/NKT, cytotoxic T/natural killer T cell; B, B cell. c The percentage of the cell populations is provided for each group. The number of cells in each cluster/kidney is summarized in Supplementary Table 2.
Fig. 4
Fig. 4. U-IRI promotes late immune cell accumulation.
Wild-type mice were subjected to 27 min of ischemia/reperfusion injury (IRI) with contralateral nephrectomy (IRI/CL-NX) or unilateral IRI (U-IRI) and sacrificed on day 1, 7, 14, and 30 after injury. The injured kidneys and normal control kidneys (defined as day 0) were analyzed. a Quantitative RT-PCR analysis for Adgre1 (F4/80), Itgax, Ly6g, Cd3e, Cd4, and Cd8a was performed on whole-kidney RNA. Data are presented as mean ± SD. n = 10 kidneys/time point/model. Two-way ANOVA is summarized in Supplementary Table 1. *p < 0.05 (p = 0.0449), ****p < 0.0001 at the indicated time points (by Bonferroni multiple comparison). b Contralateral (CL), U-IRI and IRI/CL-NX kidney sections on day 14 after IRI were immunostained with F4/80, CD11c, Ly6G, CD3ε, CD4, and CD8α. Images that are representative of those taken from 10 kidneys/model are shown at 40x magnification. Scale bars, 50 µm. c F4/80-, CD11c-, Ly6G-, CD3ε-, CD4-, and CD8α-positive areas as in b were quantified. Data were presented as mean ± SD. n = 10 kidneys/group. Two-way ANOVA is summarized in Supplementary Table 3. *p < 0.05, **p < 0.01, ***p < 0.001, ****p < 0.0001 in the indicated subgroup analyses by Tukey multiple comparison.
Fig. 5
Fig. 5. U-IRI promotes increased chemokine expression 2 weeks after IRI.
Wild-type mice were subjected to 27 min of ischemia/reperfusion injury (IRI) with contralateral nephrectomy (IRI/CL-NX) or unilateral IRI (U-IRI) and sacrificed on day 7, 14 and 30 after injury. Injured kidneys and normal control kidneys were harvested for single-cell-RNA-sequencing analysis as shown in Fig. 3. ac Volcano plots demonstrating differential gene expression in infiltrating macrophages (Infil. Mac, a); proinflammatory macrophages (M1 Mac, b); and alternatively activated macrophage (M2 Mac, c) on day 14 after U-IRI compared to IRI/CL-NX. d The distribution and relative expression of chemokines are visualized in the dot plot. D7, Day 7; D14, Day 14; D30, Day 30. e Quantitative RT-PCR analysis for the indicated chemokines and chemokine receptors was performed on whole-kidney RNA harvested on day 0, 1, 7, 14, and 30 after injury. Data are presented as mean ± SD. n = 10 kidneys/time point/model. Two-way ANOVA is summarized in Supplementary Table 1. *p < 0.05, **p < 0.01, ***p < 0.001, ****p < 0.0001 at the indicated time points (by Bonferroni multiple comparison).
Fig. 6
Fig. 6. U-IRI promotes a second wave of immune cell recruitment.
Wild-type mice were subjected to 27 min of ischemia/reperfusion injury (IRI) with contralateral nephrectomy (IRI/CL-NX) or unilateral IRI (U-IRI) and sacrificed on day 7, 14, and 30 after injury. Injured kidneys and normal control kidneys were harvested for single-cell-RNA-sequencing analysis as shown in Fig. 3. a, b Genes that were differentially expressed on day 14 after injury by the infiltrating (Infil.), M1, M2 macrophages (Mac), and in any combination (General) in U-IRI kidneys as compared to IRI/CL-NX kidneys were linked to their corresponding receptors based on the potential target genes (as shown in Supplementary Fig. 16) expressed by polymorphonuclear neutrophil cluster #1 (PMN #1) (a) and cytotoxic T/natural killer T (Tc/NKT) cells (b) and visualized by a chord diagram. c The top relevant enriched gene ontology (GO) terms for infiltrating (top panel) and M1 (lower panel) macrophages are visualized in the dot plots. d Representative images of immunofluorescence (IF) staining for F4/80 (green), CD3ε (red on the left panel), and Ly6G (red on the right panel) using cryosections from three kidneys 14 days after U-IRI. T, tubules; *, macrophahges; #, T cells; ^, PMNs. Scale bars: 10 μm.
Fig. 7
Fig. 7. U-IRI promotes late PMN- and T- cell-mediated inflammation.
Wild-type mice were subjected to 27 min of ischemia/reperfusion injury (IRI) with contralateral nephrectomy (IRI/CL-NX) or unilateral IRI (U-IRI) and sacrificed on day 7, 14, and 30 after injury. Injured kidneys and normal control kidneys were harvested for single-cell-RNA-sequencing analysis as shown in Fig. 3. ac Volcano plots demonstrating differential gene expression in U-IRI compared to IRI/CL-NX derived polymorphonuclear neutrophil cluster #1 (PMN #1) (a), PMN cluster #2 (b), and Cd8a+ cytotoxic T/natural killer T (Tc/NKT) cells (c) on day 14 after injury. d–f Based on differentially expressed genes (DEG) between U-IRI and IRI/CL-NX kidneys on day 14 after injury, the top relevant enriched gene ontology (GO) terms for PMN cluster #1 (d), PMN cluster #2 (e), and Cd8a+ Tc/NKT cells (f) in the U-IRI kidneys are visualized in the dot plots. g Quantitative RT-PCR analysis for indicated genes was performed on whole-kidney RNA harvested on day 0, 1, 7, 14, and 30 after injury. Data are presented as mean ± SD. n = 10 kidneys/time point/model. Two-way ANOVA is summarized in Supplementary Table 1. *p < 0.05, ***p < 0.001, ****p < 0.0001 at the indicated time points (by Bonferroni multiple comparison). h Based on DEG between U-IRI and IRI/CL-NX kidneys on day 14 after injury, the potential ligands expressed by the PMNs, Cd8a+ Tc/NKT, and Cd4 + T helper/regulatory T (Th/Treg) cells were linked to their corresponding potential target genes for the injured proximal tubule (PT) cells and visualized by a chord diagram.
Fig. 8
Fig. 8. Identifying the injury signature of inflammation-induced tubular stress.
Wild-type mice were subjected to 27 min of ischemia/reperfusion injury (IRI) with contralateral nephrectomy (IRI/CL-NX) or unilateral IRI (U-IRI) and sacrificed on day 7, 14, and 30 after injury. Injured kidneys and normal control kidneys were harvested for single-cell-RNA-sequencing analysis as shown in Fig. 3. a, b Volcano plots demonstrating the differential gene expression in cells from segment 1 of the proximal tubule (PT-S1, a) and injured PT (b) 14 days after U-IRI compared to IRI/CL-NX. c The distribution and relative expression of the injury markers (Havcr1, Vcam1, and Lcn2), anti-oxidative stress and detoxification genes (Gatm, Gsta2, Miox, Gpx1, Gpx3, and Gpx4), and the major histocompatibility complex class II (H2-Aa, H2-Ab1, H2-Eb1, and Cd74) and class I (H2-D1 and H2-K1) are visualized in a dot plot. d Quantitative RT-PCR analysis for indicated genes was performed on whole-kidney RNA harvested on day 0, 1, 7, 14, and 30 after injury. Data are presented as mean ± SD. n = 10 kidneys/time point/model. Two-way ANOVA is summarized in Supplementary Table 1. ****p < 0.0001 at the indicated time points (by Bonferroni multiple comparison). e Based on differentially expressed genes (DEG) between U-IRI and IRI/CL-NX kidneys on day 14 after injury, the top relevant enriched gene ontology (GO) terms for injured proximal tubule (PT) in the U-IRI kidneys are visualized in the dot plots.
Fig. 9
Fig. 9. Dual depletion of T cells and neutrophils attenuates kidney tubule atrophy.
WT mice were treated as described in Methods with either PBS or a combination of antibodies (Ab)-against Thy1.2 and Ly6G beginning 5 days after unilateral ischemia/reperfusion injury (U-IRI) and sacrificed on day 30. a The IRI kidney sections were immunostained with CD3ε and Ly6G. Nine kidneys/group were sectioned and stained, and representative images are shown. Scale bars, 25 µm. b CD3ε-, CD8α-, and Ly6G-positive areas were quantified using Image J. Data are presented as mean ± SD. n = 9 kidney sections/group. ****p < 0.0001 by unpaired two-tailed t-test. c Quantitative RT-PCR analysis for Cd3e, Cd4, Cd8a, and Ly6g was performed on whole-kidney RNA on day 30 after U-IRI ± dual T-cell/neutrophil depletion. Data are presented as mean ± SD. n = 9 kidneys/group. ***p < 0.001, ****p < 0.0001 by unpaired two-tailed t-test. d Kidney-to-body weight ratios on day 30 following U-IRI ± dual T-cell/neutrophil depletion. Data are presented as mean ± SD. n = 9 kidneys/group. **p < 0.01 by unpaired two-tailed t-test. e Kidney sections from day 30 after U-IRI ± dual T-cell/neutrophil depletion were immunostained with lotus tetragonolobus lectin (LTL, dark gray). Nine kidneys were sectioned and stained and representative images are shown. Scale bars, 1 mm. f LTL-positive area was quantified from the entire section (left panel) and as a percentage of the section (right panel). Data are presented as mean ± SD. n = 9 kidneys/group. ***p < 0.001 by unpaired two-tailed t-test. g Quantitative RT-PCR analysis for Lrp2 and Slc34a1 was performed on whole-kidney RNA from U-IRI mice ± dual T-cell/neutrophil depletion. Data are presented as mean ± SD. n = 9 kidneys/group. *p < 0.05 by unpaired two-tailed t-test.
Fig. 10
Fig. 10. Accumulation of T cells and neutrophils negatively associates with GFR recovery in patients with AKI.
a The estimated GFR (eGFR) was determined at reference, biopsy (AKI), and 6-month follow-up (6 m F/U). b Biopsy sections from each patient were immunofluorescence-stained with anti-CD3ε (T-cell marker) and anti-megalin (PT marker, left panel) or anti-CD66b (PMN marker, right panel) and the percentage of nuclei positive for CD3ε and CD66b calculated for all sections. Representative images of biopsies from a patient with full recovery [Case #0252, 150% recovery of GFR, magenta triangle in a], low-recovery [Case #0284, 52% recovery of GFR, green square in a], and a healthy living donor are shown. Scale bars, 50 µm. c Correlation between absolute eGFR increase (ΔeGFR) within 6 months after biopsy and T-cell infiltrate (%) or neutrophil infiltrate (%) at the time of AKI biopsy was determined by nonparametric Spearman correlation coefficient r. d Correlation between relative eGFR increase (fold change) within 6 months (6 m) after biopsy and T-cell infiltrate (%) or neutrophil infiltrate (%) at the time of biopsy was determined by nonparametric Spearman correlation coefficient r.

References

    1. Zuk A, Bonventre JV. Recent advances in acute kidney injury and its consequences and impact on chronic kidney disease. Curr. Opin. Nephrol. Hypertens. 2019;28:397–405. doi: 10.1097/MNH.0000000000000504. - DOI - PMC - PubMed
    1. Wilflingseder J, et al. Enhancer and super-enhancer dynamics in repair after ischemic acute kidney injury. Nat. Commun. 2020;11:3383. doi: 10.1038/s41467-020-17205-5. - DOI - PMC - PubMed
    1. Chang-Panesso M, Humphreys BD. Cellular plasticity in kidney injury and repair. Nat. Rev. Nephrol. 2017;13:39–46. doi: 10.1038/nrneph.2016.169. - DOI - PubMed
    1. Kirita Y, Wu H, Uchimura K, Wilson PC, Humphreys BD. Cell profiling of mouse acute kidney injury reveals conserved cellular responses to injury. Proc. Natl Acad. Sci. USA. 2020;117:15874–15883. doi: 10.1073/pnas.2005477117. - DOI - PMC - PubMed
    1. He L, et al. AKI on CKD: heightened injury, suppressed repair, and the underlying mechanisms. Kidney Int. 2017;92:1071–1083. doi: 10.1016/j.kint.2017.06.030. - DOI - PMC - PubMed

Publication types